Tag Archives: Technical How-to

Running cost optimized Spark workloads on Kubernetes using EC2 Spot Instances

Post Syndicated from Emma White original https://aws.amazon.com/blogs/compute/running-cost-optimized-spark-workloads-on-kubernetes-using-ec2-spot-instances/

This post is written by Kinnar Sen, Senior Solutions Architect, EC2 Spot 

Apache Spark is an open-source, distributed processing system used for big data workloads. It provides API operations to perform multiple tasks such as streaming, extract transform load (ETL), query, machine learning (ML), and graph processing. Spark supports four different types of cluster managers (Spark standalone, Apache Mesos, Hadoop YARN, and Kubernetes), which are responsible for scheduling and allocation of resources in the cluster. Spark can run with native Kubernetes support since 2018 (Spark 2.3). AWS customers that have already chosen Kubernetes as their container orchestration tool can also choose to run Spark applications in Kubernetes, increasing the effectiveness of their operations and compute resources.

In this post, I illustrate the deployment of scalable, resilient, and cost optimized Spark application using Kubernetes via Amazon Elastic Kubernetes Service (Amazon EKS) and Amazon EC2 Spot Instances. Learn how to save money on big data workloads by implementing this solution.

Overview

Amazon EC2 Spot Instances

Amazon EC2 Spot Instances let you take advantage of unused EC2 capacity in the AWS Cloud. Spot Instances are available at up to a 90% discount compared to On-Demand Instance prices. Capacity pools are a group of EC2 instances that belong to particular instance family, size, and Availability Zone (AZ). If EC2 needs capacity back for On-Demand Instance usage, Spot Instances can be interrupted by EC2 with a two-minute notification. There are many graceful ways to handle the interruption to ensure that the application is well architected for resilience and fault tolerance. This can be automated via the application and/or infrastructure deployments. Spot Instances are ideal for stateless, fault tolerant, loosely coupled and flexible workloads that can handle interruptions.

Amazon Elastic Kubernetes Service

Amazon EKS is a fully managed Kubernetes service that makes it easy for you to run Kubernetes on AWS without needing to install, operate, and maintain your own Kubernetes control plane. It provides a highly available and scalable managed control plane. It also provides managed worker nodes, which let you create, update, or terminate shut down worker nodes for your cluster with a single command. It is a great choice for deploying flexible and fault tolerant containerized applications. Amazon EKS supports creating and managing Amazon EC2 Spot Instances using Amazon EKS-managed node groups following Spot best practices. This enables you to take advantage of the steep savings and scale that Spot Instances provide for interruptible workloads running in your Kubernetes cluster. Using EKS-managed node groups with Spot Instances requires less operational effort compared to using self-managed nodes. In addition to launching Spot Instances in managed node groups, it is possible to specify multiple instance types in EKS managed node groups. You can find more in this blog.

Apache Spark and Kubernetes

When a spark application is submitted to the Kubernetes cluster the following happens:

  • A Spark driver is created.
  • The driver and the run within pods.
  • The Spark driver then requests for executors, which are scheduled to run within pods. The executors are managed by the driver.
  • The application is launched and once it completes, the executor pods are cleaned up. The driver pod persists the logs and remains in a completed state until the pod is cleared by garbage collection or manually removed. The driver in a completed stage does not consume any memory or compute resources.

Spark Deployment on Kubernetes Cluster

When a spark application runs on clusters managed by Kubernetes, the native Kubernetes scheduler is used. It is possible to schedule the driver/executor pods on a subset of available nodes. The applications can be launched either by a vanilla ‘spark submit’, a workflow orchestrator like Apache Airflow or the spark operator. I use vanilla ‘spark submit’ in this blog. is also able to schedule Spark applications on EKS clusters as described in this launch blog, but Amazon EMR on EKS is out of scope for this post.

Cost optimization

For any organization running big data workloads there are three key requirements: scalability, performance, and low cost. As the size of data increases, there is demand for more compute capacity and the total cost of ownership increases. It is critical to optimize the cost of big data applications. Big Data frameworks (in this case, Spark) are distributed to manage and process high volumes of data. These frameworks are designed for failure, can run on machines with different configurations, and are inherently resilient and flexible.

If Spark deploys on Kubernetes, the executor pods can be scheduled on EC2 Spot Instances and driver pods on On-Demand Instances. This reduces the overall cost of deployment – Spot Instances can save up to 90% over On-Demand Instance prices. This also enables faster results by scaling out executors running on Spot Instances. Spot Instances, by design, can be interrupted when EC2 needs the capacity back. If a driver pod is running on a Spot Instance, which is interrupted then the application fails and the application must be re-submitted. To avoid this situation, the driver pod can be scheduled on On-Demand Instances only. This adds a layer of resiliency to the Spark application running on Kubernetes. To cost optimize the deployment, all the executor pods are scheduled on Spot Instances as that’s where the bulk of compute happens. Spark’s inherent resiliency has the driver launch new executors to replace the ones that fail due to Spot interruptions.

There are a couple of key points to note here.

  • The idea is to start with minimum number of nodes for both On-Demand and Spot Instances (one each) and then auto-scale usingCluster Autoscaler and EC2 Auto Scaling  Cluster Autoscaler for AWS provides integration with Auto Scaling groups. If there are not sufficient resources, the driver and executor pods go into pending state. The Cluster Autoscaler detects pods in pending state and scales worker nodes within the identified Auto Scaling group in the cluster using EC2 Auto Scaling.
  • The scaling for On-Demand and Spot nodes is exclusive of one another. So, if multiple applications are launched the driver and executor pods can be scheduled in different node groups independently per the resource requirements. This helps reduce job failures due to lack of resources for the driver, thus adding to the overall resiliency of the system.
  • Using EKS Managed node groups
    • This requires significantly less operational effort compared to using self-managed nodegroup and enables:
      • Auto enforcement of Spot best practices like Capacity Optimized allocation strategy, Capacity Rebalancing and use multiple instances types.
      • Proactive replacement of Spot nodes using rebalance notifications.
      • Managed draining of Spot nodes via re-balance recommendations.
    • The nodes are auto-labeled so that the pods can be scheduled with NodeAffinity.
      • eks.amazonaws.com/capacityType: SPOT
      • eks.amazonaws.com/capacityType: ON_DEMAND

Now that you understand the products and best practices of used in this tutorial, let’s get started.

Tutorial: running Spark in EKS managed node groups with Spot Instances

In this tutorial, I review steps, which help you launch cost optimized and resilient Spark jobs inside Kubernetes clusters running on EKS. I launch a word-count application counting the words from an Amazon Customer Review dataset and write the output to an Amazon S3 folder. To run the Spark workload on Kubernetes, make sure you have eksctl and kubectl installed on your computer or on an AWS Cloud9 environment. You can run this by using an AWS IAM user or role that has the AdministratorAccess policy attached to it, or check the minimum required permissions for using eksctl. The spot node groups in the Amazon EKS cluster can be launched both in a managed or a self-managed way, in this post I use the former. The config files for this tutorial can be found here. The job is finally launched in cluster mode.

Create Amazon S3 Access Policy

First, I must create an Amazon S3 access policy to allow the Spark application to read/write from Amazon S3. Amazon S3 Access is provisioned by attaching the policy by ARN to the node groups. This associates Amazon S3 access to the NodeInstanceRole and, hence, the node groups then have access to Amazon S3. Download the Amazon S3 policy file from here and modify the <<output folder>> to an Amazon S3 bucket you created. Run the following to create the policy. Note the ARN.

aws iam create-policy --policy-name spark-s3-policy --policy-document file://spark-s3.json

Cluster and node groups deployment

Create an EKS cluster using the following command:

eksctl create cluster –name= sparkonk8 --node-private-networking  --without-nodegroup --asg-access –region=<<AWS Region>>

The cluster takes approximately 15 minutes to launch.

Create the nodegroup using the nodeGroup config file. Replace the <<Policy ARN>> string using the ARN string from the previous step.

eksctl create nodegroup -f managedNodeGroups.yml

Scheduling driver/executor pods

The driver and executor pods can be assigned to nodes using affinity. PodTemplates can be used to configure the detail, which is not supported by Spark launch configuration by default. This feature is available from Spark 3.0.0, requiredDuringScheduling node affinity is used to schedule the driver and executor jobs. Sample podTemplates have been uploaded here.

Launching a Spark application

Create a service account. The spark driver pod uses the service account to create and watch executor pods using Kubernetes API server.

kubectl create serviceaccount spark
kubectl create clusterrolebinding spark-role --clusterrole='edit'  --serviceaccount=default:spark --namespace=default

Download the Cluster Autoscaler and edit it to add the cluster-name. 

curl -LO https://raw.githubusercontent.com/kubernetes/autoscaler/master/cluster-autoscaler/cloudprovider/aws/examples/cluster-autoscaler-autodiscover.yaml

Install the Cluster AutoScaler using the following command:

kubectl apply -f cluster-autoscaler-autodiscover.yaml

Get the details of Kubernetes master to get the head URL.

kubectl cluster-info 

command output

Use the following instructions to build the docker image.

Download the application file (script.py) from here and upload into the Amazon S3 bucket created.

Download the pod template files from here. Submit the application.

bin/spark-submit \
--master k8s://<<MASTER URL>> \
--deploy-mode cluster \
--name 'Job Name' \
--conf spark.eventLog.dir=s3a:// <<S3 BUCKET>>/logs \
--conf spark.eventLog.enabled=true \
--conf spark.history.fs.inProgressOptimization.enabled=true \
--conf spark.history.fs.update.interval=5s \
--conf spark.kubernetes.container.image=<<ECR Spark Docker Image>> \
--conf spark.kubernetes.container.image.pullPolicy=IfNotPresent \
--conf spark.kubernetes.driver.podTemplateFile='../driver_pod_template.yml' \
--conf spark.kubernetes.executor.podTemplateFile='../executor_pod_template.yml' \
--conf spark.kubernetes.authenticate.driver.serviceAccountName=spark \
--conf spark.dynamicAllocation.enabled=true \
--conf spark.dynamicAllocation.shuffleTracking.enabled=true \
--conf spark.dynamicAllocation.maxExecutors=100 \
--conf spark.dynamicAllocation.executorAllocationRatio=0.33 \
--conf spark.dynamicAllocation.sustainedSchedulerBacklogTimeout=30 \
--conf spark.dynamicAllocation.executorIdleTimeout=60s \
--conf spark.driver.memory=8g \
--conf spark.kubernetes.driver.request.cores=2 \
--conf spark.kubernetes.driver.limit.cores=4 \
--conf spark.executor.memory=8g \
--conf spark.kubernetes.executor.request.cores=2 \
--conf spark.kubernetes.executor.limit.cores=4 \
--conf spark.hadoop.fs.s3a.impl=org.apache.hadoop.fs.s3a.S3AFileSystem \
--conf spark.hadoop.fs.s3a.connection.ssl.enabled=false \
--conf spark.hadoop.fs.s3a.fast.upload=true \
s3a://<<S3 BUCKET>>/script.py \
s3a://<<S3 BUCKET>>/output 

A couple of key points to note here

  • podTemplateFile is used here, which enables scheduling of the driver pods to On-Demand Instances and executor pods to Spot Instances.
  • Spark provides a mechanism to allocate dynamically resources dynamically based on workloads. In the latest release of Spark (3.0.0), dynamicAllocation can be used with Kubernetes cluster manager. The executors that do not store, active, shuffled files can be removed to free up the resources. DynamicAllocation works well in tandem with Cluster Autoscaler for resource allocation and optimizes resource for jobs. We are using dynamicAllocation here to enable optimized resource sharing.
  • The application file and output are both in Amazon S3.

Output Files in S3

  • Spark Event logs are redirected to Amazon S3. Spark on Kubernetes creates local temporary files for logs and removes them once the application completes. The logs are redirected to Amazon S3 and Spark History Server can be used to analyze the logs. Note, you can create more instrumentation using tools like Prometheus and Grafana to monitor and manage the cluster.

Spark History Server + Dynamic Allocation

Observations

EC2 Spot Interruptions

The following diagram and log screenshot details from Spark History server showcases the behavior of a Spark application in case of an EC2 Spot interruption.

Four Spark applications launched in parallel in a cluster and one of the Spot nodes was interrupted. A couple of executor pods were terminated shut down in three of the four applications, but due to the resilient nature of Spark new executors were launched and the applications finished almost around the same time.
The Spark Driver identified the shut down executors, which handled the shuffle files and relaunched the tasks running on those executors.
Spark jobs

The Spark Driver identified the shut down executors, which handled the shuffle files and relaunched the tasks running on those executors.

Dynamic Allocation

Dynamic Allocation works with the caveat that it is an experimental feature.

dynamic allocation

Cost Optimization

Cost Optimization is achieved in several different ways from this tutorial.

  • Use of 100% Spot Instances for the Spark executors
  • Use of dynamicAllocation along with cluster autoscaler does make optimized use of resources and hence save cost
  • With the deployment of one driver and executor nodes to begin with and then scaling up on demand reduces the waste of a continuously running cluster

Cluster Autoscaling

Cluster Autoscaling is triggered as it is designed when there are pending (Spark executor) pods.

The Cluster Autoscaler logs can be fetched by:

kubectl logs -f deployment/cluster-autoscaler -n kube-system —tail=10  

Cluster Autoscaler Logs 

Cleanup

If you are trying out the tutorial, run the following steps to make sure that you don’t encounter unwanted costs.

Delete the EKS cluster and the nodegroups with the following command:

eksctl delete cluster --name sparkonk8

Delete the Amazon S3 Access Policy with the following command:

aws iam delete-policy --policy-arn <<POLICY ARN>>

Delete the Amazon S3 Output Bucket with the following command:

aws s3 rb --force s3://<<S3_BUCKET>>

Conclusion

In this blog, I demonstrated how you can run Spark workloads on a Kubernetes Cluster using Spot Instances, achieving scalability, resilience, and cost optimization. To cost optimize your Spark based big data workloads, consider running spark application using Kubernetes and EC2 Spot Instances.


How to monitor Windows and Linux servers and get internal performance metrics

Post Syndicated from Emma White original https://aws.amazon.com/blogs/compute/how-to-monitor-windows-and-linux-servers-and-get-internal-performance-metrics/

This post was written by Dean Suzuki, Senior Solutions Architect.

Customers who run Windows or Linux instances on AWS frequently ask, “How do I know if my disks are almost full?” or “How do I know if my application is using all the available memory and is paging to disk?” This blog helps answer these questions by walking you through how to set up monitoring to capture these internal performance metrics.

Solution overview

If you open the Amazon EC2 console, select a running Amazon EC2 instance, and select the Monitoring tab  you can see Amazon CloudWatch metrics for that instance. Amazon CloudWatch is an AWS monitoring service. The Monitoring tab (shown in the following image) shows the metrics that can be measured external to the instance (for example, CPU utilization, network bytes in/out). However, to understand what percentage of the disk is being used or what percentage of the memory is being used, these metrics require an internal operating system view of the instance. AWS places an extra safeguard on gathering data inside a customer’s instance so this capability is not enabled by default.

EC2 console showing Monitoring tab

To capture the server’s internal performance metrics, a CloudWatch agent must be installed on the instance. For Windows, the CloudWatch agent can capture any of the Windows performance monitor counters. For Linux, the CloudWatch agent can capture system-level metrics. For more details, please see Metrics Collected by the CloudWatch Agent. The agent can also capture logs from the server. The agent then sends this information to Amazon CloudWatch, where rules can be created to alert on certain conditions (for example, low free disk space) and automated responses can be set up (for example, perform backup to clear transaction logs). Also, dashboards can be created to view the health of your Windows servers.

There are four steps to implement internal monitoring:

  1. Install the CloudWatch agent onto your servers. AWS provides a service called AWS Systems Manager Run Command, which enables you to do this agent installation across all your servers.
  2. Run the CloudWatch agent configuration wizard, which captures what you want to monitor. These items could be performance counters and logs on the server. This configuration is then stored in AWS System Manager Parameter Store
  3. Configure CloudWatch agents to use agent configuration stored in Parameter Store using the Run Command.
  4. Validate that the CloudWatch agents are sending their monitoring data to CloudWatch.

The following image shows the flow of these four steps.

Process to install and configure the CloudWatch agent

In this blog, I walk through these steps so that you can follow along. Note that you are responsible for the cost of running the environment outlined in this blog. So, once you are finished with the steps in the blog, I recommend deleting the resources if you no longer need them. For the cost of running these servers, see Amazon EC2 On-Demand Pricing. For CloudWatch pricing, see Amazon CloudWatch pricing.

If you want a video overview of this process, please see this Monitoring Amazon EC2 Windows Instances using Unified CloudWatch Agent video.

Deploy the CloudWatch agent

The first step is to deploy the Amazon CloudWatch agent. There are multiple ways to deploy the CloudWatch agent (see this documentation on Installing the CloudWatch Agent). In this blog, I walk through how to use the AWS Systems Manager Run Command to deploy the agent. AWS Systems Manager uses the Systems Manager agent, which is installed by default on each AWS instance. This AWS Systems Manager agent must be given the appropriate permissions to connect to AWS Systems Manager, and to write the configuration data to the AWS Systems Manager Parameter Store. These access rights are controlled through the use of IAM roles.

Create two IAM roles

IAM roles are identity objects that you attach IAM policies. IAM policies define what access is allowed to AWS services. You can have users, services, or applications assume the IAM roles and get the assigned rights defined in the permissions policies.

To use System Manager, you typically create two IAM roles. The first role has permissions to write the CloudWatch agent configuration information to System Manager Parameter Store. This role is called CloudWatchAgentAdminRole.

The second role only has permissions to read the CloudWatch agent configuration from the System Manager Parameter Store. This role is called CloudWatchAgentServerRole.

For more details on creating these roles, please see the documentation on Create IAM Roles and Users for Use with the CloudWatch Agent.

Attach the IAM roles to the EC2 instances

Once you create the roles, you attach them to your Amazon EC2 instances. By attaching the IAM roles to the EC2 instances, you provide the processes running on the EC2 instance the permissions defined in the IAM role. In this blog, you create two Amazon EC2 instances. Attach the CloudWatchAgentAdminRole to the first instance that is used to create the CloudWatch agent configuration. Attach CloudWatchAgentServerRole to the second instance and any other instances that you want to monitor. For details on how to attach or assign roles to EC2 instances, please see the documentation on How do I assign an existing IAM role to an EC2 instance?.

Install the CloudWatch agent

Now that you have setup the permissions, you can install the CloudWatch agent onto the servers that you want to monitor. For details on installing the CloudWatch agent using Systems Manager, please see the documentation on Download and Configure the CloudWatch Agent.

Create the CloudWatch agent configuration

Now that you installed the CloudWatch agent on your server, run the CloudAgent configuration wizard to create the agent configuration. For instructions on how to run the CloudWatch Agent configuration wizard, please see this documentation on Create the CloudWatch Agent Configuration File with the Wizard. To establish a command shell on the server, you can use AWS Systems Manager Session Manager to establish a session to the server and then run the CloudWatch agent configuration wizard. If you want to monitor both Linux and Windows servers, you must run the CloudWatch agent configuration on a Linux instance and on a Windows instance to create a configuration file per OS type. The configuration is unique to the OS type.

To run the Agent configuration wizard on Linux instances, run the following command:

sudo /opt/aws/amazon-cloudwatch-agent/bin/amazon-cloudwatch-agent-config-wizard

To run the Agent configuration wizard on Windows instances, run the following commands:

cd "C:\Program Files\Amazon\AmazonCloudWatchAgent"

amazon-cloudwatch-agent-config-wizard.exe

Note for Linux instances: do not select to collect the collectd metrics in the agent configuration wizard unless you have collectd installed on your Linux servers. Otherwise, you may encounter an error.

Review the Agent configuration

The CloudWatch agent configuration generated from the wizard is stored in Systems Manager Parameter Store. You can review and modify this configuration if you need to capture extra metrics. To review the agent configuration, perform the following steps:

  1. Go to the console for the System Manager service.
  2. Click Parameter store on the left hand navigation.
  3. You should see the parameter that was created by the CloudWatch agent configuration program. For Linux servers, the configuration is stored in: AmazonCloudWatch-linux and for Windows servers, the configuration is stored in:  AmazonCloudWatch-windows.

System Manager Parameter Store: Parameters created by CloudWatch agent configuration wizard

  1. Click on the parameter’s hyperlink (for example, AmazonCloudWatch-linux) to see all the configuration parameters that you specified in the configuration program.

In the following steps, I walk through an example of modifying the Windows configuration parameter (AmazonCloudWatch-windows) to add an additional metric (“Available Mbytes”) to monitor.

  1. Click the AmazonCloudWatch-windows
  2. In the parameter overview, scroll down to the “metrics” section and under “metrics_collected”, you can see the Windows performance monitor counters that will be gathered by the CloudWatch agent. If you want to add an additional perfmon counter, then you can edit and add the counter here.
  3. Press Edit at the top right of the AmazonCloudWatch-windows Parameter Store page.
  4. Scroll down in the Value section and look for “Memory.”
  5. After the “% Committed Bytes In Use”, put a comma “,” and then press Enter to add a blank line. Then, put on that line “Available Mbytes” The following screenshot demonstrates what this configuration should look like.

AmazonCloudWatch-windows parameter contents and how to add a new metric to monitor

  1. Press Save Changes.

To modify the Linux configuration parameter (AmazonCloudWatch-linux), you perform similar steps except you click on the AmazonCloudWatch-linux parameter. Here is additional documentation on creating the CloudWatch agent configuration and modifying the configuration file.

Start the CloudWatch agent and use the configuration

In this step, start the CloudWatch agent and instruct it to use your agent configuration stored in System Manager Parameter Store.

  1. Open another tab in your web browser and go to System Manager console.
  2. Specify Run Command in the left hand navigation of the System Manager console.
  3. Press Run Command
  4. In the search bar,
    • Select Document name prefix
    • Select Equal
    • Specify AmazonCloudWatch (Note the field is case sensitive)
    • Press enter

System Manager Run Command's command document entry field

  1. Select AmazonCloudWatch-ManageAgent. This is the command that configures the CloudWatch agent.
  2. In the command parameters section,
    • For Action, select Configure
    • For Mode, select ec2
    • For Optional Configuration Source, select ssm
    • For optional configuration location, specify the Parameter Store name. For Windows instances, you would specify AmazonCloudWatch-windows for Windows instances or AmazonCloudWatch-linux for Linux instances. Note the field is case sensitive. This tells the command to read the Parameter Store for the parameter specified here.
    • For optional restart, leave yes
  3. For Targets, choose your target servers that you wish to monitor.
  4. Scroll down and press Run. The Run Command may take a couple minutes to complete. Press the refresh button. The Run Command configures the CloudWatch agent by reading the Parameter Store for the configuration and configure the agent using those settings.

For more details on installing the CloudWatch agent using your agent configuration, please see this Installing the CloudWatch Agent on EC2 Instances Using Your Agent Configuration.

Review the data collected by the CloudWatch agents

In this step, I walk through how to review the data collected by the CloudWatch agents.

  1. In the AWS Management console, go to CloudWatch.
  2. Click Metrics on the left-hand navigation.
  3. You should see a custom namespace for CWAgent. Click on the CWAgent Please note that this might take a couple minutes to appear. Refresh the page periodically until it appears.
  4. Then click the ImageId, Instanceid hyperlinks to see the counters under that section.

CloudWatch Metrics: Showing counters under CWAgent

  1. Review the metrics captured by the CloudWatch agent. Notice the metrics that are only observable from inside the instance (for example, LogicalDisk % Free Space). These types of metrics would not be observable without installing the CloudWatch agent on the instance. From these metrics, you could create a CloudWatch Alarm to alert you if they go beyond a certain threshold. You can also add them to a CloudWatch Dashboard to review. To learn more about the metrics collected by the CloudWatch agent, see the documentation Metrics Collected by the CloudWatch Agent.

Conclusion

In this blog, you learned how to deploy and configure the CloudWatch agent to capture the metrics on either Linux or Windows instances. If you are done with this blog, we recommend deleting the System Manager Parameter Store entry, the CloudWatch data and  then the EC2 instances to avoid further charges. If you would like a video tutorial of this process, please see this Monitoring Amazon EC2 Windows Instances using Unified CloudWatch Agent video.


Field Notes: Improving Call Center Experiences with Iterative Bot Training Using Amazon Connect and Amazon Lex

Post Syndicated from Marius Cealera original https://aws.amazon.com/blogs/architecture/field-notes-improving-call-center-experiences-with-iterative-bot-training-using-amazon-connect-and-amazon-lex/

This post was co-written by Abdullah Sahin, senior technology architect at Accenture, and Muhammad Qasim, software engineer at Accenture. 

Organizations deploying call-center chat bots are interested in evolving their solutions continuously, in response to changing customer demands. When developing a smart chat bot, some requests can be predicted (for example following a new product launch or a new marketing campaign). There are however instances where this is not possible (following market shifts, natural disasters, etc.)

While voice and chat bots are becoming more and more ubiquitous, keeping the bots up-to-date with the ever-changing demands remains a challenge.  It is clear that a build>deploy>forget approach quickly leads to outdated AI that lacks the ability to adapt to dynamic customer requirements.

Call-center solutions which create ongoing feedback mechanisms between incoming calls or chat messages and the chatbot’s AI, allow for a programmatic approach to predicting and catering to a customer’s intent.

This is achieved by doing the following:

  • applying natural language processing (NLP) on conversation data
  • extracting relevant missed intents,
  • automating the bot update process
  • inserting human feedback at key stages in the process.

This post provides a technical overview of one of Accenture’s Advanced Customer Engagement (ACE+) solutions, explaining how it integrates multiple AWS services to continuously and quickly improve chatbots and stay ahead of customer demands.

Call center solution architects and administrators can use this architecture as a starting point for an iterative bot improvement solution. The goal is to lead to an increase in call deflection and drive better customer experiences.

Overview of Solution

The goal of the solution is to extract missed intents and utterances from a conversation and present them to the call center agent at the end of a conversation, as part of the after-work flow. A simple UI interface was designed for the agent to select the most relevant missed phrases and forward them to an Analytics/Operations Team for final approval.

Figure 1 – Architecture Diagram

Amazon Connect serves as the contact center platform and handles incoming calls, manages the IVR flows and the escalations to the human agent. Amazon Connect is also used to gather call metadata, call analytics and handle call center user management. It is the platform from which other AWS services are called: Amazon Lex, Amazon DynamoDB and AWS Lambda.

Lex is the AI service used to build the bot. Lambda serves as the main integration tool and is used to push bot transcripts to DynamoDB, deploy updates to Lex and to populate the agent dashboard which is used to flag relevant intents missed by the bot. A generic CRM app is used to integrate the agent client and provide a single, integrated, dashboard. For example, this addition to the agent’s UI, used to review intents, could be implemented as a custom page in Salesforce (Figure 2).

Figure 2 – Agent feedback dashboard in Salesforce. The section allows the agent to select parts of the conversation that should be captured as intents by the bot.

A separate, stand-alone, dashboard is used by an Analytics and Operations Team to approve the new intents, which triggers the bot update process.

Walkthrough

The typical use case for this solution (Figure 4) shows how missing intents in the bot configuration are captured from customer conversations. These intents are then validated and used to automatically build and deploy an updated version of a chatbot. During the process, the following steps are performed:

  1. Customer intents that were missed by the chatbot are automatically highlighted in the conversation
  2. The agent performs a review of the transcript and selects the missed intents that are relevant.
  3. The selected intents are sent to an Analytics/Ops Team for final approval.
  4. The operations team validates the new intents and starts the chatbot rebuild process.

Figure 3 – Use case: the bot is unable to resolve the first call (bottom flow). Post-call analysis results in a new version of the bot being built and deployed. The new bot is able to handle the issue in subsequent calls (top flow)

During the first call (bottom flow) the bot fails to fulfil the request and the customer is escalated to a Live Agent. The agent resolves the query and, post call, analyzes the transcript between the chatbot and the customer, identifies conversation parts that the chatbot should have understood and sends a ‘missed intent/utterance’ report to the Analytics/Ops Team. The team approves and triggers the process that updates the bot.

For the second call, the customer asks the same question. This time, the (trained) bot is able to answer the query and end the conversation.

Ideally, the post-call analysis should be performed, at least in part, by the agent handling the call. Involving the agent in the process is critical for delivering quality results. Any given conversation can have multiple missed intents, some of them irrelevant when looking to generalize a customer’s question.

A call center agent is in the best position to judge what is or is not useful and mark the missed intents to be used for bot training. This is the important logical triage step. Of course, this will result in the occasional increase in the average handling time (AHT). This should be seen as a time investment with the potential to reduce future call times and increase deflection rates.

One alternative to this setup would be to have a dedicated analytics team review the conversations, offloading this work from the agent. This approach avoids the increase in AHT, but also introduces delay and, possibly, inaccuracies in the feedback loop.

The approval from the Analytics/Ops Team is a sign off on the agent’s work and trigger for the bot building process.

Prerequisites

The following section focuses on the sequence required to programmatically update intents in existing Lex bots. It assumes a Connect instance is configured and a Lex bot is already integrated with it. Navigate to this page for more information on adding Lex to your Connect flows.

It also does not cover the CRM application, where the conversation transcript is displayed and presented to the agent for intent selection.  The implementation details can vary significantly depending on the CRM solution used. Conceptually, most solutions will follow the architecture presented in Figure1: store the conversation data in a database (DynamoDB here) and expose it through an (API Gateway here) to be consumed by the CRM application.

Lex bot update sequence

The core logic for updating the bot is contained in a Lambda function that triggers the Lex update. This adds new utterances to an existing bot, builds it and then publishes a new version of the bot. The Lambda function is associated with an API Gateway endpoint which is called with the following body:

{
	“intent”: “INTENT_NAME”,
	“utterances”: [“UTTERANCE_TO_ADD_1”, “UTTERANCE_TO_ADD_2” …]
}

Steps to follow:

  1. The intent information is fetched from Lex using the getIntent API
  2. The existing utterances are combined with the new utterances and deduplicated.
  3. The intent information is updated with the new utterances
  4. The updated intent information is passed to the putIntent API to update the Lex Intent
  5. The bot information is fetched from Lex using the getBot API
  6. The intent version present within the bot information is updated with the new intent

Figure 4 – Representation of Lex Update Sequence


7. The update bot information is passed to the putBot API to update Lex and the processBehavior is set to “BUILD” to trigger a build. The following code snippet shows how this would be done in JavaScript:

const updateBot = await lexModel
    .putBot({
        ...bot,
        processBehavior: "BUILD"
    })
    .promise()

9. The last step is to publish the bot, for this we fetch the bot alias information and then call the putBotAlias API.

const oldBotAlias = await lexModel
    .getBotAlias({
        name: config.botAlias,
        botName: updatedBot.name
    })
    .promise()

return lexModel
    .putBotAlias({
        name: config.botAlias,
        botName: updatedBot.name,
        botVersion: updatedBot.version,
        checksum: oldBotAlias.checksum,
}) 

Conclusion

In this post, we showed how a programmatic bot improvement process can be implemented around Amazon Lex and Amazon Connect.  Continuously improving call center bots is a fundamental requirement for increased customer satisfaction. The feedback loop, agent validation and automated bot deployment pipeline should be considered integral parts to any a chatbot implementation.

Finally, the concept of a feedback-loop is not specific to call-center chatbots. The idea of adding an iterative improvement process in the bot lifecycle can also be applied in other areas where chatbots are used.

Accelerating Innovation with the Accenture AWS Business Group (AABG)

By working with the Accenture AWS Business Group (AABG), you can learn from the resources, technical expertise, and industry knowledge of two leading innovators, helping you accelerate the pace of innovation to deliver disruptive products and services. The AABG helps customers ideate and innovate cloud solutions with customers through rapid prototype development.

Connect with our team at [email protected] to learn and accelerate how to use machine learning in your products and services.


Field Notes provides hands-on technical guidance from AWS Solutions Architects, consultants, and technical account managers, based on their experiences in the field solving real-world business problems for customers.


Abdullah Sahin

Abdullah Sahin

Abdullah Sahin is a senior technology architect at Accenture. He is leading a rapid prototyping team bringing the power of innovation on AWS to Accenture customers. He is a fan of CI/CD, containerization technologies and IoT.

Muhammad Qasim

Muhammad Qasin

Muhammad Qasim is a software engineer at Accenture and excels in development of voice bots using services such as Amazon Connect. In his spare time, he plays badminton and loves to go for a run.

Resource leak detection in Amazon CodeGuru Reviewer

Post Syndicated from Pranav Garg original https://aws.amazon.com/blogs/devops/resource-leak-detection-in-amazon-codeguru/

This post discusses the resource leak detector for Java in Amazon CodeGuru Reviewer. CodeGuru Reviewer automatically analyzes pull requests (created in supported repositories such as AWS CodeCommit, GitHub, GitHub Enterprise, and Bitbucket) and generates recommendations for improving code quality. For more information, see Automating code reviews and application profiling with Amazon CodeGuru. This blog does not describe the resource leak detector for Python programs that is now available in preview.

What are resource leaks?

Resources are objects with a limited availability within a computing system. These typically include objects managed by the operating system, such as file handles, database connections, and network sockets. Because the number of such resources in a system is limited, they must be released by an application as soon as they are used. Otherwise, you will run out of resources and you won’t be able to allocate new ones. The paradigm of acquiring a resource and releasing it is also followed by other categories of objects such as metric wrappers and timers.

Resource leaks are bugs that arise when a program doesn’t release the resources it has acquired. Resource leaks can lead to resource exhaustion. In the worst case, they can cause the system to slow down or even crash.

Starting with Java 7, most classes holding resources implement the java.lang.AutoCloseable interface and provide a close() method to release them. However, a close() call in source code doesn’t guarantee that the resource is released along all program execution paths. For example, in the following sample code, resource r is acquired by calling its constructor and is closed along the path corresponding to the if branch, shown using green arrows. To ensure that the acquired resource doesn’t leak, you must also close r along the path corresponding to the else branch (the path shown using red arrows).

A resource must be closed along all execution paths to prevent resource leaks

Often, resource leaks manifest themselves along code paths that aren’t frequently run, or under a heavy system load, or after the system has been running for a long time. As a result, such leaks are latent and can remain dormant in source code for long periods of time before manifesting themselves in production environments. This is the primary reason why resource leak bugs are difficult to detect or replicate during testing, and why automatically detecting these bugs during pull requests and code scans is important.

Detecting resource leaks in CodeGuru Reviewer

For this post, we consider the following Java code snippet. In this code, method getConnection() attempts to create a connection in the connection pool associated with a data source. Typically, a connection pool limits the maximum number of connections that can remain open at any given time. As a result, you must close connections after their use so as to not exhaust this limit.

 1     private Connection getConnection(final BasicDataSource dataSource, ...)
               throws ValidateConnectionException, SQLException {
 2         boolean connectionAcquired = false;
 3         // Retrying three times to get the connection.
 4         for (int attempt = 0; attempt < CONNECTION_RETRIES; ++attempt) {
 5             Connection connection = dataSource.getConnection();
 6             // validateConnection may throw ValidateConnectionException
 7             if (! validateConnection(connection, ...)) {
 8                 // connection is invalid
 9                 DbUtils.closeQuietly(connection);
10             } else {
11                 // connection is established
12                 connectionAcquired = true;
13                 return connection;
14             }
15         }
16         return null;
17     }

At first glance, it seems that the method getConnection() doesn’t leak connection resources. If a valid connection is established in the connection pool (else branch on line 10 is taken), the method getConnection() returns it to the client for use (line 13). If the connection established is invalid (if branch on line 7 is taken), it’s closed in line 9 before another attempt is made to establish a connection.

However, method validateConnection() at line 7 can throw a ValidateConnectionException. If this exception is thrown after a connection is established at line 5, the connection is neither closed in this method nor is it returned upstream to the client to be closed later. Furthermore, if this exceptional code path runs frequently, for instance, if the validation logic throws on a specific recurring service request, each new request causes a connection to leak in the connection pool. Eventually, the client can’t acquire new connections to the data source, impacting the availability of the service.

A typical recommendation to prevent resource leak bugs is to declare the resource objects in a try-with-resources statement block. However, we can’t use try-with-resources to fix the preceding method because this method is required to return an open connection for use in the upstream client. The CodeGuru Reviewer recommendation for the preceding code snippet is as follows:

“Consider closing the following resource: connection. The resource is referenced at line 7. The resource is closed at line 9. The resource is returned at line 13. There are other execution paths that don’t close the resource or return it, for example, when validateConnection throws an exception. To prevent this resource leak, close connection along these other paths before you exit this method.”

As mentioned in the Reviewer recommendation, to prevent this resource leak, you must close the established connection when method validateConnection() throws an exception. This can be achieved by inserting the validation logic (lines 7–14) in a try block. In the finally block associated with this try, the connection must be closed by calling DbUtils.closeQuietly(connection) if connectionAcquired == false. The method getConnection() after this fix has been applied is as follows:

private Connection getConnection(final BasicDataSource dataSource, ...) 
        throws ValidateConnectionException, SQLException {
    boolean connectionAcquired = false;
    // Retrying three times to get the connection.
    for (int attempt = 0; attempt < CONNECTION_RETRIES; ++attempt) {
        Connection connection = dataSource.getConnection();
        try {
            // validateConnection may throw ValidateConnectionException
            if (! validateConnection(connection, ...)) {
                // connection is invalid
                DbUtils.closeQuietly(connection);
            } else {
                // connection is established
                connectionAcquired = true;
                return connection;
            }
        } finally {
            if (!connectionAcquired) {
                DBUtils.closeQuietly(connection);
            }
        }
    }
    return null;
}

As shown in this example, resource leaks in production services can be very disruptive. Furthermore, leaks that manifest along exceptional or less frequently run code paths can be hard to detect or replicate during testing and can remain dormant in the code for long periods of time before manifesting themselves in production environments. With the resource leak detector, you can detect such leaks on objects belonging to a large number of popular Java types such as file streams, database connections, network sockets, timers and metrics, etc.

Combining static code analysis with machine learning for accurate resource leak detection

In this section, we dive deep into the inner workings of the resource leak detector. The resource leak detector in CodeGuru Reviewer uses static analysis algorithms and techniques. Static analysis algorithms perform code analysis without running the code. These algorithms are generally prone to high false positives (the tool might report correct code as having a bug). If the number of these false positives is high, it can lead to alarm fatigue and low adoption of the tool. As a result, the resource leak detector in CodeGuru Reviewer prioritizes precision over recall— the findings we surface are resource leaks with a high accuracy, though CodeGuru Reviewer could potentially miss some resource leak findings.

The main reason for false positives in static code analysis is incomplete information available to the analysis. CodeGuru Reviewer requires only the Java source files and doesn’t require all dependencies or the build artifacts. Not requiring the external dependencies or the build artifacts reduces the friction to perform automated code reviews. As a result, static analysis only has access to the code in the source repository and doesn’t have access to its external dependencies. The resource leak detector in CodeGuru Reviewer combines static code analysis with a machine learning (ML) model. This ML model is used to reason about external dependencies to provide accurate recommendations.

To understand the use of the ML model, consider again the code above for method getConnection() that had a resource leak. In the code snippet, a connection to the data source is established by calling BasicDataSource.getConnection() method, declared in the Apache Commons library. As mentioned earlier, we don’t require the source code of external dependencies like the Apache library for code analysis during pull requests. Without access to the code of external dependencies, a pure static analysis-driven technique doesn’t know whether the Connection object obtained at line 5 will leak, if not closed. Similarly, it doesn’t know that DbUtils.closeQuietly() is a library function that closes the connection argument passed to it at line 9. Our detector combines static code analysis with ML that learns patterns over such external function calls from a large number of available code repositories. As a result, our resource leak detector knows that the connection doesn’t leak along the following code path:

  • A connection is established on line 5
  • Method validateConnection() returns false at line 7
  • DbUtils.closeQuietly() is called on line 9

This suppresses the possible false warning. At the same time, the detector knows that there is a resource leak when the connection is established at line 5, and validateConnection() throws an exception at line 7 that isn’t caught.

When we run CodeGuru Reviewer on this code snippet, it surfaces only the second leak scenario and makes an appropriate recommendation to fix this bug.

The ML model used in the resource leak detector has been trained on a large number of internal Amazon and GitHub code repositories.

Responses to the resource leak findings

Although closing an open resource in code isn’t difficult, doing so properly along all program paths is important to prevent resource leaks. This can easily be overlooked, especially along exceptional or less frequently run paths. As a result, the resource leak detector in CodeGuru Reviewer has observed a relatively high frequency, and has alerted developers within Amazon to thousands of resource leaks before they hit production.

The resource leak detections have witnessed a high developer acceptance rate, and developer feedback towards the resource leak detector has been very positive. Some of the feedback from developers includes “Very cool, automated finding,” “Good bot :),” and “Oh man, this is cool.” Developers have also concurred that the findings are important and need to be fixed.

Conclusion

Resource leak bugs are difficult to detect or replicate during testing. They can impact the availability of production services. As a result, it’s important to automatically detect these bugs early on in the software development workflow, such as during pull requests or code scans. The resource leak detector in CodeGuru Reviewer combines static code analysis algorithms with ML to surface only the high confidence leaks. It has a high developer acceptance rate and has alerted developers within Amazon to thousands of leaks before those leaks hit production.

Field Notes: Comparing Algorithm Performance Using MLOps and the AWS Cloud Development Kit

Post Syndicated from Moataz Gaber original https://aws.amazon.com/blogs/architecture/field-notes-comparing-algorithm-performance-using-mlops-and-the-aws-cloud-development-kit/

Comparing machine learning algorithm performance is fundamental for machine learning practitioners, and data scientists. The goal is to evaluate the appropriate algorithm to implement for a known business problem.

Machine learning performance is often correlated to the usefulness of the model deployed. Improving the performance of the model typically results in an increased accuracy of the prediction. Model accuracy is a key performance indicator (KPI) for businesses when evaluating production readiness and identifying the appropriate algorithm to select earlier in model development. Organizations benefit from reduced project expenses, accelerated project timelines and improved customer experience. Nevertheless, some organizations have not introduced a model comparison process into their workflow which negatively impacts cost and productivity.

In this blog post, I describe how you can compare machine learning algorithms using Machine Learning Operations (MLOps). You will learn how to create an MLOps pipeline for comparing machine learning algorithms performance using AWS Step Functions, AWS Cloud Development Kit (CDK) and Amazon SageMaker.

First, I explain the use case that will be addressed through this post. Then, I explain the design considerations for the solution. Finally, I provide access to a GitHub repository which includes all the necessary steps for you to replicate the solution I have described, in your own AWS account.

Understanding the Use Case

Machine learning has many potential uses and quite often the same use case is being addressed by different machine learning algorithms. Let’s take Amazon Sagemaker built-in algorithms. As an example, if you are having a “Regression” use case, it can be addressed using (Linear Learner, XGBoost and KNN) algorithms. Another example for a “Classification” use case you can use algorithm such as (XGBoost, KNN, Factorization Machines and Linear Learner). Similarly for “Anomaly Detection” there are (Random Cut Forests and IP Insights).

In this post, it is a “Regression” use case to identify the age of the abalone which can be calculated based on the number of rings on its shell (age equals to number of rings plus 1.5). Usually the number of rings are counted through microscopes examinations.

I use the abalone dataset in libsvm format which contains 9 fields [‘Rings’, ‘Sex’, ‘Length’,’ Diameter’, ‘Height’,’ Whole Weight’,’ Shucked Weight’,’ Viscera Weight’ and ‘Shell Weight’] respectively.

The features starting from Sex to Shell Weight are physical measurements that can be measured using the correct tools. Therefore, using the machine learning algorithms (Linear Learner and XGBoost) to address this use case, the complexity of having to examine the abalone under microscopes to understand its age can be improved.

Benefits of the AWS Cloud Development Kit (AWS CDK)

The AWS Cloud Development Kit (AWS CDK) is an open source software development framework to define your cloud application resources.

The AWS CDK uses the jsii which is an interface developed by AWS that allows code in any language to naturally interact with JavaScript classes. It is the technology that enables the AWS Cloud Development Kit to deliver polyglot libraries from a single codebase.

This means that you can use the CDK and define your cloud application resources in typescript language for example. Then by compiling your source module using jsii, you can package it as modules in one of the supported target languages (e.g: Javascript, python, Java and .Net). So if your developers or customers prefer any of those languages, you can easily package and export the code to their preferred choice.

Also, the cdk tf provides constructs for defining Terraform HCL state files and the cdk8s enables you to use constructs for defining kubernetes configuration in TypeScript, Python, and Java. So by using the CDK you have a faster development process and easier cloud onboarding. It makes your cloud resources more flexible for sharing.

Prerequisites

Overview of solution

This architecture serves as an example of how you can build a MLOps pipeline that orchestrates the comparison of results between the predictions of two algorithms.

The solution uses a completely serverless environment so you don’t have to worry about managing the infrastructure. It also deletes resources not needed after collecting the predictions results, so as not to incur any additional costs.

Figure 1: Solution Architecture

Walkthrough

In the preceding diagram, the serverless MLOps pipeline is deployed using AWS Step Functions workflow. The architecture contains the following steps:

  1. The dataset is uploaded to the Amazon S3 cloud storage under the /Inputs directory (prefix).
  2. The uploaded file triggers AWS Lambda using an Amazon S3 notification event.
  3. The Lambda function then will initiate the MLOps pipeline built using a Step Functions state machine.
  4. The starting lambda will start by collecting the region corresponding training images URIs for both Linear Learner and XGBoost algorithms. These are used in training both algorithms over the dataset. It will also get the Amazon SageMaker Spark Container Image which is used for running the SageMaker processing Job.
  5. The dataset is in libsvm format which is accepted by the XGBoost algorithm as per the Input/Output Interface for the XGBoost Algorithm. However, this is not supported by the Linear Learner Algorithm as per Input/Output interface for the linear learner algorithm. So we need to run a processing job using Amazon SageMaker Data Processing with Apache Spark. The processing job will transform the data from libsvm to csv and will divide the dataset into train, validation and test datasets. The output of the processing job will be stored under /Xgboost and /Linear directories (prefixes).

Figure 2: Train, validation and test samples extracted from dataset

6. Then the workflow of Step Functions will perform the following steps in parallel:

    • Train both algorithms.
    • Create models out of trained algorithms.
    • Create endpoints configurations and deploy predictions endpoints for both models.
    • Invoke lambda function to describe the status of the deployed endpoints and wait until the endpoints become in “InService”.
    • Invoke lambda function to perform 3 live predictions using boto3 and the “test” samples taken from the dataset to calculate the average accuracy of each model.
    • Invoke lambda function to delete deployed endpoints not to incur any additional charges.

7. Finally, a Lambda function will be invoked to determine which model has better accuracy in predicting the values.

The following shows a diagram of the workflow of the Step Functions:

Figure 3: AWS Step Functions workflow graph

The code to provision this solution along with step by step instructions can be found at this GitHub repo.

Results and Next Steps

After waiting for the complete execution of step functions workflow, the results are depicted in the following diagram:

Figure 4: Comparison results

This doesn’t necessarily mean that the XGBoost algorithm will always be the better performing algorithm. It just means that the performance was the result of these factors:

  • the hyperparameters configured for each algorithm
  • the number of epochs performed
  • the amount of dataset samples used for training

To make sure that you are getting better results from the models, you can run hyperparameters tuning jobs which will run many training jobs on your dataset using the algorithms and ranges of hyperparameters that you specify. This helps you allocate which set of hyperparameters which are giving better results.

Finally, you can use this comparison to determine which algorithm is best suited for your production environment. Then you can configure your step functions workflow to update the configuration of the production endpoint with the better performing algorithm.

Figure 5: Update production endpoint workflow

Conclusion

This post showed you how to create a repeatable, automated pipeline to deliver the better performing algorithm to your production predictions endpoint. This helps increase the productivity and reduce the time of manual comparison.  You also learned to provision the solution using AWS CDK and to perform regular cleaning of deployed resources to drive down business costs. If this post helps you or inspires you to solve a problem, share your thoughts and questions in the comments. You can use and extend the code on the GitHub repo.

Field Notes provides hands-on technical guidance from AWS Solutions Architects, consultants, and technical account managers, based on their experiences in the field solving real-world business problems for customers

Deploying CIS Level 1 hardened AMIs with Amazon EC2 Image Builder

Post Syndicated from Joseph Keating original https://aws.amazon.com/blogs/devops/deploying-cis-level-1-hardened-amis-with-amazon-ec2-image-builder/

The NFL, an AWS Professional Services partner, is collaborating with NFL’s Player Health and Safety team to build the Digital Athlete Program. The Digital Athlete Program is working to drive progress in the prevention, diagnosis, and treatment of injuries; enhance medical protocols; and further improve the way football is taught and played. The NFL, in conjunction with AWS Professional Services, delivered an Amazon EC2 Image Builder pipeline for automating the production of Amazon Machine Images (AMIs). Following similar practices from the Digital Athlete Program, this post demonstrates how to deploy an automated Image Builder pipeline.

“AWS Professional Services faced unique environment constraints, but was able to deliver a modular pipeline solution leveraging EC2 Image Builder. The framework serves as a foundation to create hardened images for future use cases. The team also provided documentation and knowledge transfer sessions to ensure our team was set up to successfully manage the solution.”

—Joseph Steinke, Director, Data Solutions Architect, National Football League

A common scenario AWS customers face is how to build processes that configure secure AWS resources that can be leveraged throughout the organization. You need to move fast in the cloud without compromising security best practices. Amazon Elastic Compute Cloud (Amazon EC2) allows you to deploy virtual machines in the AWS Cloud. EC2 AMIs provide the configuration utilized to launch an EC2 instance. You can use AMIs for several use cases, such as configuring applications, applying security policies, and configuring development environments. Developers and system administrators can deploy configuration AMIs to bring up EC2 resources that require little-to-no setup. Often times, multiple patterns are adopted for building and deploying AMIs. Because of this, you need the ability to create a centralized, automated pattern that can output secure, customizable AMIs.

In this post, we demonstrate how to create an automated process that builds and deploys Center for Internet Security (CIS) Level 1 hardened AMIs. The pattern that we deploy includes Image Builder, a CIS Level 1 hardened AMI, an application running on EC2 instances, and Amazon Inspector for security analysis. You deploy the AMI configured with the Image Builder pipeline to an application stack. The application stack consists of EC2 instances running Nginx. Lastly, we show you how to re-hydrate your application stack with a new AMI utilizing AWS CloudFormation and Amazon EC2 launch templates. You use Amazon Inspector to scan the EC2 instances launched from the Image Builder-generated AMI against the CIS Level 1 Benchmark.

After going through this exercise, you should understand how to build, manage, and deploy AMIs to an application stack. The infrastructure deployed with this pipeline includes a basic web application, but you can use this pattern to fit many needs. After running through this post, you should feel comfortable using this pattern to configure an AMI pipeline for your organization.

The project we create in this post addresses the following use case: you need a process for building and deploying CIS Level 1 hardened AMIs to an application stack running on Amazon EC2. In addition to demonstrating how to deploy the AMI pipeline, we also illustrate how to refresh a running application stack with a new AMI. You learn how to deploy this configuration with the AWS Command Line Interface (AWS CLI) and AWS CloudFormation.

AWS services used
Image Builder allows you to develop an automated workflow for creating AMIs to fit your organization’s needs. You can streamline the creation and distribution of secure images, automate your patching process, and define security and application configuration into custom AWS AMIs. In this post, you use the following AWS services to implement this solution:

  • AWS CloudFormation – AWS CloudFormation allows you to use domain-specific languages or simple text files to model and provision, in an automated and secure manner, all the resources needed for your applications across all Regions and accounts. You can deploy AWS resources in a safe, repeatable manner, and automate the provisioning of infrastructure.
  • AWS KMSAmazon Key Management Service (AWS KMS) is a fully managed service for creating and managing cryptographic keys. These keys are natively integrated with most AWS services. You use a KMS key in this post to encrypt resources.
  • Amazon S3Amazon Simple Storage Service (Amazon S3) is an object storage service utilized for storing and encrypting data. We use Amazon S3 to store our configuration files.
  • AWS Auto ScalingAWS Auto Scaling allows you to build scaling plans that automate how groups of different resources respond to changes in demand. You can optimize availability, costs, or a balance of both. We use Auto Scaling to manage Nginx on Amazon EC2.
  • Launch templatesLaunch templates contain configurations such as AMI ID, instance type, and security group. Launch templates enable you to store launch parameters so that they don’t have to be specified every time instances are launched.
  • Amazon Inspector – This automated security assessment service improves the security and compliance of applications deployed on AWS. Amazon Inspector automatically assesses applications for exposures, vulnerabilities, and deviations from best practices.

Architecture overview
We use Ansible as a configuration management component alongside Image Builder. The CIS Ansible Playbook applies a Level 1 set of rules to the local host of which the AMI is provisioned on. For more information about the Ansible Playbook, see the GitHub repo. Image Builder offers AMIs with Security Technical Implementation Guides (STIG) levels low-high as part of its pipeline build.

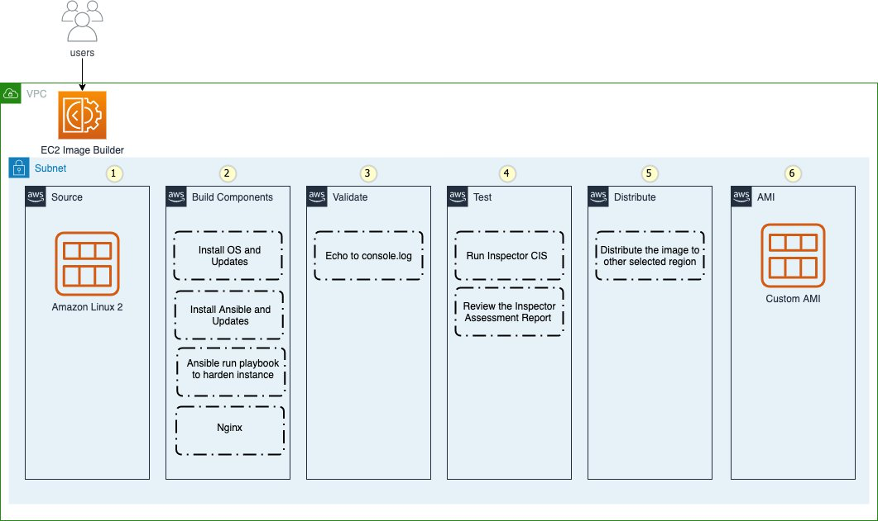
The following diagram depicts the phases of the Image Builder pipeline for building a Nginx web server. The numbers 1–6 represent the order of when each phase runs in the build process:

  1. Source
  2. Build components
  3. Validate
  4. Test
  5. Distribute
  6. AMI

Figure: Shows the EC2 Image Builder steps

The workflow includes the following steps:

  1. Deploy the CloudFormation templates.
  2. The template creates an Image Builder pipeline.
  3. AWS Systems Manager completes the AMI build process.
  4. Amazon EC2 starts an instance to build the AMI.
  5. Systems Manager starts a test instance build after the first build is successful.
  6. The AMI starts provisioning.
  7. The Amazon Inspector CIS benchmark starts.

CloudFormation templates
You deploy the following CloudFormation templates. These CloudFormation templates have a great deal of configurations. They deploy the following resources:

  • vpc.yml – Contains all the core networking configuration. It deploys the VPC, two private subnets, two public subnets, and the route tables. The private subnets utilize a NAT gateway to communicate to the internet. The public subnets have full outbound access to the IGW.
  • kms.yml – Contains the AWS KMS configuration that we use for encrypting resources. The KMS key policy is also configured in this template.
  • s3-iam-config.yml – Contains the launch configuration and autoscaling groups for the initial Nginx launch. For updates and patching to Nginx, we use Image Builder to build those changes.
  • infrastructure-ssm-params.yml – Contains the Systems Manager parameter store configuration. The parameters are populated by using outputs from other CloudFormation templates.
  • nginx-config.yml – Contains the configuration for Nginx. Additionally, this template contains the network load balancer, target groups, security groups, and EC2 instance AWS Identity and Access Management (IAM) roles.
  • nginx-image-builder.yml – Contains the configuration for the Image Builder pipeline that we use to build AMIs.

Prerequisites
To follow the steps to provision the pipeline deployment, you must have the following prerequisites:

Deploying the CloudFormation templates
To deploy your templates, complete the following steps:

1. Clone the source code repository found in the following location:

git clone https://github.com/aws-samples/deploy-cis-level-1-hardened-ami-with-ec2-image-builder-pipeline.git

You now use the AWS CLI to deploy the CloudFormation templates. Make sure to leave the CloudFormation template names as we have written in this post.

2. Deploy the VPC CloudFormation template:

aws cloudformation create-stack \
--stack-name vpc-config \
--template-body file://Templates/vpc.yml \
--parameters file://Parameters/vpc-params.json  \
--capabilities CAPABILITY_IAM \
--region us-east-1

The output should look like the following code:

{

    "StackId": "arn:aws:cloudformation:us-east-1:123456789012:stack/vpc-config/7faaab30-247f-11eb-8712-0e65b6fb18f9"
}


3. Open the Parameters/kms-params.json file and update the UserARN parameter with your account ID:

[
  {
      "ParameterKey": "KeyName",
      "ParameterValue": "DemoKey"
  },
  {
    "ParameterKey": "UserARN",
    "ParameterValue": "arn:aws:iam::<input_your_account_id>:root"
  }
]


4. Deploy the KMS key CloudFormation template:

aws cloudformation create-stack \
--stack-name kms-config \
--template-body file://Templates/kms.yml \
--parameters file://Parameters/kms-params.json \
--capabilities CAPABILITY_IAM \
--region us-east-1

The output should look like the following:

{
"StackId": "arn:aws:cloudformation:us-east-1:123456789012:stack/kms-config/f65aca80-08ff-11eb-8795-12275bc6e1ef"
}


5. Open the Parameters/s3-iam-config.json file and update the DemoConfigS3BucketName parameter to a unique name of your choosing:

[
  {
    "ParameterKey" : "Environment",
    "ParameterValue" : "dev"
  },
  {
    "ParameterKey": "NetworkStackName",
    "ParameterValue" : "vpc-config"
  },
  {
    "ParameterKey" : "KMSStackName",
    "ParameterValue" : "kms-config"
  },
  {
    "ParameterKey": "DemoConfigS3BucketName",
    "ParameterValue" : "<input_your_unique_bucket_name>"
  },
  {
    "ParameterKey" : "EC2InstanceRoleName",
    "ParameterValue" : "EC2InstanceRole"
  }
]


6. Deploy the IAM role configuration template:

aws cloudformation create-stack \
--stack-name s3-iam-config \
--template-body file://Templates/s3-iam-config.yml \
--parameters file://Parameters/s3-iam-config.json \
--capabilities CAPABILITY_NAMED_IAM \
--region us-east-1

The output should look like the following:

{
"StackId": "arn:aws:cloudformation:us-east-1:123456789012:stack/s3-iam-config/9be9f990-0909-11eb-811c-0a78092beb51"
}


Configuring IAM roles and policies

This solution uses a couple of service-linked roles. Let’s generate these roles using the AWS CLI.


1. Run the following commands:

aws iam create-service-linked-role --aws-service-name autoscaling.amazonaws.com
aws iam create-service-linked-role --aws-service-name imagebuilder.amazonaws.com

If you see a message similar to following code, it means that you already have the service-linked role created in your account and you can move on to the next step:

An error occurred (InvalidInput) when calling the CreateServiceLinkedRole operation: Service role name AWSServiceRoleForImageBuilder has been taken in this account, please try a different suffix.

Now that you have generated the IAM roles used in this post, you add them to the KMS key policy. This allows the roles to encrypt and decrypt the KMS key.


2. Open the Parameters/kms-params.json file:

[
  {
      "ParameterKey": "KeyName",
      "ParameterValue": "DemoKey"
  },
  {
    "ParameterKey": "UserARN",
    "ParameterValue": "arn:aws:iam::12345678910:root"
  }
]


3. Add the following values as a comma-separated list to the UserARN parameter key:

arn:aws:iam::<input_your_aws_account_id>:role/EC2InstanceRole
arn:aws:iam::<input_your_aws_account_id>:role/EC2ImageBuilderRole
arn:aws:iam::<input_your_aws_account_id>:role/NginxS3PutLambdaRole
arn:aws:iam::<input_your_aws_account_id>:role/aws-service-role/imagebuilder.amazonaws.com/AWSServiceRoleForImageBuilder
arn:aws:iam::<input_your_aws_account_id>:role/aws-service-role/autoscaling.amazonaws.com/AWSServiceRoleForAutoScaling


When finished, the file should look similar to the following:

[
  {
      "ParameterKey": "KeyName",
      "ParameterValue": "DemoKey"
  },
  {
    "ParameterKey": "UserARN",
    "ParameterValue": "arn:aws:iam::123456789012:role/aws-service-role/autoscaling.amazonaws.com/AWSServiceRoleForAutoScaling,arn:aws:iam::<input_your_aws_account_id>:role/NginxS3PutLambdaRole,arn:aws:iam::123456789012:role/aws-service-role/imagebuilder.amazonaws.com/AWSServiceRoleForImageBuilder,arn:aws:iam::12345678910:role/EC2InstanceRole,arn:aws:iam::12345678910:role/EC2ImageBuilderRole,arn:aws:iam::12345678910:root"
  }
]

Updating the CloudFormation stack

Now that the AWS KMS parameter file has been updated, you update the AWS KMS CloudFormation stack.

1. Run the following command to update the kms-config stack:

aws cloudformation update-stack \
--stack-name kms-config \
--template-body file://Templates/kms.yml \
--parameters file://Parameters/kms-params.json \
--capabilities CAPABILITY_IAM \
--region us-east-1


The output should look like the following:

{
"StackId": "arn:aws:cloudformation:us-east-1:123456789012:stack/kms-config/6e84b750-0905-11eb-b543-0e4dccb471bf"
}


2. Open the AnsibleConfig/component-nginx.yml file and update the <input_s3_bucket_name> value with the bucket name you generated from the s3-iam-config stack:

# Copyright Amazon.com, Inc. or its affiliates. All Rights Reserved.
# SPDX-License-Identifier: MIT-0
name: 'Ansible Playbook Execution on Amazon Linux 2'
description: 'This is a sample component that demonstrates how to download and execute an Ansible playbook against Amazon Linux 2.'
schemaVersion: 1.0
constants:
  - s3bucket:
      type: string
      value: <input_s3_bucket_name>
phases:
  - name: build
    steps:
      - name: InstallAnsible
        action: ExecuteBash
        inputs:
          commands:
           - sudo amazon-linux-extras install -y ansible2
      - name: CreateDirectory
        action: ExecuteBash
        inputs:
          commands:
            - sudo mkdir -p /ansibleloc/roles
      - name: DownloadLinuxCis
        action: S3Download
        inputs:
          - source: 's3://{{ s3bucket }}/components/linux-cis.zip'
            destination: '/ansibleloc/linux-cis.zip'
      - name: UzipLinuxCis
        action: ExecuteBash
        inputs:
          commands:
            - unzip /ansibleloc/linux-cis.zip -d /ansibleloc/roles
            - echo "unzip linux-cis file"
      - name: DownloadCisPlaybook
        action: S3Download
        inputs:
          - source: 's3://{{ s3bucket }}/components/cis_playbook.yml'
            destination: '/ansibleloc/cis_playbook.yml'
      - name: InvokeCisAnsible
        action: ExecuteBinary
        inputs:
          path: ansible-playbook
          arguments:
            - '{{ build.DownloadCisPlaybook.inputs[0].destination }}'
            - '--tags=level1'
      - name: DeleteCisPlaybook
        action: ExecuteBash
        inputs:
          commands:
            - rm '{{ build.DownloadCisPlaybook.inputs[0].destination }}'
      - name: DownloadNginx
        action: S3Download
        inputs:
          - source: s3://{{ s3bucket }}/components/nginx.zip'
            destination: '/ansibleloc/nginx.zip'
      - name: UzipNginx
        action: ExecuteBash
        inputs:
          commands:
            - unzip /ansibleloc/nginx.zip -d /ansibleloc/roles
            - echo "unzip Nginx file"
      - name: DownloadNginxPlaybook
        action: S3Download
        inputs:
          - source: 's3://{{ s3bucket }}/components/nginx_playbook.yml'
            destination: '/ansibleloc/nginx_playbook.yml'
      - name: InvokeNginxAnsible
        action: ExecuteBinary
        inputs:
          path: ansible-playbook
          arguments:
            - '{{ build.DownloadNginxPlaybook.inputs[0].destination }}'
      - name: DeleteNginxPlaybook
        action: ExecuteBash
        inputs:
          commands:
            - rm '{{ build.DownloadNginxPlaybook.inputs[0].destination }}'

  - name: validate
    steps:
      - name: ValidateDebug
        action: ExecuteBash
        inputs:
          commands:
            - sudo echo "ValidateDebug section"

  - name: test
    steps:
      - name: TestDebug
        action: ExecuteBash
        inputs:
          commands:
            - sudo echo "TestDebug section"
      - name: Download_Inspector_Test
        action: S3Download
        inputs:
          - source: 's3://ec2imagebuilder-managed-resources-us-east-1-prod/components/inspector-test-linux/1.0.1/InspectorTest'
            destination: '/workdir/InspectorTest'
      - name: Set_Executable_Permissions
        action: ExecuteBash
        inputs:
          commands:
            - sudo chmod +x /workdir/InspectorTest
      - name: ExecuteInspectorAssessment
        action: ExecuteBinary
        inputs:
          path: '/workdir/InspectorTest'


Adding files to your S3 buckets

Now you assume a role you generated from one of the previous CloudFormation stacks. This allows you to add files to the encrypted S3 bucket.

1. Run the following command and make sure to update the role to use your AWS account ID number:

aws sts assume-role --role-arn "arn:aws:iam::<input_your_aws_account_id>:role/EC2ImageBuilderRole" --role-session-name AWSCLI-Session

You see an output similar to the following:

{
    "Credentials": {
        "AccessKeyId": "<AWS_ACCESS_KEY_ID>",
        "SecretAccessKey": "<AWS_SECRET_ACCESS_KEY_ID>",
        "SessionToken": "<AWS_SESSION_TOKEN>",
        "Expiration": "2020-11-20T02:54:17Z"
    },
    "AssumedRoleUser": {
        "AssumedRoleId": "ACPATGCCLSNJCNSJCEWZ:AWSCLI-Session",
        "Arn": "arn:aws:sts::123456789012:assumed-role/EC2ImageBuilderRole/AWSCLI-Session"
    }
}

You now assume the EC2ImageBuilderRole IAM role from the command line. This role allows you to create objects in the S3 bucket generated from the s3-iam-config stack. Because this bucket is encrypted with AWS KMS, any user or IAM role requires specific permissions to decrypt the key. You have already accounted for this in a previous step by adding the EC2ImageBuilderRole IAM role to the KMS key policy.


2. Create the following environment variable to use the EC2ImageBuilderRole role. Update the values with the output from the previous step:

export AWS_ACCESS_KEY_ID=AccessKeyId
export AWS_SECRET_ACCESS_KEY=SecretAccessKey
export AWS_SESSION_TOKEN=SessionToken


3. Check to make sure that you have actually assumed the role EC2ImageBuilderRole:

aws sts get-caller-identity

You should see an output similar to the following:

{
    "UserId": "AROATG5CKLSWENUYOF6A4:AWSCLI-Session",
    "Account": "123456789012",
    "Arn": "arn:aws:sts::123456789012:assumed-role/EC2ImageBuilderRole/AWSCLI-Session"
}


4. Create a folder inside of the encrypted S3 bucket generated in the s3-iam-config stack:

aws s3api put-object --bucket <input_your_bucket_name> --key components


5. Zip the configuration files that you use in the Image Builder pipeline process:

zip -r linux-cis.zip LinuxCis/
zip -r nginx.zip Nginx/


6. Upload the configuration files to S3 bucket. Update the bucket name with the S3 bucket name you generated in the s3-iam-config stack.

aws s3 cp linux-cis.zip s3://<input_your_bucket_name>/components/

aws s3 cp nginx.zip s3://<input_your_bucket_name>/components/

aws s3 cp AnsibleConfig/cis_playbook.yml s3://<input_your_bucket_name>/components/

aws s3 cp AnsibleConfig/nginx_playbook.yml s3://<input_your_bucket_name>/components/

aws s3 cp AnsibleConfig/component-nginx.yml s3://<input_your_bucket_name>/components/

Deploying your pipeline

You’re now ready to deploy your pipeline.

1. Switch back to the original IAM user profile you used before assuming the EC2ImageBuilderRole. For instructions, see How do I assume an IAM role using the AWS CLI?


2. Open the Parameters/nginx-image-builder-params.json file and update the ImageBuilderBucketName parameter with the S3 bucket name generated in the s3-iam-config stack:

[
  {
    "ParameterKey": "Environment",
    "ParameterValue": "dev"
  },
  {
    "ParameterKey": "ImageBuilderBucketName",
    "ParameterValue": "<input_your_bucket_name>"
  },
  {
    "ParameterKey": "NetworkStackName",
    "ParameterValue": "vpc-config"
  },
  {
    "ParameterKey": "KMSStackName",
    "ParameterValue": "kms-config"
  },
  {
    "ParameterKey": "S3ConfigStackName",
    "ParameterValue": "s3-iam-config"
  }
]


3. Deploy the nginx-image-builder.yml template:

aws cloudformation create-stack \
--stack-name cis-image-builder \
--template-body file://Templates/nginx-image-builder.yml \
--parameters file://Parameters/nginx-image-builder-params.json \
--capabilities CAPABILITY_NAMED_IAM \
--region us-east-1

The template takes around 35 minutes to complete. Deploying this template starts the Image Builder pipeline.


Monitoring the pipeline

You can get more details about the pipeline on the AWS Management Console.

1. On the Image Builder console, choose Image pipelines to see the status of the pipeline.

Figure: Shows the EC2 Image Builder Pipeline status


2. Choose the pipeline (for this post, cis-image-builder-LinuxCis-Pipeline)

On the pipeline details page, you can view more information and make updates to its configuration.

Figure: Shows the Image Builder Pipeline metadata

At this point, the Image Builder pipeline has started running the automation document in Systems Manager. Here you can monitor the progress of the AMI build.


3. On the Systems Manager console, choose Automation.


4. Choose the execution ID of the arn:aws:ssm:us-east-1:123456789012:document/ImageBuilderBuildImageDocument document.

Figure: Shows the Image Builder Pipeline Systems Manager Automation steps


5. Choose the step ID to see what is happening in each step.

At this point, the Image Builder pipeline is bringing up an Amazon Linux 2 EC2 instance. From there, we run Ansible playbooks that configure the security and application settings. The automation is pulling its configuration from the S3 bucket you deployed in a previous step. When the Ansible run is complete, the instance stops and an AMI is generated from this instance. When this is complete, a cleanup is initiated that ends the EC2 instance. The final result is a CIS Level 1 hardened Amazon Linux 2 AMI running Nginx.


Updating parameters

When the stack is complete, you retrieve some new parameter values.

1. On the Systems Manager console, choose Automation.


2. Choose the execution ID of the arn:aws:ssm:us-east-1:123456789012:document/ImageBuilderBuildImageDocument document.


3. Choose step 21.

The following screenshot shows the output of this step.

Figure: Shows step of EC2 Image Builder Pipeline


4. Open the Parameters/nginx-config.json file and update the AmiId parameter with the AMI ID generated from the previous step:

[
  {
    "ParameterKey" : "Environment",
    "ParameterValue" : "dev"
  },
  {
    "ParameterKey": "NetworkStackName",
    "ParameterValue" : "vpc-config"
  },
  {
    "ParameterKey" : "S3ConfigStackName",
    "ParameterValue" : "s3-iam-config"
  },
  {
    "ParameterKey": "AmiId",
    "ParameterValue" : "<input_the_cis_hardened_ami_id>"
  },
  {
    "ParameterKey": "ApplicationName",
    "ParameterValue" : "Nginx"
  },
  {
    "ParameterKey": "NLBName",
    "ParameterValue" : "DemoALB"
  },
  {
    "ParameterKey": "TargetGroupName",
    "ParameterValue" : "DemoTG"
  }
]


5. Deploy the nginx-config.yml template:

aws cloudformation create-stack \
--stack-name nginx-config \
--template-body file://Templates/nginx-config.yml \
--parameters file://Parameters/nginx-config.json \
--capabilities CAPABILITY_NAMED_IAM \
--region us-east-1

The output should look like the following:

{
    "StackId": "arn:aws:cloudformation:us-east-1:123456789012:stack/nginx-config/fb2b0f30-24f6-11eb-ad7c-0a3238f55eb3"
}


6. Deploy the infrastructure-ssm-params.yml template:

aws cloudformation create-stack \
--stack-name ssm-params-config \
--template-body file://Templates/infrastructure-ssm-params.yml \
--parameters file://Parameters/infrastructure-ssm-parameters.json \
--capabilities CAPABILITY_NAMED_IAM \
--region us-east-1


Verifying Nginx is running

Let’s verify that our Nginx service is up and running properly. You use Session Manager to connect to a testing instance.

1. On the Amazon EC2 console, choose Instances.

You should see three instances, as in the following screenshot.

Figure: Shows the Nginx EC2 instances

You can connect to either one of the Nginx instances.


2. Select the testing instance.


3. On the Actions menu, choose Connect.


4. Choose Session Manager.


5. Choose Connect.

A terminal on the EC2 instance opens, similar to the following screenshot.

Figure: Shows the Session Manager terminal

6. Run the following command to ensure that Nginx is running properly:

curl localhost:8080

You should see an output similar to the following screenshot.

Figure: Shows Nginx output from terminal

Reviewing resources and configurations

Now that you have deployed the core services that for the solution, take some time to review the services that you have just deployed.


IAM roles

This project creates several IAM roles that are used to manage AWS resources. For example, EC2ImageBuilderRole is used to configure new AMIs with the Image Builder pipeline. This role contains only the permissions required to manage the Image Builder process. Adopting this pattern enforces the practice of least privilege. Additionally, many of the IAM polices attached to the IAM roles are restricted down to specific AWS resources. Let’s look at a couple of examples of managing IAM permissions with this project.


The following policy restricts Amazon S3 access to a specific S3 bucket. This makes sure that the role this policy is attached to can only access this specific S3 bucket. If this role needs to access any additional S3 buckets, the resource has to be explicitly added.

Policies:
  - PolicyName: GrantS3Read
    PolicyDocument:
      Statement:
        - Sid: GrantS3Read
          Effect: Allow
          Action:
            - s3:List*
            - s3:Get*
            - s3:Put*
          Resource: !Sub 'arn:aws:s3:::${S3Bucket}*'

Let’s look at the EC2ImageBuilderRole. A common scenario that occurs is when you need to assume a role locally in order to perform an action on a resource. In this case, because you’re using AWS KMS to encrypt the S3 bucket, you need to assume a role that has access to decrypt the KMS key so that artifacts can be uploaded to the S3 bucket. In the following AssumeRolePolicyDocument, we allow Amazon EC2 and Systems Manager services to be assumed by this role. Additionally, we allow IAM users to assume this role as well.

AssumeRolePolicyDocument:
  Version: 2012-10-17
  Statement:
    - Effect: Allow
      Principal:
        Service:
          - ec2.amazonaws.com
          - ssm.amazonaws.com
          - imagebuilder.amazonaws.com
        AWS: !Sub 'arn:aws:iam::${AWS::AccountId}:root'
      Action:
        - sts:AssumeRole

The principle !Sub 'arn:aws:iam::${AWS::AccountId}:root allows for any IAM user in this account to assume this role locally. Normally, this role should be scoped down to specific IAM users or roles. For the purpose of this post, we grant permissions to all users of the account.


Nginx configuration

The AMI built from the Image Builder pipeline contains all of the application and security configurations required to run Nginx as a web application. When an instance is launched from this AMI, no additional configuration is required.

We use Amazon EC2 launch templates to configure the application stack. The launch templates contain information such as the AMI ID, instance type, and security group. When a new AMI is provisioned, you simply update the launch template CloudFormation parameter with the new AMI and update the CloudFormation stack. From here, you can start an Auto Scaling group instance refresh to update the application stack to use the new AMI. The Auto Scaling group is updated with instances running on the updated AMI by bringing down one instance at a time and replacing it.


Amazon Inspector configuration

Amazon Inspector is an automated security assessment service that helps improve the security and compliance of applications deployed on AWS. With Amazon Inspector, assessments are generated for exposure, vulnerabilities, and deviations from best practices.

After performing an assessment, Amazon Inspector produces a detailed list of security findings prioritized by level of severity. These findings can be reviewed directly or as part of detailed assessment reports that are available via the Amazon Inspector console or API. We can use Amazon Inspector to assess our security posture against the CIS Level 1 standard that we use our Image Builder pipeline to provision. Let’s look at how we configure Amazon Inspector.

A resource group defines a set of tags that, when queried, identify the AWS resources that make up the assessment target. Any EC2 instance that is launched with the tag specified in the resource group is in scope for Amazon Inspector assessment runs. The following code shows our configuration:

ResourceGroup:
  Type: "AWS::Inspector::ResourceGroup"
  Properties:
    ResourceGroupTags:
      - Key: "ResourceGroup"
        Value: "Nginx"

AssessmentTarget:
  Type: AWS::Inspector::AssessmentTarget
  Properties:
    AssessmentTargetName : "NginxAssessmentTarget"
    ResourceGroupArn : !Ref ResourceGroup

In the following code, we specify the tag set in the resource group, which makes sure that when an instance is launched from this AMI, it’s under the scope of Amazon Inspector:

IBImage:
  Type: AWS::ImageBuilder::Image
  Properties:
    ImageRecipeArn: !Ref Recipe
    InfrastructureConfigurationArn: !Ref Infrastructure
    DistributionConfigurationArn: !Ref Distribution
    ImageTestsConfiguration:
      ImageTestsEnabled: false
      TimeoutMinutes: 60
    Tags:
      ResourceGroup: 'Nginx'


Building and deploying a new image with Amazon Inspector tests enabled

For this final portion of this post, we build and deploy a new AMI with an Amazon Inspector evaluation.

1. In your text editor, open Templates/nginx-image-builder.yml and update the pipeline and IBImage resource property ImageTestsEnabled to true.

The updated configuration should look like the following:

IBImage:
  Type: AWS::ImageBuilder::Image
  Properties:
    ImageRecipeArn: !Ref Recipe
    InfrastructureConfigurationArn: !Ref Infrastructure
    DistributionConfigurationArn: !Ref Distribution
    ImageTestsConfiguration:
      ImageTestsEnabled: true
      TimeoutMinutes: 60
    Tags:
      ResourceGroup: 'Nginx'


2. Update the stack with the new configuration:

aws cloudformation update-stack \
--stack-name cis-image-builder \
--template-body file://Templates/nginx-image-builder.yml \
--parameters file://Parameters/nginx-image-builder-params.json \
--capabilities CAPABILITY_NAMED_IAM \
--region us-east-1

This starts a new AMI build with an Amazon Inspector evaluation. The process can take up to 2 hours to complete.

3. On the Amazon Inspector console, choose Assessment Runs.

Figure: Shows Amazon Inspector Assessment Run

4. Under Reports, choose Download report.

5. For Select report type, select Findings report.

6. For Select report format, select PDF.

7. Choose Generate report.

The following screenshot shows the findings report from the Amazon Inspector run.

This report generates an assessment against the CIS Level 1 standard. Any policies that don’t comply with the CIS Level 1 standard are explicitly called out in this report.

Section 3.1 lists any failed policies.


Figure: Shows Inspector findings

These failures are detailed later in the report, along with suggestions for remediation.

In section 4.1, locate the entry 1.3.2 Ensure filesystem integrity is regularly checked. This section shows the details of a failure from the Amazon Inspector findings report. You can also see suggestions on how to remediate the issue. Under Recommendation, the findings report suggests a specific command that you can use to remediate the issue.


Figure: Shows Inspector findings issue

You can use the Image Builder pipeline to simply update the Ansible playbooks with this setting, then run the Image Builder pipeline to build a new AMI, deploy the new AMI to an EC2 Instance, and run the Amazon Inspector report to ensure that the issue has been resolved. Finally, we can see the specific instances that have been assessed that have this issue.

Organizations often customize security settings based off of a given use case. Your organization may choose CIS Level 1 as a standard but elect to not apply all the recommendations. For example, you might choose to not use the FirewallD service on your Linux instances, because you feel that using Amazon EC2 security groups gives you enough networking security in place that you don’t need an additional firewall. Disabling FirewallD causes a high severity failure in the Amazon Inspector report. This is expected and can be ignored when evaluating the report.


Conclusion
In this post, we showed you how to use Image Builder to automate the creation of AMIs. Additionally, we also showed you how to use the AWS CLI to deploy CloudFormation stacks. Finally, we walked through how to evaluate resources against CIS Level 1 Standard using Amazon Inspector.


About the Authors


Joe Keating is a Modernization Architect in Professional Services at Amazon Web Services. He works with AWS customers to design and implement a variety of solutions in the AWS Cloud. Joe enjoys cooking with a glass or two of wine and achieving mediocrity on the golf course.


Virginia Chu is a Sr. Cloud Infrastructure Architect in Professional Services at Amazon Web Services. She works with enterprise-scale customers around the globe to design and implement a variety of solutions in the AWS Cloud.


Optimizing AWS Lambda cost and performance using AWS Compute Optimizer

Post Syndicated from Chad Schmutzer original https://aws.amazon.com/blogs/compute/optimizing-aws-lambda-cost-and-performance-using-aws-compute-optimizer/

This post is authored by Brooke Chen, Senior Product Manager for AWS Compute Optimizer, Letian Feng, Principal Product Manager for AWS Compute Optimizer, and Chad Schmutzer, Principal Developer Advocate for Amazon EC2

Optimizing compute resources is a critical component of any application architecture. Over-provisioning compute can lead to unnecessary infrastructure costs, while under-provisioning compute can lead to poor application performance.

Launched in December 2019, AWS Compute Optimizer is a recommendation service for optimizing the cost and performance of AWS compute resources. It generates actionable optimization recommendations tailored to your specific workloads. Over the last year, thousands of AWS customers reduced compute costs up to 25% by using Compute Optimizer to help choose the optimal Amazon EC2 instance types for their workloads.

One of the most frequent requests from customers is for AWS Lambda recommendations in Compute Optimizer. Today, we announce that Compute Optimizer now supports memory size recommendations for Lambda functions. This allows you to reduce costs and increase performance for your Lambda-based serverless workloads. To get started, opt in for Compute Optimizer to start finding recommendations.

Overview

With Lambda, there are no servers to manage, it scales automatically, and you only pay for what you use. However, choosing the right memory size settings for a Lambda function is still an important task. Computer Optimizer uses machine-learning based memory recommendations to help with this task.

These recommendations are available through the Compute Optimizer console, AWS CLI, AWS SDK, and the Lambda console. Compute Optimizer continuously monitors Lambda functions, using historical performance metrics to improve recommendations over time. In this blog post, we walk through an example to show how to use this feature.

Using Compute Optimizer for Lambda

This tutorial uses the AWS CLI v2 and the AWS Management Console.

In this tutorial, we setup two compute jobs that run every minute in AWS Region US East (N. Virginia). One job is more CPU intensive than the other. Initial tests show that the invocation times for both jobs typically last for less than 60 seconds. The goal is to either reduce cost without much increase in duration, or reduce the duration in a cost-efficient manner.

Based on these requirements, a serverless solution can help with this task. Amazon EventBridge can schedule the Lambda functions using rules. To ensure that the functions are optimized for cost and performance, you can use the memory recommendation support in Compute Optimizer.

In your AWS account, opt in to Compute Optimizer to start analyzing AWS resources. Ensure you have the appropriate IAM permissions configured – follow these steps for guidance. If you prefer to use the console to opt in, follow these steps. To opt in, enter the following command in a terminal window:

$ aws compute-optimizer update-enrollment-status --status Active

Once you enable Compute Optimizer, it starts to scan for functions that have been invoked for at least 50 times over the trailing 14 days. The next section shows two example scheduled Lambda functions for analysis.

Example Lambda functions

The code for the non-CPU intensive job is below. A Lambda function named lambda-recommendation-test-sleep is created with memory size configured as 1024 MB. An EventBridge rule is created to trigger the function on a recurring 1-minute schedule:

import json
import time

def lambda_handler(event, context):
  time.sleep(30)
  x=[0]*100000000
  return {
    'statusCode': 200,
    'body': json.dumps('Hello World!')
  }

The code for the CPU intensive job is below. A Lambda function named lambda-recommendation-test-busy is created with memory size configured as 128 MB. An EventBridge rule is created to trigger the function on a recurring 1-minute schedule:

import json
import random

def lambda_handler(event, context):
  random.seed(1)
  x=0
  for i in range(0, 20000000):
    x+=random.random()

  return {
    'statusCode': 200,
    'body': json.dumps('Sum:' + str(x))
  }

Understanding the Compute Optimizer recommendations

Compute Optimizer needs a history of at least 50 invocations of a Lambda function over the trailing 14 days to deliver recommendations. Recommendations are created by analyzing function metadata such as memory size, timeout, and runtime, in addition to CloudWatch metrics such as number of invocations, duration, error count, and success rate.

Compute Optimizer will gather the necessary information to provide memory recommendations for Lambda functions, and make them available within 48 hours. Afterwards, these recommendations will be refreshed daily.

These are recent invocations for the non-CPU intensive function:

Recent invocations for the non-CPU intensive function

Function duration is approximately 31.3 seconds with a memory setting of 1024 MB, resulting in a duration cost of about $0.00052 per invocation. Here are the recommendations for this function in the Compute Optimizer console:

Recommendations for this function in the Compute Optimizer console

The function is Not optimized with a reason of Memory over-provisioned. You can also fetch the same recommendation information via the CLI:

$ aws compute-optimizer \
  get-lambda-function-recommendations \
  --function-arns arn:aws:lambda:us-east-1:123456789012:function:lambda-recommendation-test-sleep
{
    "lambdaFunctionRecommendations": [
        {
            "utilizationMetrics": [
                {
                    "name": "Duration",
                    "value": 31333.63587049883,
                    "statistic": "Average"
                },
                {
                    "name": "Duration",
                    "value": 32522.04,
                    "statistic": "Maximum"
                },
                {
                    "name": "Memory",
                    "value": 817.67049838188,
                    "statistic": "Average"
                },
                {
                    "name": "Memory",
                    "value": 819.0,
                    "statistic": "Maximum"
                }
            ],
            "currentMemorySize": 1024,
            "lastRefreshTimestamp": 1608735952.385,
            "numberOfInvocations": 3090,
            "functionArn": "arn:aws:lambda:us-east-1:123456789012:function:lambda-recommendation-test-sleep:$LATEST",
            "memorySizeRecommendationOptions": [
                {
                    "projectedUtilizationMetrics": [
                        {
                            "name": "Duration",
                            "value": 30015.113193697029,
                            "statistic": "LowerBound"
                        },
                        {
                            "name": "Duration",
                            "value": 31515.86878891883,
                            "statistic": "Expected"
                        },
                        {
                            "name": "Duration",
                            "value": 33091.662123300975,
                            "statistic": "UpperBound"
                        }
                    ],
                    "memorySize": 900,
                    "rank": 1
                }
            ],
            "functionVersion": "$LATEST",
            "finding": "NotOptimized",
            "findingReasonCodes": [
                "MemoryOverprovisioned"
            ],
            "lookbackPeriodInDays": 14.0,
            "accountId": "123456789012"
        }
    ]
}

The Compute Optimizer recommendation contains useful information about the function. Most importantly, it has determined that the function is over-provisioned for memory. The attribute findingReasonCodes shows the value MemoryOverprovisioned. In memorySizeRecommendationOptions, Compute Optimizer has found that using a memory size of 900 MB results in an expected invocation duration of approximately 31.5 seconds.

For non-CPU intensive jobs, reducing the memory setting of the function often doesn’t have a negative impact on function duration. The recommendation confirms that you can reduce the memory size from 1024 MB to 900 MB, saving cost without significantly impacting duration. The new duration cost per invocation saves approximately 12%.

The Compute Optimizer console validates these calculations:

Compute Optimizer console validates these calculations

These are recent invocations for the second function which is CPU-intensive:

Recent invocations for the second function which is CPU-intensive

The function duration is about 37.5 seconds with a memory setting of 128 MB, resulting in a duration cost of about $0.000078 per invocation. The recommendations for this function appear in the Compute Optimizer console:

recommendations for this function appear in the Compute Optimizer console

The function is also Not optimized with a reason of Memory under-provisioned. The same recommendation information is available via the CLI:

$ aws compute-optimizer \
  get-lambda-function-recommendations \
  --function-arns arn:aws:lambda:us-east-1:123456789012:function:lambda-recommendation-test-busy
{
    "lambdaFunctionRecommendations": [
        {
            "utilizationMetrics": [
                {
                    "name": "Duration",
                    "value": 36006.85851551957,
                    "statistic": "Average"
                },
                {
                    "name": "Duration",
                    "value": 38540.43,
                    "statistic": "Maximum"
                },
                {
                    "name": "Memory",
                    "value": 53.75978407557355,
                    "statistic": "Average"
                },
                {
                    "name": "Memory",
                    "value": 55.0,
                    "statistic": "Maximum"
                }
            ],
            "currentMemorySize": 128,
            "lastRefreshTimestamp": 1608725151.752,
            "numberOfInvocations": 741,
            "functionArn": "arn:aws:lambda:us-east-1:123456789012:function:lambda-recommendation-test-busy:$LATEST",
            "memorySizeRecommendationOptions": [
                {
                    "projectedUtilizationMetrics": [
                        {
                            "name": "Duration",
                            "value": 27340.37604781184,
                            "statistic": "LowerBound"
                        },
                        {
                            "name": "Duration",
                            "value": 28707.394850202432,
                            "statistic": "Expected"
                        },
                        {
                            "name": "Duration",
                            "value": 30142.764592712556,
                            "statistic": "UpperBound"
                        }
                    ],
                    "memorySize": 160,
                    "rank": 1
                }
            ],
            "functionVersion": "$LATEST",
            "finding": "NotOptimized",
            "findingReasonCodes": [
                "MemoryUnderprovisioned"
            ],
            "lookbackPeriodInDays": 14.0,
            "accountId": "123456789012"
        }
    ]
}

For this function, Compute Optimizer has determined that the function’s memory is under-provisioned. The value of findingReasonCodes is MemoryUnderprovisioned. The recommendation is to increase the memory from 128 MB to 160 MB.

This recommendation may seem counter-intuitive, since the function only uses 55 MB of memory per invocation. However, Lambda allocates CPU and other resources linearly in proportion to the amount of memory configured. This means that increasing the memory allocation to 160 MB also reduces the expected duration to around 28.7 seconds. This is because a CPU-intensive task also benefits from the increased CPU performance that comes with the additional memory.

After applying this recommendation, the new expected duration cost per invocation is approximately $0.000075. This means that for almost no change in duration cost, the job latency is reduced from 37.5 seconds to 28.7 seconds.

The Compute Optimizer console validates these calculations:

Compute Optimizer console validates these calculations

Applying the Compute Optimizer recommendations

To optimize the Lambda functions using Compute Optimizer recommendations, use the following CLI command:

$ aws lambda update-function-configuration \
  --function-name lambda-recommendation-test-sleep \
  --memory-size 900

After invoking the function multiple times, we can see metrics of these invocations in the console. This shows that the function duration has not changed significantly after reducing the memory size from 1024 MB to 900 MB. The Lambda function has been successfully cost-optimized without increasing job duration:

Console shows the metrics from recent invocations

To apply the recommendation to the CPU-intensive function, use the following CLI command:

$ aws lambda update-function-configuration \
  --function-name lambda-recommendation-test-busy \
  --memory-size 160

After invoking the function multiple times, the console shows that the invocation duration is reduced to about 28 seconds. This matches the recommendation’s expected duration. This shows that the function is now performance-optimized without a significant cost increase:

Console shows that the invocation duration is reduced to about 28 seconds

Final notes

A couple of final notes:

  • Not every function will receive a recommendation. Compute optimizer only delivers recommendations when it has high confidence that these recommendations may help reduce cost or reduce execution duration.
  • As with any changes you make to an environment, we strongly advise that you test recommended memory size configurations before applying them into production.

Conclusion

You can now use Compute Optimizer for serverless workloads using Lambda functions. This can help identify the optimal Lambda function configuration options for your workloads. Compute Optimizer supports memory size recommendations for Lambda functions in all AWS Regions where Compute Optimizer is available. These recommendations are available to you at no additional cost. You can get started with Compute Optimizer from the console.

To learn more visit Getting started with AWS Compute Optimizer.


Continuously building and delivering Maven artifacts to AWS CodeArtifact

Post Syndicated from Vinay Selvaraj original https://aws.amazon.com/blogs/devops/continuously-building-and-delivering-maven-artifacts-to-aws-codeartifact/

Artifact repositories are often used to share software packages for use in builds and deployments. Java developers using Apache Maven use artifact repositories to share and reuse Maven packages. For example, one team might own a web service framework that is used by multiple other teams to build their own services. The framework team can publish the framework as a Maven package to an artifact repository, where new versions can be picked up by the service teams as they become available. This post explains how you can set up a continuous integration pipeline with AWS CodePipeline and AWS CodeBuild to deploy Maven artifacts to AWS CodeArtifact. CodeArtifact is a fully managed pay-as-you-go artifact repository service with support for software package managers and build tools like Maven, Gradle, npm, yarn, twine, and pip.

Solution overview

The pipeline we build is triggered each time a code change is pushed to the AWS CodeCommit repository. The code is compiled using the Java compiler, unit tested, and deployed to CodeArtifact. After the artifact is published, it can be consumed by developers working in applications that have a dependency on the artifact or by builds running in other pipelines. The following diagram illustrates this architecture.

Architecture diagram of the solution


All the components in this pipeline are fully managed and you don’t pay for idle capacity or have to manage any servers.


Prerequisites

This post assumes you have the following tools installed and configured:


Creating your resources

To create the CodeArtifact domain, CodeArtifact repository, CodeCommit, CodePipeline, CodeBuild, and associated resources, we use AWS CloudFormation. Save the provided CloudFormation template below as codeartifact-cicd-pipeline.yaml and create a stack:


---
Description: Code Artifact CI/CD Pipeline

Parameters:
  GitRepoBranchName:
    Type: String
    Default: main

Resources:

  ArtifactBucket:
    Type: AWS::S3::Bucket
  
  CodeArtifactDomain:
    Type: AWS::CodeArtifact::Domain
    Properties:
      DomainName: !Sub "${AWS::StackName}-domain"
  
  CodeArtifactRepository:
    Type: AWS::CodeArtifact::Repository
    Properties:
      DomainName: !GetAtt CodeArtifactDomain.Name
      RepositoryName: !Sub "${AWS::StackName}-repo"

  CodeRepository:
    Type: AWS::CodeCommit::Repository
    Properties:
      RepositoryDescription: Maven artifact code repository
      RepositoryName: !Sub "${AWS::StackName}-maven-artifact-repo"
  
  CodeBuildProject:
    Type: AWS::CodeBuild::Project
    Properties:
      Name: !Sub "${AWS::StackName}-CodeBuild"
      Artifacts:
        Type: CODEPIPELINE
      Environment:
        EnvironmentVariables:
          - Name: CODEARTIFACT_DOMAIN
            Type: PLAINTEXT
            Value: !GetAtt CodeArtifactDomain.Name
          - Name: CODEARTIFACT_REPO
            Type: PLAINTEXT
            Value: !GetAtt CodeArtifactRepository.Name
        Type: LINUX_CONTAINER
        ComputeType: BUILD_GENERAL1_SMALL
        Image: aws/codebuild/amazonlinux2-x86_64-standard:3.0
      ServiceRole: !GetAtt CodeBuildServiceRole.Arn
      Source:
        Type: CODEPIPELINE
        BuildSpec: buildspec.yaml
  
  Pipeline:
    Type: AWS::CodePipeline::Pipeline
    Properties:
      ArtifactStore:
        Type: S3
        Location: !Ref ArtifactBucket
      RoleArn: !GetAtt CodePipelineServiceRole.Arn
      Stages:
      - Name: Source
        Actions:
        - Name: SourceAction
          ActionTypeId:
            Category: Source
            Owner: AWS
            Version: '1'
            Provider: CodeCommit
          OutputArtifacts:
          - Name: SourceBundle
          Configuration:
            BranchName: !Ref GitRepoBranchName
            RepositoryName: !GetAtt CodeRepository.Name
          RunOrder: '1'

      - Name: Deliver
        Actions:
        - Name: CodeBuild
          InputArtifacts:
          - Name: SourceBundle
          ActionTypeId:
            Category: Build
            Owner: AWS
            Version: '1'
            Provider: CodeBuild
          Configuration:
            ProjectName: !Ref CodeBuildProject
          RunOrder: '1'

  CodeBuildServiceRole:
    Type: AWS::IAM::Role
    Properties:
      AssumeRolePolicyDocument:
        Version: '2012-10-17'
        Statement:
        - Sid: ''
          Effect: Allow
          Principal:
            Service:
            - codebuild.amazonaws.com
          Action: sts:AssumeRole
      Policies:
      - PolicyName: CodePipelinePolicy
        PolicyDocument:
          Version: '2012-10-17'
          Statement:
          - Sid: CloudWatchLogsPolicy
            Effect: Allow
            Action:
            - logs:CreateLogGroup
            - logs:CreateLogStream
            - logs:PutLogEvents
            Resource:
            - "*"
          - Sid: CodeCommitPolicy
            Effect: Allow
            Action:
            - codecommit:GitPull
            Resource:
            - !GetAtt CodeRepository.Arn
          - Sid: S3GetObjectPolicy
            Effect: Allow
            Action:
            - s3:GetObject
            - s3:GetObjectVersion
            Resource:
            - !Sub "arn:aws:s3:::${ArtifactBucket}/*"
          - Sid: S3PutObjectPolicy
            Effect: Allow
            Action:
            - s3:PutObject
            Resource:
            - !Sub "arn:aws:s3:::${ArtifactBucket}/*"
          - Sid: BearerTokenPolicy
            Effect: Allow
            Action:
            - sts:GetServiceBearerToken
            Resource: "*"
            Condition:
              StringEquals:
                sts:AWSServiceName: codeartifact.amazonaws.com
          - Sid: CodeArtifactPolicy
            Effect: Allow
            Action:
            - codeartifact:GetAuthorizationToken
            Resource:
            - !Sub "arn:aws:codeartifact:${AWS::Region}:${AWS::AccountId}:domain/${CodeArtifactDomain.Name}"
          - Sid: CodeArtifactPackage
            Effect: Allow
            Action:
            - codeartifact:PublishPackageVersion
            - codeartifact:PutPackageMetadata
            - codeartifact:ReadFromRepository
            Resource:
            - !Sub "arn:aws:codeartifact:${AWS::Region}:${AWS::AccountId}:package/${CodeArtifactDomain.Name}/${CodeArtifactRepository.Name}/*"
          - Sid: CodeArtifactRepository
            Effect: Allow
            Action:
            - codeartifact:ReadFromRepository
            - codeartifact:GetRepositoryEndpoint
            Resource:
            - !Sub "arn:aws:codeartifact:${AWS::Region}:${AWS::AccountId}:repository/${CodeArtifactDomain.Name}/${CodeArtifactRepository.Name}"          

  CodePipelineServiceRole:
    Type: AWS::IAM::Role
    Properties:
      AssumeRolePolicyDocument:
        Version: '2012-10-17'
        Statement:
        - Sid: ''
          Effect: Allow
          Principal:
            Service:
            - codepipeline.amazonaws.com
          Action: sts:AssumeRole
      Policies:
      - PolicyName: CodePipelinePolicy
        PolicyDocument:
          Version: '2012-10-17'
          Statement:
          - Action:
            - s3:GetObject
            - s3:GetObjectVersion
            - s3:GetBucketVersioning
            Resource: !Sub "arn:aws:s3:::${ArtifactBucket}/*"
            Effect: Allow
          - Action:
            - s3:PutObject
            Resource:
            - !Sub "arn:aws:s3:::${ArtifactBucket}/*"
            Effect: Allow
          - Action:
            - codecommit:GetBranch
            - codecommit:GetCommit
            - codecommit:UploadArchive
            - codecommit:GetUploadArchiveStatus
            - codecommit:CancelUploadArchive
            Resource:
              - !GetAtt CodeRepository.Arn
            Effect: Allow
          - Action:
            - codebuild:StartBuild
            - codebuild:BatchGetBuilds
            Resource: 
              - !GetAtt CodeBuildProject.Arn
            Effect: Allow
          - Action:
            - iam:PassRole
            Resource: "*"
            Effect: Allow
Outputs:
  CodePipelineArtifactBucket:
    Value: !Ref ArtifactBucket
  CodeRepositoryHttpCloneUrl:
    Value: !GetAtt CodeRepository.CloneUrlHttp
  CodeRepositorySshCloneUrl:
    Value: !GetAtt CodeRepository.CloneUrlSsh

aws cloudformation deploy                         \
  --stack-name codeartifact-pipeline               \
  --template-file codeartifact-cicd-pipeline.yaml  \
  --capabilities CAPABILITY_IAM


If you have a Maven project you want to use, you can use that. Otherwise, create a new one:


mvn archetype:generate        \
  -DgroupId=com.mycompany.app \
  -DartifactId=my-app         \
  -DarchetypeArtifactId=maven-archetype-quickstart \
  -DarchetypeVersion=1.4 -DinteractiveMode=false


Initialize a Git repository for the Maven project and add the CodeCommit repository that was created in the CloudFormation stack as a remote repository:


cd my-app
git init
CODECOMMIT_URL=$(aws cloudformation describe-stacks --stack-name codeartifact-pipeline --query "Stacks[0].Outputs[?OutputKey=='CodeRepositoryHttpCloneUrl'].OutputValue" --output text)
git remote add origin $CODECOMMIT_URL


Updating the POM file

The Maven project’s POM file needs to be updated with the distribution management section. This lets Maven know where to publish artifacts. Add the distributionManagement section inside the project element of the POM. Be sure to update the URL with the correct URL for the CodeArtifact repository you created earlier. You can find the CodeArtifact repository URL with the get-repository-endpoint CLI command:


aws codeartifact get-repository-endpoint --domain codeartifact-pipeline-domain  --repository codeartifact-pipeline-repo --format maven


Add the following to the Maven project’s pom.xml:


<distributionManagement>
  <repository>
    <id>codeartifact</id>
    <name>codeartifact</name>
    <url>Replace with the URL from the get-repository-endpoint command</url>
  </repository>
</distributionManagement>

Creating a settings.xml file

Maven needs credentials to use to authenticate with CodeArtifact when it performs the deployment. CodeArtifact uses temporary authorization tokens. To pass the token to Maven, a settings.xml file is created in the top level of the Maven project. During the deployment stage, Maven is instructed to use the settings.xml in the top level of the project instead of the settings.xml that normally resides in $HOME/.m2. Create a settings.xml in the top level of the Maven project with the following contents:


<settings>
  <servers>
    <server>
      <id>codeartifact</id>
      <username>aws</username>
      <password>${env.CODEARTIFACT_TOKEN}</password>
    </server>
  </servers>
</settings>

Creating the buildspec.yaml file

CodeBuild uses a build specification file with commands and related settings that are used during the build, test, and delivery of the artifact. In the build specification file, we specify the CodeBuild runtime to use pre-build actions (update AWS CLI), and build actions (Maven build, test, and deploy). When Maven is invoked, it is provided the path to the settings.xml created in the previous step, instead of the default in $HOME/.m2/settings.xml. Create the buildspec.yaml as shown in the following code:


version: 0.2

phases:
  install:
    runtime-versions:
      java: corretto11

  pre_build:
    commands:
      - pip3 install awscli --upgrade --user

  build:
    commands:
      - export CODEARTIFACT_TOKEN=`aws codeartifact get-authorization-token --domain ${CODEARTIFACT_DOMAIN} --query authorizationToken --output text`
      - mvn -s settings.xml clean package deploy


Running the pipeline

The final step is to add the files in the Maven project to the Git repository and push the changes to CodeCommit. This triggers the pipeline to run. See the following code:


git checkout -b main
git add settings.xml buildspec.yaml pom.xml src
git commit -a -m "Initial commit"
git push --set-upstream origin main


Checking the pipeline

At this point, the pipeline starts to run. To check its progress, sign in to the AWS Management Console and choose the Region where you created the pipeline. On the CodePipeline console, open the pipeline that the CloudFormation stack created. The pipeline’s name is prefixed with the stack name. If you open the CodePipeline console before the pipeline is complete, you can watch each stage run (see the following screenshot).

CodePipeline Screenshot

If you see that the pipeline failed, you can choose the details in the action that failed for more information.

Checking for new artifacts published in CodeArtifact

When the pipeline is complete, you should be able to see the artifact in the CodeArtifact repository you created earlier. The artifact we published for this post is a Maven snapshot. CodeArtifact handles snapshots differently than release versions. For more information, see Use Maven snapshots. To find the artifact in CodeArtifact, complete the following steps:

  1. On the CodeArtifact console, choose Repositories.
  2. Choose the repository we created earlier named myrepo.
  3. Search for the package named my-app.
  4. Choose the my-app package from the search results.
    CodeArtifact Assets
  5. Choose the Dependencies tab to bring up a list of Maven dependencies that the Maven project depends on.CodeArtifact Dependencies


Cleaning up

To clean up the resources you created in this post, you need to remove them in the following order:


# Empty the CodePipeline S3 artifact bucket
CODEPIPELINE_BUCKET=$(aws cloudformation describe-stacks --stack-name codeartifact-pipeline --query "Stacks[0].Outputs[?OutputKey=='CodePipelineArtifactBucket'].OutputValue" --output text)
aws s3 rm s3://$CODEPIPELINE_BUCKET --recursive

# Delete the CloudFormation stack
aws cloudformation delete-stack --stack-name codeartifact-pipeline

Conclusion

This post covered how to build a continuous integration pipeline to deliver Maven artifacts to AWS CodeArtifact. You can modify this solution for your specific needs. For more information about CodeArtifact or the other services used, see the following:


Easily configure Amazon DevOps Guru across multiple accounts and Regions using AWS CloudFormation StackSets

Post Syndicated from Nikunj Vaidya original https://aws.amazon.com/blogs/devops/configure-devops-guru-multiple-accounts-regions-using-cfn-stacksets/

As applications become increasingly distributed and complex, operators need more automated practices to maintain application availability and reduce the time and effort spent on detecting, debugging, and resolving operational issues.

Enter Amazon DevOps Guru (preview).

Amazon DevOps Guru is a machine learning (ML) powered service that gives you a simpler way to improve an application’s availability and reduce expensive downtime. Without involving any complex configuration setup, DevOps Guru automatically ingests operational data in your AWS Cloud. When DevOps Guru identifies a critical issue, it automatically alerts you with a summary of related anomalies, the likely root cause, and context on when and where the issue occurred. DevOps Guru also, when possible, provides prescriptive recommendations on how to remediate the issue.

Using Amazon DevOps Guru is easy and doesn’t require you to have any ML expertise. To get started, you need to configure DevOps Guru and specify which AWS resources to analyze. If your applications are distributed across multiple AWS accounts and AWS Regions, you need to configure DevOps Guru for each account-Region combination. Though this may sound complex, it’s in fact very simple to do so using AWS CloudFormation StackSets. This post walks you through the steps to configure DevOps Guru across multiple AWS accounts or organizational units, using AWS CloudFormation StackSets.


Solution overview

The goal of this post is to provide you with sample templates to facilitate onboarding Amazon DevOps Guru across multiple AWS accounts. Instead of logging into each account and enabling DevOps Guru, you use AWS CloudFormation StackSets from the primary account to enable DevOps Guru across multiple accounts in a single AWS CloudFormation operation. When it’s enabled, DevOps Guru monitors your associated resources and provides you with detailed insights for anomalous behavior along with intelligent recommendations to mitigate and incorporate preventive measures.

We consider various options in this post for enabling Amazon DevOps Guru across multiple accounts and Regions:

  • All resources across multiple accounts and Regions
  • Resources from specific CloudFormation stacks across multiple accounts and Regions
  • For All resources in an organizational unit

In the following diagram, we launch the AWS CloudFormation StackSet from a primary account to enable Amazon DevOps Guru across two AWS accounts and carry out operations to generate insights. The StackSet uses a single CloudFormation template to configure DevOps Guru, and deploys it across multiple accounts and regions, as specified in the command.

Figure: Shows enabling of DevOps Guru using CloudFormation StackSets

Figure: Shows enabling of DevOps Guru using CloudFormation StackSets

When Amazon DevOps Guru is enabled to monitor your resources within the account, it uses a combination of vended Amazon CloudWatch metrics, AWS CloudTrail logs, and specific patterns from its ML models to detect an anomaly. When the anomaly is detected, it generates an insight with the recommendations.

Figure: Shows DevOps Guru generating Insights based upon ingested metrics

Figure: Shows DevOps Guru monitoring the resources and generating insights for anomalies detected


Prerequisites

To complete this post, you should have the following prerequisites:

  • Two AWS accounts. For this post, we use the account numbers 111111111111 (primary account) and 222222222222. We will carry out the CloudFormation operations and monitoring of the stacks from this primary account.
  • To use organizations instead of individual accounts, identify the organization unit (OU) ID that contains at least one AWS account.
  • Access to a bash environment, either using an AWS Cloud9 environment or your local terminal with the AWS Command Line Interface (AWS CLI) installed.
  • AWS Identity and Access Management (IAM) roles for AWS CloudFormation StackSets.
  • Knowledge of CloudFormation StackSets


(a) Using an AWS Cloud9 environment or AWS CLI terminal
We recommend using AWS Cloud9 to create an environment to get access to the AWS CLI from a bash terminal. Make sure you select Linux2 as the operating system for the AWS Cloud9 environment.

Alternatively, you may use your bash terminal in your favorite IDE and configure your AWS credentials in your terminal.

(b) Creating IAM roles

If you are using Organizations for account management, you would not need to create the IAM roles manually and instead use Organization based trusted access and SLRs. You may skip the sections (b), (c) and (d). If not using Organizations, please read further.

Before you can deploy AWS CloudFormation StackSets, you must have the following IAM roles:

  • AWSCloudFormationStackSetAdministrationRole
  • AWSCloudFormationStackSetExecutionRole

The IAM role AWSCloudFormationStackSetAdministrationRole should be created in the primary account whereas AWSCloudFormationStackSetExecutionRole role should be created in all the accounts where you would like to run the StackSets.

If you’re already using AWS CloudFormation StackSets, you should already have these roles in place. If not, complete the following steps to provision these roles.

(c) Creating the AWSCloudFormationStackSetAdministrationRole role
To create the AWSCloudFormationStackSetAdministrationRole role, sign in to your primary AWS account and go to the AWS Cloud9 terminal.

Execute the following command to download the file:

curl -O https://s3.amazonaws.com/cloudformation-stackset-sample-templates-us-east-1/AWSCloudFormationStackSetAdministrationRole.yml

Execute the following command to create the stack:

aws cloudformation create-stack \
--stack-name AdminRole \
--template-body file:///$PWD/AWSCloudFormationStackSetAdministrationRole.yml \
--capabilities CAPABILITY_NAMED_IAM \
--region us-east-1

(d) Creating the AWSCloudFormationStackSetExecutionRole role
You now create the role AWSCloudFormationStackSetExecutionRole in the primary account and other target accounts where you want to enable DevOps Guru. For this post, we create it for our two accounts and two Regions (us-east-1 and us-east-2).

Execute the following command to download the file:

curl -O https://s3.amazonaws.com/cloudformation-stackset-sample-templates-us-east-1/AWSCloudFormationStackSetExecutionRole.yml

Execute the following command to create the stack:

aws cloudformation create-stack \
--stack-name ExecutionRole \
--template-body file:///$PWD/AWSCloudFormationStackSetExecutionRole.yml \
--parameters ParameterKey=AdministratorAccountId,ParameterValue=111111111111 \
--capabilities CAPABILITY_NAMED_IAM \
--region us-east-1

Now that the roles are provisioned, you can use AWS CloudFormation StackSets in the next section.


Running AWS CloudFormation StackSets to enable DevOps Guru

With the required IAM roles in place, now you can deploy the stack sets to enable DevOps Guru across multiple accounts.

As a first step, go to your bash terminal and clone the GitHub repository to access the CloudFormation templates:

git clone https://github.com/aws-samples/amazon-devopsguru-samples
cd amazon-devopsguru-samples/enable-devopsguru-stacksets


(a) Configuring Amazon SNS topics for DevOps Guru to send notifications for operational insights

If you want to receive notifications for operational insights generated by Amazon DevOps Guru, you need to configure an Amazon Simple Notification Service (Amazon SNS) topic across multiple accounts. If you have already configured SNS topics and want to use them, identify the topic name and directly skip to the step to enable DevOps Guru.

Note for Central notification target: You may prefer to configure an SNS Topic in the central AWS account so that all Insight notifications are sent to a single target. In such a case, you would need to modify the central account SNS topic policy to allow other accounts to send notifications.

To create your stack set, enter the following command (provide an email for receiving insights):

aws cloudformation create-stack-set \
--stack-set-name CreateDevOpsGuruTopic \
--template-body file:///$PWD/CreateSNSTopic.yml \
--parameters ParameterKey=EmailAddress,ParameterValue=<[email protected]> \
--region us-east-1

Instantiate AWS CloudFormation StackSets instances across multiple accounts and multiple Regions (provide your account numbers and Regions as needed):

aws cloudformation create-stack-instances \
--stack-set-name CreateDevOpsGuruTopic \
--accounts '["111111111111","222222222222"]' \
--regions '["us-east-1","us-east-2"]' \
--operation-preferences FailureToleranceCount=0,MaxConcurrentCount=1

After running this command, the SNS topic devops-guru is created across both the accounts. Go to the email address specified and confirm the subscription by clicking the Confirm subscription link in each of the emails that you receive. Your SNS topic is now fully configured for DevOps Guru to use.

Figure: Shows creation of SNS topic to receive insights from DevOps Guru

Figure: Shows creation of SNS topic to receive insights from DevOps Guru


(b) Enabling DevOps Guru

Let us first examine the CloudFormation template format to enable DevOps Guru and configure it to send notifications over SNS topics. See the following code snippet:

Resources:
  DevOpsGuruMonitoring:
    Type: AWS::DevOpsGuru::ResourceCollection
    Properties:
      ResourceCollectionFilter:
        CloudFormation:
          StackNames: *

  DevOpsGuruNotification:
    Type: AWS::DevOpsGuru::NotificationChannel
    Properties:
      Config:
        Sns:
          TopicArn: arn:aws:sns:us-east-1:111111111111:SnsTopic


When the StackNames property is fed with a value of *, it enables DevOps Guru for all CloudFormation stacks. However, you can enable DevOps Guru for only specific CloudFormation stacks by providing the desired stack names as shown in the following code:


Resources:
  DevOpsGuruMonitoring:
    Type: AWS::DevOpsGuru::ResourceCollection
    Properties:
      ResourceCollectionFilter:
        CloudFormation:
          StackNames:
          - StackA
          - StackB


For the CloudFormation template in this post, we provide the names of the stacks using the parameter inputs. To enable the AWS CLI to accept a list of inputs, we need to configure the input type as CommaDelimitedList, instead of a base string. We also provide the parameter SnsTopicName, which the template substitutes into the TopicArn property.

See the following code:

AWSTemplateFormatVersion: 2010-09-09
Description: Enable Amazon DevOps Guru

Parameters:
  CfnStackNames:
    Type: CommaDelimitedList
    Description: Comma separated names of the CloudFormation Stacks for DevOps Guru to analyze.
    Default: "*"

  SnsTopicName:
    Type: String
    Description: Name of SNS Topic

Resources:
  DevOpsGuruMonitoring:
    Type: AWS::DevOpsGuru::ResourceCollection
    Properties:
      ResourceCollectionFilter:
        CloudFormation:
          StackNames: !Ref CfnStackNames

  DevOpsGuruNotification:
    Type: AWS::DevOpsGuru::NotificationChannel
    Properties:
      Config:
        Sns:
          TopicArn: !Sub arn:aws:sns:${AWS::Region}:${AWS::AccountId}:${SnsTopicName}


Now that we reviewed the CloudFormation syntax, we will use this template to implement the solution. For this post, we will consider three use cases for enabling Amazon DevOps Guru:

(i) For all resources across multiple accounts and Regions

(ii) For all resources from specific CloudFormation stacks across multiple accounts and Regions

(iii) For all resources in an organization

Let us review each of the above points in detail.

(i) Enabling DevOps Guru for all resources across multiple accounts and Regions

Note: Carry out the following steps in your primary AWS account.

You can use the CloudFormation template (EnableDevOpsGuruForAccount.yml) from the current directory, create a stack set, and then instantiate AWS CloudFormation StackSets instances across desired accounts and Regions.

The following command creates the stack set:

aws cloudformation create-stack-set \
--stack-set-name EnableDevOpsGuruForAccount \
--template-body file:///$PWD/EnableDevOpsGuruForAccount.yml \
--parameters ParameterKey=CfnStackNames,ParameterValue=* \
ParameterKey=SnsTopicName,ParameterValue=devops-guru \
--region us-east-1

The following command instantiates AWS CloudFormation StackSets instances across multiple accounts and Regions:

aws cloudformation create-stack-instances \
--stack-set-name EnableDevOpsGuruForAccount \
--accounts '["111111111111","222222222222"]' \
--regions '["us-east-1","us-east-2"]' \
--operation-preferences FailureToleranceCount=0,MaxConcurrentCount=1


The following screenshot of the AWS CloudFormation console in the primary account running StackSet, shows the stack set deployed in both accounts.

Figure: Screenshot for deployed StackSet and Stack instances

Figure: Screenshot for deployed StackSet and Stack instances


The following screenshot of the Amazon DevOps Guru console shows DevOps Guru is enabled to monitor all CloudFormation stacks.

Figure: Screenshot of DevOps Guru dashboard showing DevOps Guru enabled for all CloudFormation stacks

Figure: Screenshot of DevOps Guru dashboard showing DevOps Guru enabled for all CloudFormation stacks


(ii) Enabling DevOps Guru for specific CloudFormation stacks for individual accounts

Note: Carry out the following steps in your primary AWS account

In this use case, we want to enable Amazon DevOps Guru only for specific CloudFormation stacks for individual accounts. We use the AWS CloudFormation StackSets override parameters feature to rerun the stack set with specific values for CloudFormation stack names as parameter inputs. For more information, see Override parameters on stack instances.

If you haven’t created the stack instances for individual accounts, use the create-stack-instances AWS CLI command and pass the parameter overrides. If you have already created stack instances, update the existing stack instances using update-stack-instances and pass the parameter overrides. Replace the required account number, Regions, and stack names as needed.

In account 111111111111, create instances with the parameter override with the following command, where CloudFormation stacks STACK-NAME-1 and STACK-NAME-2 belong to this account in us-east-1 Region:

aws cloudformation create-stack-instances \
--stack-set-name  EnableDevOpsGuruForAccount \
--accounts '["111111111111"]' \
--parameter-overrides ParameterKey=CfnStackNames,ParameterValue=\"<STACK-NAME-1>,<STACK-NAME-2>\" \
--regions '["us-east-1"]' \
--operation-preferences FailureToleranceCount=0,MaxConcurrentCount=1

Update the instances with the following command:

aws cloudformation update-stack-instances \
--stack-set-name EnableDevOpsGuruForAccount \
--accounts '["111111111111"]' \
--parameter-overrides ParameterKey=CfnStackNames,ParameterValue=\"<STACK-NAME-1>,<STACK-NAME-2>\" \
--regions '["us-east-1"]' \
--operation-preferences FailureToleranceCount=0,MaxConcurrentCount=1


In account 222222222222, create instances with the parameter override with the following command, where CloudFormation stacks STACK-NAME-A and STACK-NAME-B belong to this account in the us-east-1 Region:

aws cloudformation create-stack-instances \
--stack-set-name  EnableDevOpsGuruForAccount \
--accounts '["222222222222"]' \
--parameter-overrides ParameterKey=CfnStackNames,ParameterValue=\"<STACK-NAME-A>,<STACK-NAME-B>\" \
--regions '["us-east-1"]' \
--operation-preferences FailureToleranceCount=0,MaxConcurrentCount=1

Update the instances with the following command:

aws cloudformation update-stack-instances \
--stack-set-name EnableDevOpsGuruForAccount \
--accounts '["222222222222"]' \
--parameter-overrides ParameterKey=CfnStackNames,ParameterValue=\"<STACK-NAME-A>,<STACK-NAME-B>\" \
--regions '["us-east-1"]' \
--operation-preferences FailureToleranceCount=0,MaxConcurrentCount=1


The following screenshot of the DevOps Guru console shows that DevOps Guru is enabled for only two CloudFormation stacks.

Figure: Screenshot of DevOps Guru dashboard showing DevOps Guru enabled for only two CloudFormation stacks

Figure: Screenshot of DevOps Guru dashboard with DevOps Guru enabled for two CloudFormation stacks


(iii) Enabling DevOps Guru for all resources in an organization

Note: Carry out the following steps in your primary AWS account

If you’re using AWS Organizations, you can take advantage of the AWS CloudFormation StackSets feature support for Organizations. This way, you don’t need to add or remove stacks when you add or remove accounts from the organization. For more information, see New: Use AWS CloudFormation StackSets for Multiple Accounts in an AWS Organization.

The following example shows the command line using multiple Regions to demonstrate the use. Update the OU as needed. If you need to use additional Regions, you may have to create an SNS topic in those Regions too.

To create a stack set for an OU and across multiple Regions, enter the following command:

aws cloudformation create-stack-set \
--stack-set-name EnableDevOpsGuruForAccount \
--template-body file:///$PWD/EnableDevOpsGuruForAccount.yml \
--parameters ParameterKey=CfnStackNames,ParameterValue=* \
ParameterKey=SnsTopicName,ParameterValue=devops-guru \
--region us-east-1 \
--permission-model SERVICE_MANAGED \
--auto-deployment Enabled=true,RetainStacksOnAccountRemoval=true

Instantiate AWS CloudFormation StackSets instances for an OU and across multiple Regions with the following command:

aws cloudformation create-stack-instances \
--stack-set-name  EnableDevOpsGuruForAccount \
--deployment-targets OrganizationalUnitIds='["<organizational-unit-id>"]' \
--regions '["us-east-1","us-east-2"]' \
--operation-preferences FailureToleranceCount=0,MaxConcurrentCount=1

In this way, you can run CloudFormation StackSets to enable and configure DevOps Guru across multiple accounts, Regions, with simple and easy steps.


Reviewing DevOps Guru insights

Amazon DevOps Guru monitors for anomalies in the resources in the CloudFormation stacks that are enabled for monitoring. The following screenshot shows the initial dashboard.

Figure: Screenshot of DevOps Guru dashboard

Figure: Screenshot of DevOps Guru dashboard

On enabling DevOps Guru, it may take up to 24 hours to analyze the resources and baseline the normal behavior. When it detects an anomaly, it highlights the impacted CloudFormation stack, logs insights that provide details about the metrics indicating an anomaly, and prints actionable recommendations to mitigate the anomaly.

Figure: Screenshot of DevOps Guru dashboard showing ongoing reactive insight

Figure: Screenshot of DevOps Guru dashboard showing ongoing reactive insight

The following screenshot shows an example of an insight (which now has been resolved) that was generated for the increased latency for an ELB. The insight provides various sections in which it provides details about the metrics, the graphed anomaly along with the time duration, potential related events, and recommendations to mitigate and implement preventive measures.

Figure: Screenshot for an Insight generated about ELB Latency

Figure: Screenshot for an Insight generated about ELB Latency


Cleaning up

When you’re finished walking through this post, you should clean up or un-provision the resources to avoid incurring any further charges.

  1. On the AWS CloudFormation StackSets console, choose the stack set to delete.
  2. On the Actions menu, choose Delete stacks from StackSets.
  3. After you delete the stacks from individual accounts, delete the stack set by choosing Delete StackSet.
  4. Un-provision the environment for AWS Cloud9.


Conclusion

This post reviewed how to enable Amazon DevOps Guru using AWS CloudFormation StackSets across multiple AWS accounts or organizations to monitor the resources in existing CloudFormation stacks. Upon detecting an anomaly, DevOps Guru generates an insight that includes the vended CloudWatch metric, the CloudFormation stack in which the resource existed, and actionable recommendations.

We hope this post was useful to you to onboard DevOps Guru and that you try using it for your production needs.


About the Authors

Author's profile photo


Nikunj Vaidya is a Sr. Solutions Architect with Amazon Web Services, focusing in the area of DevOps services. He builds technical content for the field enablement and offers technical guidance to the customers on AWS DevOps solutions and services that would streamline the application development process, accelerate application delivery, and enable maintaining a high bar of software quality.


Nuatu Tseggai is a Cloud Infrastructure Architect at Amazon Web Services. He enjoys working with customers to design and build event-driven distributed systems that span multiple services.


Field Notes: Managing an Amazon EKS Cluster Using AWS CDK and Cloud Resource Property Manager

Post Syndicated from Raj Seshadri original https://aws.amazon.com/blogs/architecture/field-notes-managing-an-amazon-eks-cluster-using-aws-cdk-and-cloud-resource-property-manager/

This post is contributed by Bill Kerr and Raj Seshadri

For most customers, infrastructure is hardly done with CI/CD in mind. However, Infrastructure as Code (IaC) should be a best practice for DevOps professionals when they provision cloud-native assets. Microservice apps that run inside an Amazon EKS cluster often use CI/CD, so why not the cluster and related cloud infrastructure as well?

This blog demonstrates how to spin up cluster infrastructure managed by CI/CD using CDK code and Cloud Resource Property Manager (CRPM) property files. Managing cloud resources is ultimately about managing properties, such as instance type, cluster version, etc. CRPM helps you organize all those properties by importing bite-sized YAML files, which are stitched together with CDK. It keeps all of what’s good about YAML in YAML, and places all of the logic in beautiful CDK code. Ultimately this improves productivity and reliability as it eliminates manual configuration steps.

Architecture Overview

In this architecture, we create a six node Amazon EKS cluster. The Amazon EKS cluster has a node group spanning private subnets across two Availability Zones. There are two public subnets in different Availability Zones available for use with an Elastic Load Balancer.

EKS architecture diagram

Changes to the primary (master) branch triggers a pipeline, which creates CloudFormation change sets for an Amazon EKS stack and a CI/CD stack. After human approval, the change sets are initiated (executed).

CloudFormation sets

Prerequisites

Get ready to deploy the CloudFormation stacks with CDK

First, to get started with CDK you spin up a AWS Cloud9 environment, which gives you a code editor and terminal that runs in a web browser. Using AWS Cloud9 is optional but highly recommended since it speeds up the process.

Create a new AWS Cloud9 environment

  1. Navigate to Cloud9 in the AWS Management Console.
  2. Select Create environment.
  3. Enter a name and select Next step.
  4. Leave the default settings and select Next step again.
  5. Select Create environment.

Download and install the dependencies and demo CDK application

In a terminal, let’s review the code used in this article and install it.

# Install TypeScript globally for CDK
npm i -g typescript

# If you are running these commands in Cloud9 or already have CDK installed, then
skip this command
npm i -g aws-cdk

# Clone the demo CDK application code
git clone https://github.com/shi/crpm-eks

# Change directory
cd crpm-eks

# Install the CDK application
npm i

Create the IAM service role

When creating an EKS cluster, the IAM role that was used to create the cluster is also the role that will be able to access it afterwards.

Deploy the CloudFormation stack containing the role

Let’s deploy a CloudFormation stack containing a role that will later be used to create the cluster and also to access it. While we’re at it, let’s also add our current user ARN to the role, so that we can assume the role.

# Deploy the EKS management role CloudFormation stack
cdk deploy role --parameters AwsArn=$(aws sts get-caller-identity --query Arn --output text)

# It will ask, "Do you wish to deploy these changes (y/n)?"
# Enter y and then press enter to continue deploying

Notice the Outputs section that shows up in the CDK deploy results, which contains the role name and the role ARN. You will need to copy and paste the role ARN (ex. arn:aws:iam::123456789012:role/eks-role-us-east-
1) from your Outputs when deploying the next stack.

Example Outputs:
role.ExportsOutputRefRoleFF41A16F = eks-role-us-east-1
role.ExportsOutputFnGetAttRoleArnED52E3F8 = arn:aws:iam::123456789012:role/eksrole-us-east-1

Create the EKS cluster

Now that we have a role created, it’s time to create the cluster using that role.

Deploy the stack containing the EKS cluster in a new VPC

Expect it to take over 20 minutes for this stack to deploy.

# Deploy the EKS cluster CloudFormation stack
# REPLACE ROLE_ARN WITH ROLE ARN FROM OUTPUTS IN ROLE STACK CREATED ABOVE
cdk deploy eks -r ROLE_ARN

# It will ask, "Do you wish to deploy these changes (y/n)?"
# Enter y and then press enter to continue deploying

Notice the Outputs section, which contains the cluster name (ex. eks-demo) and the UpdateKubeConfigCommand. The UpdateKubeConfigCommand is useful if you already have kubectl installed somewhere and would rather use your own to interact with the cluster instead of using Cloud9’s.

Example Outputs:
eks.ExportsOutputRefControlPlane70FAD3FA = eks-demo
eks.UpdateKubeConfigCommand = aws eks update-kubeconfig --name eks-demo --region
us-east-1 --role-arn arn:aws:iam::123456789012:role/eks-role-us-east-1
eks.FargatePodExecutionRoleArn = arn:aws:iam::123456789012:role/eks-cluster-
FargatePodExecutionRole-U495K4DHW93M

Navigate to this page in the AWS console if you would like to see your cluster, which is now ready to use.

Configure kubectl with access to cluster

If you are following along in Cloud9, you can skip configuring kubectl.

If you prefer to use kubectl installed somewhere else, now would be a good time to configure access to the newly created cluster by running the UpdateKubeConfigCommand mentioned in the Outputs section above. It requires that you have the AWS CLI installed and configured.

aws eks update-kubeconfig --name eks-demo --region us-east-1 --role-arn
arn:aws:iam::123456789012:role/eks-role-us-east-1

# Test access to cluster
kubectl get nodes

Leveraging Infrastructure CI/CD

Now that the VPC and cluster have been created, it’s time to turn on CI/CD. This will create a cloned copy of github.com/shi/crpm-eks in CodeCommit. Then, an AWS CloudWatch Events rule will start watching the CodeCommit repo for changes and triggering a CI/CD pipeline that builds and validates CloudFormation templates, and executes CloudFormation change sets.

Deploy the stack containing the code repo and pipeline

# Deploy the CI/CD CloudFormation stack
cdk deploy cicd

# It will ask, "Do you wish to deploy these changes (y/n)?"
# Enter y and then press enter to continue deploying

Notice the Outputs section, which contains the CodeCommit repo name (ex. eks-ci-cd). This is where the code now lives that is being watched for changes.

Example Outputs:
cicd.ExportsOutputFnGetAttLambdaRoleArn275A39EB =
arn:aws:iam::774461968944:role/eks-ci-cd-LambdaRole-6PFYXVSLTQ0D
cicd.ExportsOutputFnGetAttRepositoryNameC88C868A = eks-ci-cd

Review the pipeline for the first time

Navigate to this page in the AWS console and you should see a new pipeline in progress. The pipeline is automatically run for the first time when it is created, even though no changes have been made yet. Open the pipeline and scroll down to the Review stage. You’ll see that two change sets were created in parallel (one for the EKS stack and the other for the CI/CD stack).

CICD image

  • Select Review to open an approval popup where you can enter a comment.
  • Select Reject or Approve. Following the Review button, the blue link to the left of Fetch: Initial commit by AWS CodeCommit can be selected to see the infrastructure code changes that triggered the pipeline.

review screen

Go ahead and approve it.

Clone the new AWS CodeCommit repo

Now that the golden source that is being watched for changes lives in a AWS CodeCommit repo, we need to clone that repo and get rid of the repo we’ve been using up to this point.

If you are following along in AWS Cloud9, you can skip cloning the new repo because you are just going to discard the old AWS Cloud9 environment and start using a new one.

Now would be a good time to clone the newly created repo mentioned in the preceding Outputs section Next, delete the old repo that was cloned from GitHub at the beginning of this blog. You can visit this repository to get the clone URL for the repo.

Review this documentation for help with accessing your private AWS CodeCommit repo using HTTPS.

Review this documentation for help with accessing your repo using SSH.

# Clone the CDK application code (this URL assumes the us-east-1 region)
git clone https://git-codecommit.us-east-1.amazonaws.com/v1/repos/eks-ci-cd

# Change directory
cd eks-ci-cd

# Install the CDK application
npm i

# Remove the old repo
rm -rf ../crpm-eks

Deploy the stack containing the Cloud9 IDE with kubectl and CodeCommit repo

If you are NOT using Cloud9, you can skip this section.

To make life easy, let’s create another Cloud9 environment that has kubectl preconfigured and ready to use, and also has the new CodeCommit repo checked out and ready to edit.

# Deploy the IDE CloudFormation stack
cdk deploy ide

Configuring the new Cloud9 environment

Although kubectl and the code are now ready to use, we still have to manually configure Cloud9 to stop using AWS managed temporary credentials in order for kubectl to be able to access the cluster with the management role. Here’s how to do that and test kubectl:

1. Navigate to this page in the AWS console.
2. In Your environments, select Open IDE for the newly created environment (possibly named eks-ide).
3. Once opened, navigate at the top to AWS Cloud9 -> Preferences.
4. Expand AWS SETTINGS, and under Credentials, disable AWS managed temporary credentials by selecting the toggle button. Then, close the Preferences tab.
5. In a terminal in Cloud9, enter aws configure. Then, answer the questions by leaving them set to None and pressing enter, except for Default region name. Set the Default region name to the current region that you created everything in. The output should look similar to:

AWS Access Key ID [None]:
AWS Secret Access Key [None]:
Default region name [None]: us-east-1
Default output format [None]:

6. Test the environment

kubectl get nodes

If everything is working properly, you should see two nodes appear in the output similar to:

NAME                           STATUS ROLES  AGE   VERSION
ip-192-168-102-69.ec2.internal Ready  <none> 4h50m v1.17.11-ekscfdc40
ip-192-168-69-2.ec2.internal   Ready  <none> 4h50m v1.17.11-ekscfdc40

You can use kubectl from this IDE to control the cluster. When you close the IDE browser window, the Cloud9 environment will automatically shutdown after 30 minutes and remain offline until the next time you reopen it from the AWS console. So, it’s a cheap way to have a kubectl terminal ready when needed.

Delete the old Cloud9 environment

If you have been following along using Cloud9 the whole time, then you should have two Cloud9 environments running at this point (one that was used to initially create everything from code in GitHub, and one that is now ready to edit the CodeCommit repo and control the cluster with kubectl). It’s now a good time to delete the old Cloud9 environment.

  1. Navigate to this page in the AWS console.
  2. In Your environments, select the radio button for the old environment (you named it when creating it) and select Delete.
  3. In the popup, enter the word Delete and select Delete.

Now you should be down to having just one AWS Cloud9 environment that was created when you deployed the ide stack.

Trigger the pipeline to change the infrastructure

Now that we have a cluster up and running that’s defined in code stored in a AWS CodeCommit repo, it’s time to make some changes:

  • We’ll commit and push the changes, which will trigger the pipeline to update the infrastructure.
  • We’ll go ahead and make one change to the cluster nodegroup and another change to the actual CI/CD build process, so that both the eks-cluster stack as well as the eks-ci-cd stack get changed.

1.     In the code that was checked out from AWS CodeCommit, open up res/compute/eks/nodegroup/props.yaml. At the bottom of the file, try changing minSize from 1 to 4, desiredSize from 2 to 6, and maxSize from 3 to 6 as seen in the following screenshot. Then, save the file and close it. The res (resource) directory is your well organized collection of resource properties files.

AWS Cloud9 screenshot

2.     Next, open up res/developer-tools/codebuild/project/props.yaml and find where it contains computeType: ‘BUILD_GENERAL1_SMALL’. Try changing BUILD_GENERAL1_SMALL to BUILD_GENERAL1_MEDIUM. Then, save the file and close it.

3.     Commit and push the changes in a terminal.

cd eks-ci-cd
git add .
git commit -m "Increase nodegroup scaling config sizes and use larger build
environment"
git push

4.     Visit https://console.aws.amazon.com/codesuite/codepipeline/pipelines in the AWS console and you should see your pipeline in progress.

5.     Wait for the Review stage to become Pending.

a.       Following the Approve action box, click the blue link to the left of “Fetch: …” to see the infrastructure code changes that triggered the pipeline. You should see the two code changes you committed above.

3.     After reviewing the changes, go back and select Review to open an approval popup.

4.     In the approval popup, enter a comment and select Approve.

5.     Wait for the pipeline to finish the Deploy stage as it executes the two change sets. You can refresh the page until you see it has finished. It should take a few minutes.

6.     To see that the CodeBuild change has been made, scroll up to the Build stage of the pipeline and click on the AWS CodeBuild link as shown in the following screenshot.

AWS Codebuild screenshot

7.     Next,  select the Build details tab, and you should determine that your Compute size has been upgraded to 7 GB memory, 4 vCPUs as shown in the following screenshot.

project config


8.     By this time, the cluster nodegroup sizes are probably updated. You can confirm with kubectl in a terminal.

# Get nodes
kubectl get nodes

If everything is ready, you should see six (desired size) nodes appear in the output similar to:

NAME                            STATUS   ROLES     AGE     VERSION
ip-192-168-102-69.ec2.internal  Ready    <none>    5h42m   v1.17.11-ekscfdc40
ip-192-168-69-2.ec2.internal    Ready    <none>    5h42m   v1.17.11-ekscfdc40
ip-192-168-43-7.ec2.internal    Ready    <none>    10m     v1.17.11-ekscfdc40
ip-192-168-27-14.ec2.internal   Ready    <none>    10m     v1.17.11-ekscfdc40
ip-192-168-36-56.ec2.internal   Ready    <none>    10m     v1.17.11-ekscfdc40
ip-192-168-37-27.ec2.internal   Ready    <none>    10m     v1.17.11-ekscfdc40

Cluster is now manageable by code

You now have a cluster than can be maintained by simply making changes to code! The only resources not being managed by CI/CD in this demo, are the management role, and the optional AWS Cloud9 IDE. You can log into the AWS console and edit the role, adding other Trust relationships in the future, so others can assume the role and access the cluster.

Clean up

Do not try to delete all of the stacks at once! Wait for the stack(s) in a step to finish deleting before moving onto the next step.

1. Navigate to this page in the AWS console.
2. Delete the two IDE stacks first (the ide stack spawned another stack).
3. Delete the ci-cd stack.
4. Delete the cluster stack (this one takes a long time).
5. Delete the role stack.

Additional resources

Cloud Resource Property Manager (CRPM) is an open source project maintained by SHI, hosted on GitHub, and available through npm.

Conclusion

In this blog, we demonstrated how you can spin up an Amazon EKS cluster managed by CI/CD using CDK code and Cloud Resource Property Manager (CRPM) property files. Making updates to this cluster is easy as modifying the property files and updating the AWS CodePipline. Using CRPM can improve productivity and reliability because it eliminates manual configurations steps.

Field Notes provides hands-on technical guidance from AWS Solutions Architects, consultants, and technical account managers, based on their experiences in the field solving real-world business problems for customers
Bill Kerr

Bill Kerr

Bill Kerr is a senior developer at Stratascale who has worked at startup and Fortune 500 companies. He’s the creator of CRPM and he’s a super fan of CDK and cloud infrastructure automation.

Creating a cross-region Active Directory domain with AWS Launch Wizard for Microsoft Active Directory

Post Syndicated from AWS Admin original https://aws.amazon.com/blogs/compute/creating-a-cross-region-active-directory-domain-with-aws-launch-wizard-for-microsoft-active-directory/

AWS Launch Wizard is a console-based service to quickly and easily size, configure, and deploy third party applications, such as Microsoft SQL Server Always On and HANA based SAP systems, on AWS without the need to identify and provision individual AWS resources. AWS Launch Wizard offers an easy way to deploy enterprise applications and optimize costs. Instead of selecting and configuring separate infrastructure services, you go through a few steps in the AWS Launch Wizard and it deploys a ready-to-use application on your behalf. It reduces the time you need to spend on investigating how to provision, cost and configure your application on AWS.

You can now use AWS Launch Wizard to deploy and configure self-managed Microsoft Windows Server Active Directory Domain Services running on Amazon Elastic Compute Cloud (EC2) instances. With Launch Wizard, you can have fully-functioning, production-ready domain controllers within a few hours—all without having to manually deploy and configure your resources.

You can use AWS Directory Service to run Microsoft Active Directory (AD) as a managed service, without the hassle of managing your own infrastructure. If you need to run your own AD infrastructure, you can use AWS Launch Wizard to simplify the deployment and configuration process.

In this post, I walk through creation of a cross-region Active Directory domain using Launch Wizard. First, I deploy a single Active Directory domain spanning two regions. Then, I configure Active Directory Sites and Services to match the network topology. Finally, I create a user account to verify replication of the Active Directory domain.

Diagram of Resources deployed in this post

Figure 1: Diagram of resources deployed in this post

Prerequisites

  1. You must have a VPC in your home. Additionally, you must have remote regions that have CIDRs that do not overlap with each other. If you need to create VPCs and subnets that do not overlap, please refer here.
  2. Each subnet used must have outbound internet connectivity. Feel free to either use a NAT Gateway or Internet Gateway.
  3. The VPCs must be peered in order to complete the steps in this post. For information on creating a VPC Peering connection between regions, please refer here.
  4. If you choose to deploy your Domain Controllers to a private subnet, you must have an RDP jump / bastion instance setup to allow you to RDP to your instance.

Deploy Your Domain Controllers in the Home Region using Launch Wizard

In this section, I deploy the first set of domain controllers into the us-east-1 the home region using Launch Wizard. I refer to US-East-1 as the home region, and US-West-2 as the remote region.

  1. In the AWS Launch Wizard Console, select Active Directory in the navigation pane on the left.
  2. Select Create deployment.
  3. In the Review Permissions page, select Next.
  4. In the Configure application settings page set the following:
    • General:
      • Deployment name: UsEast1AD
    • Active Directory (AD) installation
      • Installation type: Active Directory on EC2
    • Domain Settings:
      • Number of domain controllers: 2
      • AMI installation type: License-included AMI
    • License-included AMI: ami-################# | Windows_Server-2019-English-Full-Base-202#-##-##
    • Connection type: Create new Active Directory
    • Domain DNS name: corp.example.com
    • Domain NetBIOS Name: CORP
    • Connectivity:
      • Key Pair Name: Choose and exiting Key pair or select and existing one.
      • Virtual Private Cloud (VPC): Select Virtual Private Cloud (VPC)
    • VPC: Select your home region VPC
    • Availability Zone (AZ) and private subnets:
      • Select 2 Availability Zones
      • Choose the proper subnet in each subnet
      • Assign a Controller IP address for each domain controller
    • Remote Desktop Gateway preferences: Disregard for now, this is set up later.
    • Check the I confirm that a public subnet has been set up. Each of the selected private subnets have outbound connectivity enabled check box.
  1. Select Next.
  2. In the Define infrastructure requirements page, set the following inputs.
    • Storage and compute: Based on infrastructure requirements
    • Number of AD users: Up to 5000 users
  3. Select Next.
  4. In the Review and deploy page, review your selections. Then, select Deploy.

Note that it may take up to 2 hours for your domain to be deployed. Once the status has changed to Completed, you can proceed to the next section. In the next section, I prepare Active Directory Sites and Services for the second set of domain controller in my other region.

Configure Active Directory Sites and Services

In this section, I configure the Active Directory Sites and Services topology to match my network topology. This step ensures proper Active Directory replication routing so that domain clients can find the closest domain controller. For more information on Active Directory Sites and Services, please refer here.

Retrieve your Administrator Credentials from Secrets Manager

  1. From the AWS Secrets Manager Console in us-east-1, select the Secret that begins with LaunchWizard-UsEast1AD.
  2. In the middle of the Secret page, select Retrieve secret value.
    1. This will display the username and password key with their values.
    2. You need these credentials when you RDP into one of the domain controllers in the next steps.

Rename the Default First Site

  1. Log in to the one of the domain controllers in us-east-1.
  2. Select Start, type dssite and hit Enter on your keyboard.
  3. The Active Directory Sites and Services MMC should appear.
    1. Expand Sites. There is a site named Default-First-Site-Name.
    2. Right click on Default-First-Site-Name select Rename.
    3. Enter us-east-1 as the name.
  4. Leave the Active Directory Sites and Services MMC open for the next set of steps.

Create a New Site and Subnet Definition for US-West-2

  1. Using the Active Directory Sites and Services MMC from the previous steps, right click on Sites.
  2. Select New Site… and enter the following inputs:
    • Name: us-west-2
    • Select DEFAULTIPSITELINK.
  3.  Select OK.
  4. A pop up will appear telling you there will need to be some additional configuration. Select OK.
  5. Expand Sites and right click on Subnets and select New Subnet.
  6. Enter the following information:
    • Prefix: the CIDR of your us-west-2 VPC. An example would be 1.0.0/24
    • Site: select us-west-2
  7. Select OK.
  8. Leave the Active Directory Sites and Services MMC open for the following set of steps.

Configure Site Replication Settings

Using the Active Directory Sites and Services MMC from the previous steps, expand Sites, Inter-Site Transports, and select IP. You should see an object named DEFAULTIPSITELINK,

  1. Right click on DEFAULTIPSITELINK.
  2. Select Properties. Set or verify the following inputs on the General tab:
  3. Select Apply.
  4. In the DEFAULTIPSITELINK Properties, select the Attribute Editor tab and modify the following:
    • Scroll down and double click on Enter 1 for the Value, then select OK twice.
      • For more information on these settings, please refer here.
  5. Close the Active Directory Sites and Services MMC, as it is no longer needed.

Prepare Your Home Region Domain Controllers Security Group

In this section, I modify the Domain Controllers Security Group in us-east-1. This allows the domain controllers deployed in us-west-2 to communicate with each other.

  1. From the Amazon Elastic Compute Cloud (Amazon EC2) console, select Security Groups under the Network & Security navigation section.
  2. Select the Domain Controllers Security Group that was created with Launch Wizard Active Directory.
  3. Select Edit inbound rules. The Security Group should start with LaunchWizard-UsEast1AD-.
  4. Choose Add rule and enter the following:
    • Type: Select All traffic
    • Protocol: All
    • Port range: All
    • Source: Select Custom
    • Enter the CIDR of your remote VPC. An example would be 1.0.0/24
  5. Select Save rules.

Create a Copy of Your Administrator Secret in Your Remote Region

In this section, I create a Secret in Secrets Manager that contains the Administrator credentials when I created a home region.

  1. Find the Secret that being with LaunchWizard-UsEast1AD from the AWS Secrets Manager Console in us-east-1.
  2. In the middle of the Secret page, select Retrieve secret value.
    • This displays the username and password key with their values. Make note of these keys and values, as we need them for the next steps.
  3. From the AWS Secrets Manager Console, change the region to us-west-2.
  4. Select Store a new secret. Then, enter the following inputs:
    • Select secret type: Other type of secrets
    • Add your first keypair
    • Select Add row to add the second keypair
  5. Select Next, then enter the following inputs.
    • Secret name: UsWest2AD
    • Select Next twice
    • Select Store

Deploy Your Domain Controllers in the Remote Region using Launch Wizard

In this section, I deploy the second set of domain controllers into the us-west-1 region using Launch Wizard.

  1. In the AWS Launch Wizard Console, select Active Directory in the navigation pane on the left.
  2. Select Create deployment.
  3. In the Review Permissions page, select Next.
  4. In the Configure application settings page, set the following inputs.
    • General
      • Deployment name: UsWest2AD
    • Active Directory (AD) installation
      • Installation type: Active Directory on EC2
    • Domain Settings:
      • Number of domain controllers: 2
      • AMI installation type: License-included AMI
      • License-included AMI: ami-################# | Windows_Server-2019-English-Full-Base-202#-##-##
    • Connection type: Add domain controllers to existing Active Directory
    • Domain DNS name: corp.example.com
    • Domain NetBIOS Name: CORP
    • Domain Administrator secret name: Select you secret you created above.
    • Add permission to secret
      • After you verified the Secret you created above has the policy listed. Check the checkbox confirming the secret has the required policy.
    • Domain DNS IP address for resolution: The private IP of either domain controller in your home region
    • Connectivity:
      • Key Pair Name: Choose an existing Key pair
      • Virtual Private Cloud (VPC): Select Virtual Private Cloud (VPC)
    • VPC: Select your home region VPC
    • Availability Zone (AZ) and private subnets:
      • Select 2 Availability Zones
      • Choose the proper subnet in each subnet
      • Assign a Controller IP address for each domain controller
    • Remote Desktop Gateway preferences: disregard for now, as I set this later.
    • Check the I confirm that a public subnet has been set up. Each of the selected private subnets have outbound connectivity enabled check box
  1. In the Define infrastructure requirements page set the following:
    • Storage and compute: Based on infrastructure requirements
    • Number of AD users: Up to 5000 users
  2. In the Review and deploy page, review your selections. Then, select Deploy.

Note that it may take up to 2 hours to deploy domain controllers. Once the status has changed to Completed, proceed to the next section. In this next section, I prepare Active Directory Sites and Services for the second set of domain controller in another region.

Prepare Your Remote Region Domain Controllers Security Group

In this section, I modify the Domain Controllers Security Group in us-west-2. This allows the domain controllers deployed in us-west-2 to communicate with each other.

  1. From the Amazon Elastic Compute Cloud (Amazon EC2) console, select Security Groups under the Network & Security navigation section.
  2. Select the Domain Controllers Security Group that was created by your Launch Wizard Active Directory.
  3. Select Edit inbound rules. The Security Group should start with LaunchWizard-UsWest2AD-EC2ADStackExistingVPC-
  4. Choose Add rule and enter the following:
    • Type: Select All traffic
    • Protocol: All
    • Port range: All
    • Source: Select Custom
    • Enter the CIDR of your remote VPC. An example would be 0.0.0/24
  5. Choose Save rules.

Create an AD User and Verify Replication

In this section, I create a user in one region and verify that it replicated to the other region. I also use AD replication diagnostics tools to verify that replication is working properly.

Create a Test User Account

  1. Log in to one of the domain controllers in us-east-1.
  2. Select Start, type dsa and press Enter on your keyboard. The Active Directory Users and Computers MMC should appear.
  3. Right click on the Users container and select New > User.
  4. Enter the following inputs:
    • First name: John
    • Last name: Doe
    • User logon name: jdoe and select Next
    • Password and Confirm password: Your choice of complex password
    • Uncheck User must change password at next logon
  5. Select Next.
  6. Select Finish.

Verify Test User Account Has Replicated

  1. Log in to the one of the domain controllers in us-west-2.
  2. Select Start and type dsa.
  3. Then, press Enter on your keyboard. The Active Directory Users and Computers MMC should appear.
  4. Select Users. You should see a user object named John Doe.

Note that if the user is not present, it may not have been replicated yet. Replication should not take longer than 60 seconds from when the item was created.

Summary

Congratulations, you have created a cross-region Active Directory! In this post you:

  1. Launched a new Active Directory forest in us-east-1 using AWS Launch Wizard.
  2. Configured Active Directory Sites and Service for a multi-region configuration.
  3. Launched a set of new domain controllers in the us-west-2 region using AWS Launch Wizard.
  4. Created a test user and verified replication.

This post only touches on a couple of features that are available in the AWS Launch Wizard Active Directory deployment. AWS Launch Wizard also automates the creation of a Single Tier PKI infrastructure or trust creation. One of the prime benefits of this solution is the simplicity in deploying a fully functional Active Directory environment in just a few clicks. You no longer need to do the undifferentiated heavy lifting required to deploy Active Directory.  For more information, please refer to AWS Launch Wizard documentation.

Field Notes: Ingest and Visualize Your Flat-file IoT Data with AWS IoT Services

Post Syndicated from Paul Ramsey original https://aws.amazon.com/blogs/architecture/field-notes-ingest-and-visualize-your-flat-file-iot-data-with-aws-iot-services/

Customers who maintain manufacturing facilities often find it challenging to ingest, centralize, and visualize IoT data that is emitted in flat-file format from their factory equipment. While modern IoT-enabled industrial devices can communicate over standard protocols like MQTT, there are still some legacy devices that generate useful data but are only capable of writing it locally to a flat file. This results in siloed data that is either analyzed in a vacuum without the broader context, or it is not available to business users to be analyzed at all.

AWS provides a suite of IoT and Edge services that can be used to solve this problem. In this blog, I walk you through one method of leveraging these services to ingest hard-to-reach data into the AWS cloud and extract business value from it.

Overview of solution

This solution provides a working example of an edge device running AWS IoT Greengrass with an AWS Lambda function that watches a Samba file share for new .csv files (presumably containing device or assembly line data). When it finds a new file, it will transform it to JSON format and write it to AWS IoT Core. The data is then sent to AWS IoT Analytics for processing and storage, and Amazon QuickSight is used to visualize and gain insights from the data.

Samba file share solution diagram

Since we don’t have an actual on-premises environment to use for this walkthrough, we’ll simulate pieces of it:

  • In place of the legacy factory equipment, an EC2 instance running Windows Server 2019 will generate data in .csv format and write it to the Samba file share.
    • We’re using a Windows Server for this function to demonstrate that the solution is platform-agnostic. As long as the flat file is written to a file share, AWS IoT Greengrass can ingest it.
  • An EC2 instance running Amazon Linux will act as the edge device and will host AWS IoT Greengrass Core and the Samba share.
    • In the real world, these could be two separate devices, and the device running AWS IoT Greengrass could be as small as a Raspberry Pi.

Prerequisites

For this walkthrough, you should have the following prerequisites:

  • An AWS Account
  • Access to provision and delete AWS resources
  • Basic knowledge of Windows and Linux server administration
  • If you’re unfamiliar with AWS IoT Greengrass concepts like Subscriptions and Cores, review the AWS IoT Greengrass documentation for a detailed description.

Walkthrough

First, we’ll show you the steps to launch the AWS IoT Greengrass resources using AWS CloudFormation. The AWS CloudFormation template is derived from the template provided in this blog post. Review the post for a detailed description of the template and its various options.

  1. Create a key pair. This will be used to access the EC2 instances created by the CloudFormation template in the next step.
  2. Launch a new AWS CloudFormation stack in the N. Virginia (us-east-1) Region using iot-cfn.yml, which represents the simulated environment described in the preceding bullet.
    •  Parameters:
      • Name the stack IoTGreengrass.
      • For EC2KeyPairName, select the EC2 key pair you just created from the drop-down menu.
      • For SecurityAccessCIDR, use your public IP with a /32 CIDR (i.e. 1.1.1.1/32).
      • You can also accept the default of 0.0.0.0/0 if you can have SSH and RDP open to all sources on the EC2 instances in this demo environment.
      • Accept the defaults for the remaining parameters.
  •  View the Resources tab after stack creation completes. The stack creates the following resources:
    • A VPC with two subnets, two route tables with routes, an internet gateway, and a security group.
    • Two EC2 instances, one running Amazon Linux and the other running Windows Server 2019.
    • An IAM role, policy, and instance profile for the Amazon Linux instance.
    • A Lambda function called GGSampleFunction, which we’ll update with code to parse our flat-files with AWS IoT Greengrass in a later step.
    • An AWS IoT Greengrass Group, Subscription, and Core.
    • Other supporting objects and custom resource types.
  • View the Outputs tab and copy the IPs somewhere easy to retrieve. You’ll need them for multiple provisioning steps below.

3. Review the AWS IoT Greengrass resources created on your behalf by CloudFormation:

    • Search for IoT Greengrass in the Services drop-down menu and select it.
    • Click Manage your Groups.
    • Click file_ingestion.
    • Navigate through the SubscriptionsCores, and other tabs to review the configurations.

Leveraging a device running AWS IoT Greengrass at the edge, we can now interact with flat-file data that was previously difficult to collect, centralize, aggregate, and analyze.

Set up the Samba file share

Now, we set up the Samba file share where we will write our flat-file data. In our demo environment, we’re creating the file share on the same server that runs the Greengrass software. In the real world, this file share could be hosted elsewhere as long as the device that runs Greengrass can access it via the network.

  • Follow the instructions in setup_file_share.md to set up the Samba file share on the AWS IoT Greengrass EC2 instance.
  • Keep your terminal window open. You’ll need it again for a later step.

Configure Lambda Function for AWS IoT Greengrass

AWS IoT Greengrass provides a Lambda runtime environment for user-defined code that you author in AWS Lambda. Lambda functions that are deployed to an AWS IoT Greengrass Core run in the Core’s local Lambda runtime. In this example, we update the Lambda function created by CloudFormation with code that watches for new files on the Samba share, parses them, and writes the data to an MQTT topic.

  1. Update the Lambda function:
    • Search for Lambda in the Services drop-down menu and select it.
    • Select the file_ingestion_lambda function.
    • From the Function code pane, click Actions then Upload a .zip file.
    • Upload the provided zip file containing the Lambda code.
    • Select Actions > Publish new version > Publish.

2. Update the Lambda Alias to point to the new version.

    • Select the Version: X drop-down (“X” being the latest version number).
    • Choose the Aliases tab and select gg_file_ingestion.
    • Scroll down to Alias configuration and select Edit.
    • Choose the newest version number and click Save.
    • Do NOT use $LATEST as it is not supported by AWS IoT Greengrass.

3. Associate the Lambda function with AWS IoT Greengrass.

    • Search for IoT Greengrass in the Services drop-down menu and select it.
    • Select Groups and choose file_ingestion.
    • Select Lambdas > Add Lambda.
    • Click Use existing Lambda.
    • Select file_ingestion_lambda > Next.
    • Select Alias: gg_file_ingestion > Finish.
    • You should now see your Lambda associated with the AWS IoT Greengrass group.
    • Still on the Lambda function tab, click the ellipsis and choose Edit configuration.
    • Change the following Lambda settings then click Update:
      • Set Containerization to No container (always).
      • Set Timeout to 25 seconds (or longer if you have large files to process).
      • Set Lambda lifecycle to Make this function long-lived and keep it running indefinitely.

Deploy AWS IoT Greengrass Group

  1. Restart the AWS IoT Greengrass daemon:
    • A daemon restart is required after changing containerization settings. Run the following commands on the Greengrass instance to restart the AWS IoT Greengrass daemon:
 cd /greengrass/ggc/core/

 sudo ./greengrassd stop

 sudo ./greengrassd start

2. Deploy the AWS IoT Greengrass Group to the Core device.

    • Return to the file_ingestion AWS IoT Greengrass Group in the console.
    • Select Actions Deploy.
    • Select Automatic detection.
    • After a few minutes, you should see a Status of Successfully completed. If the deployment fails, check the logs, fix the issues, and deploy again.

Generate test data

You can now generate test data that is ingested by AWS IoT Greengrass, written to AWS IoT Core, and then sent to AWS IoT Analytics and visualized by Amazon QuickSight.

  1. Follow the instructions in generate_test_data.md to generate the test data.
  2. Verify that the data is being written to AWS IoT Core following these instructions (Use iot/data for the MQTT Subscription Topic instead of hello/world).

screenshot

Setup AWS IoT Analytics

Now that our data is in IoT Cloud, it only takes a few clicks to configure AWS IoT Analytics to process, store, and analyze our data.

  1. Search for IoT Analytics in the Services drop-down menu and select it.
  2. Set Resources prefix to file_ingestion and Topic to iot/data. Click Quick Create.
  3. Populate the data set by selecting Data sets > file_ingestion_dataset >Actions > Run now. If you don’t get data on the first run, you may need to wait a couple of minutes and run it again.

Visualize the Data from AWS IoT Analytics in Amazon QuickSight

We can now use Amazon QuickSight to visualize the IoT data in our AWS IoT Analytics data set.

  1. Search for QuickSight in the Services drop-down menu and select it.
  2. If your account is not signed up for QuickSight yet, follow these instructions to sign up (use Standard Edition for this demo)
  3. Build a new report:
    • Click New analysis > New dataset.
    • Select AWS IoT Analytics.
    • Set Data source name to iot-file-ingestion and select file_ingestion_dataset. Click Create data source.
    • Click Visualize. Wait a moment while your rows are imported into SPICE.
    • You can now drag and drop data fields onto field wells. Review the QuickSight documentation for detailed instructions on creating visuals.
    • Following is an example of a QuickSight dashboard you can build using the demo data we generated in this walkthrough.

Cleaning up

Be sure to clean up the objects you created to avoid ongoing charges to your account.

  • In Amazon QuickSight, Cancel your subscription.
  • In AWS IoT Analytics, delete the datastore, channel, pipeline, data set, role, and topic rule you created.
  • In CloudFormation, delete the IoTGreengrass stack.
  • In Amazon CloudWatch, delete the log files associated with this solution.

Conclusion

Gaining valuable insights from device data that was once out of reach is now possible thanks to AWS’s suite of IoT services. In this walkthrough, we collected and transformed flat-file data at the edge and sent it to IoT Cloud using AWS IoT Greengrass. We then used AWS IoT Analytics to process, store, and analyze that data, and we built an intelligent dashboard to visualize and gain insights from the data using Amazon QuickSight. You can use this data to discover operational anomalies, enable better compliance reporting, monitor product quality, and many other use cases.

For more information on AWS IoT services, check out the overviews, use cases, and case studies on our product page. If you’re new to IoT concepts, I’d highly encourage you to take our free Internet of Things Foundation Series training.

Field Notes provides hands-on technical guidance from AWS Solutions Architects, consultants, and technical account managers, based on their experiences in the field solving real-world business problems for customers.

Raising code quality for Python applications using Amazon CodeGuru

Post Syndicated from Ran Fu original https://aws.amazon.com/blogs/devops/raising-code-quality-for-python-applications-using-amazon-codeguru/

We are pleased to announce the launch of Python support for Amazon CodeGuru, a service for automated code reviews and application performance recommendations. CodeGuru is powered by program analysis and machine learning, and trained on best practices and hard-learned lessons across millions of code reviews and thousands of applications profiled on open-source projects and internally at Amazon.

Amazon CodeGuru has two services:

  • Amazon CodeGuru Reviewer – Helps you improve source code quality by detecting hard-to-find defects during application development and recommending how to remediate them.
  • Amazon CodeGuru Profiler – Helps you find the most expensive lines of code, helps reduce your infrastructure cost, and fine-tunes your application performance.

The launch of Python support extends CodeGuru beyond its original Java support. Python is a widely used language for various use cases, including web app development and DevOps. Python’s growth in data analysis and machine learning areas is driven by its rich frameworks and libraries. In this post, we discuss how to use CodeGuru Reviewer and Profiler to improve your code quality for Python applications.

CodeGuru Reviewer for Python

CodeGuru Reviewer now allows you to analyze your Python code through pull requests and full repository analysis. For more information, see Automating code reviews and application profiling with Amazon CodeGuru. We analyzed large code corpuses and Python documentation to source hard-to-find coding issues and trained our detectors to provide best practice recommendations. We expect such recommendations to benefit beginners as well as expert Python programmers.

CodeGuru Reviewer generates recommendations in the following categories:

  • AWS SDK APIs best practices
  • Data structures and control flow, including exception handling
  • Resource leaks
  • Secure coding practices to protect from potential shell injections

In the following sections, we provide real-world examples of bugs that can be detected in each of the categories:

AWS SDK API best practices

AWS has hundreds of services and thousands of APIs. Developers can now benefit from CodeGuru Reviewer recommendations related to AWS APIs. AWS recommendations in CodeGuru Reviewer cover a wide range of scenarios such as detecting outdated or deprecated APIs, warning about API misuse, authentication and exception scenarios, and efficient API alternatives.

Consider the pagination trait, implemented by over 1,000 APIs from more than 150 AWS services. The trait is commonly used when the response object is too large to return in a single response. To get the complete set of results, iterated calls to the API are required, until the last page is reached. If developers were not aware of this, they would write the code as the following (this example is patterned after actual code):

def sync_ddb_table(source_ddb, destination_ddb):
    response = source_ddb.scan(TableName=“table1”)
    for item in response['Items']:
        ...
        destination_ddb.put_item(TableName=“table2”, Item=item)
    …   

Here the scan API is used to read items from one Amazon DynamoDB table and the put_item API to save them to another DynamoDB table. The scan API implements the Pagination trait. However, the developer missed iterating on the results beyond the first scan, leading to only partial copying of data.

The following screenshot shows what CodeGuru Reviewer recommends:

The following screenshot shows CodeGuru Reviewer recommends on the need for pagination

The developer fixed the code based on this recommendation and added complete handling of paginated results by checking the LastEvaluatedKey value in the response object of the paginated API scan as follows:

def sync_ddb_table(source_ddb, destination_ddb):
    response = source_ddb.scan(TableName==“table1”)
    for item in response['Items']:
        ...
        destination_ddb.put_item(TableName=“table2”, Item=item)
    # Keeps scanning util LastEvaluatedKey is null
    while "LastEvaluatedKey" in response:
        response = source_ddb.scan(
            TableName="table1",
            ExclusiveStartKey=response["LastEvaluatedKey"]
        )
        for item in response['Items']:
            destination_ddb.put_item(TableName=“table2”, Item=item)
    …   

CodeGuru Reviewer recommendation is rich and offers multiple options for implementing Paginated scan. We can also initialize the ExclusiveStartKey value to None and iteratively update it based on the LastEvaluatedKey value obtained from the scan response object in a loop. This fix below conforms to the usage mentioned in the official documentation.

def sync_ddb_table(source_ddb, destination_ddb):
    table = source_ddb.Table(“table1”)
    scan_kwargs = {
                  …
    }
    done = False
    start_key = None
    while not done:
        if start_key:
            scan_kwargs['ExclusiveStartKey'] = start_key
        response = table.scan(**scan_kwargs)
        for item in response['Items']:
            destination_ddb.put_item(TableName=“table2”, Item=item)
        start_key = response.get('LastEvaluatedKey', None)
        done = start_key is None

Data structures and control flow

Python’s coding style is different from other languages. For code that does not conform to Python idioms, CodeGuru Reviewer provides a variety of suggestions for efficient and correct handling of data structures and control flow in the Python 3 standard library:

  • Using DefaultDict for compact handling of missing dictionary keys over using the setDefault() API or dealing with KeyError exception
  • Using a subprocess module over outdated APIs for subprocess handling
  • Detecting improper exception handling such as catching and passing generic exceptions that can hide latent issues.
  • Detecting simultaneous iteration and modification to loops that might lead to unexpected bugs because the iterator expression is only evaluated one time and does not account for subsequent index changes.

The following code is a specific example that can confuse novice developers.

def list_sns(region, creds, sns_topics=[]):
    sns = boto_session('sns', creds, region)
    response = sns.list_topics()
    for topic_arn in response["Topics"]:
        sns_topics.append(topic_arn["TopicArn"])
    return sns_topics
  
def process():
    ...
    for region, creds in jobs["auth_config"]:
        arns = list_sns(region, creds)
        ... 

The process() method iterates over different AWS Regions and collects Regional ARNs by calling the list_sns() method. The developer might expect that each call to list_sns() with a Region parameter returns only the corresponding Regional ARNs. However, the preceding code actually leaks the ARNs from prior calls to subsequent Regions. This happens due to an idiosyncrasy of Python relating to the use of mutable objects as default argument values. Python default value are created exactly one time, and if that object is mutated, subsequent references to the object refer to the mutated value instead of re-initialization.

The following screenshot shows what CodeGuru Reviewer recommends:

The following screenshot shows CodeGuru Reviewer recommends about initializing a value for mutable objects

The developer accepted the recommendation and issued the below fix.

def list_sns(region, creds, sns_topics=None):
    sns = boto_session('sns', creds, region)
    response = sns.list_topics()
    if sns_topics is None: 
        sns_topics = [] 
    for topic_arn in response["Topics"]:
        sns_topics.append(topic_arn["TopicArn"])
    return sns_topics

Resource leaks

A Pythonic practice for resource handling is using Context Managers. Our analysis shows that resource leaks are rampant in Python code where a developer may open external files or windows and forget to close them eventually. A resource leak can slow down or crash your system. Even if a resource is closed, using Context Managers is Pythonic. For example, CodeGuru Reviewer detects resource leaks in the following code:

def read_lines(file):
    lines = []
    f = open(file, ‘r’)
    for line in f:
        lines.append(line.strip(‘\n’).strip(‘\r\n’))
    return lines

The following screenshot shows that CodeGuru Reviewer recommends that the developer either use the ContextLib with statement or use a try-finally block to explicitly close a resource.

The following screenshot shows CodeGuru Reviewer recommend about fixing the potential resource leak

The developer accepted the recommendation and fixed the code as shown below.

def read_lines(file):
    lines = []
    with open(file, ‘r’) as f: 
        for line in f:
            lines.append(line.strip(‘\n’).strip(‘\r\n’))
    return lines

Secure coding practices

Python is often used for scripting. An integral part of such scripts is the use of subprocesses. As of this writing, CodeGuru Reviewer makes a limited, but important set of recommendations to make sure that your use of eval functions or subprocesses is secure from potential shell injections. It issues a warning if it detects that the command used in eval or subprocess scenarios might be influenced by external factors. For example, see the following code:

def execute(cmd):
    try:
        retcode = subprocess.call(cmd, shell=True)
        ...
    except OSError as e:
        ...

The following screenshot shows the CodeGuru Reviewer recommendation:

The following screenshot shows CodeGuru Reviewer recommends about potential shell injection vulnerability

The developer accepted this recommendation and made the following fix.

def execute(cmd):
    try:
        retcode = subprocess.call(shlex.quote(cmd), shell=True)
        ...
    except OSError as e:
        ...

As shown in the preceding recommendations, not only are the code issues detected, but a detailed recommendation is also provided on how to fix the issues, along with a link to the Python official documentation. You can provide feedback on recommendations in the CodeGuru Reviewer console or by commenting on the code in a pull request. This feedback helps improve the performance of Reviewer so that the recommendations you see get better over time.

Now let’s take a look at CodeGuru Profiler.

CodeGuru Profiler for Python

Amazon CodeGuru Profiler analyzes your application’s performance characteristics and provides interactive visualizations to show you where your application spends its time. These visualizations a. k. a. flame graphs are a powerful tool to help you troubleshoot which code methods have high latency or are over utilizing your CPU.

Thanks to the new Python agent, you can now use CodeGuru Profiler on your Python applications to investigate performance issues.

The following list summarizes the supported versions as of this writing.

  • AWS Lambda functions: Python3.8, Python3.7, Python3.6
  • Other environments: Python3.9, Python3.8, Python3.7, Python3.6

Onboarding your Python application

For this post, let’s assume you have a Python application running on Amazon Elastic Compute Cloud (Amazon EC2) hosts that you want to profile. To onboard your Python application, complete the following steps:

1. Create a new profiling group in CodeGuru Profiler console called ProfilingGroupForMyApplication. Give access to your Amazon EC2 execution role to submit to this profiling group. See the documentation for details about how to create a Profiling Group.

2. Install the codeguru_profiler_agent module:

pip3 install codeguru_profiler_agent

3. Start the profiler in your application.

An easy way to profile your application is to start your script through the codeguru_profiler_agent module. If you have an app.py script, use the following code:

python -m codeguru_profiler_agent -p ProfilingGroupForMyApplication app.py

Alternatively, you can start the agent manually inside the code. This must be done only one time, preferably in your startup code:

from codeguru_profiler_agent import Profiler

if __name__ == "__main__":
     Profiler(profiling_group_name='ProfilingGroupForMyApplication')
     start_application()    # your code in there....

Onboarding your Python Lambda function

Onboarding for an AWS Lambda function is quite similar.

  1. Create a profiling group called ProfilingGroupForMyLambdaFunction, this time we select “Lambda” for the compute platform. Give access to your Lambda function role to submit to this profiling group. See the documentation for details about how to create a Profiling Group.
  2. Include the codeguru_profiler_agent module in your Lambda function code.
  3. Add the with_lambda_profiler decorator to your handler function:
from codeguru_profiler_agent import with_lambda_profiler

@with_lambda_profiler(profiling_group_name='ProfilingGroupForMyLambdaFunction')
def handler_function(event, context):
      # Your code here

Alternatively, you can profile an existing Lambda function without updating the source code by adding a layer and changing the configuration. For more information, see Profiling your applications that run on AWS Lambda.

Profiling a Lambda function helps you see what is slowing down your code so you can reduce the duration, which reduces the cost and improves latency. You need to have continuous traffic on your function in order to produce a usable profile.

Viewing your profile

After running your profile for some time, you can view it on the CodeGuru console.

Screenshot of Flame graph visualization by CodeGuru Profiler

Each frame in the flame graph shows how much that function contributes to latency. In this example, an outbound call that crosses the network is taking most of the duration in the Lambda function, caching its result would improve the latency.

For more information, see Investigating performance issues with Amazon CodeGuru Profiler.

Supportability for CodeGuru Profiler is documented here.

If you don’t have an application to try CodeGuru Profiler on, you can use the demo application in the following GitHub repo.

Conclusion

This post introduced how to leverage CodeGuru Reviewer to identify hard-to-find code defects in various issue categories and how to onboard your Python applications or Lambda function in CodeGuru Profiler for CPU profiling. Combining both services can help you improve code quality for Python applications. CodeGuru is now available for you to try. For more pricing information, please see Amazon CodeGuru pricing.


About the Authors

Neela Sawant is a Senior Applied Scientist in the Amazon CodeGuru team. Her background is building AI-powered solutions to customer problems in a variety of domains such as software, multimedia, and retail. When she isn’t working, you’ll find her exploring the world anew with her toddler and hacking away at AI for social good.


Pierre Marieu is a Software Development Engineer in the Amazon CodeGuru Profiler team in London. He loves building tools that help the day-to-day life of other software engineers. Previously, he worked at Amadeus IT, building software for the travel industry.


Ran Fu is a Senior Product Manager in the Amazon CodeGuru team. He has a deep customer empathy, and love exploring who are the customers, what are their needs, and why those needs matter. Besides work, you may find him snowboarding in Keystone or Vail, Colorado.


Field Notes: Migrating File Servers to Amazon FSx and Integrating with AWS Managed Microsoft AD

Post Syndicated from Kyaw Soe Hlaing original https://aws.amazon.com/blogs/architecture/field-notes-migrating-file-servers-to-amazon-fsx-and-integrating-with-aws-managed-microsoft-ad/

Amazon FSx provides AWS customers with the native compatibility of third-party file systems with feature sets for workloads such as Windows-based storage, high performance computing (HPC), machine learning, and electronic design automation (EDA).  Amazon FSx automates the time-consuming administration tasks such as hardware provisioning, software configuration, patching, and backups. Since Amazon FSx integrates the file systems with cloud-native AWS services, this makes them even more useful for a broader set of workloads.

Amazon FSx for Windows File Server provides fully managed file storage that is accessible over the industry-standard Server Message Block (SMB) protocol. Built on Windows Server, Amazon FSx delivers a wide range of administrative features such as data deduplication, end-user file restore, and Microsoft Active Directory (AD) integration.

In this post, I explain how to migrate files and file shares from on-premises servers to Amazon FSx with AWS DataSync in a domain migration scenario. Customers are migrating their file servers to Amazon FSx as part of their migration from an on-premises Active Directory to AWS managed Active Directory. Their plan is to replace their file servers with Amazon FSx during Active Directory migration to AWS Managed AD.

Arhictecture diagram

Prerequisites

Before you begin, perform the steps outlined in this blog to migrate the user accounts and groups to the managed Active Directory.

Walkthrough

There are numerous ways to perform the Active Directory migration. Generally, the following five steps are taken:

  1. Establish two-way forest trust between on-premises AD and AWS Managed AD
  2. Migrate user accounts and group with the ADMT tool
  3. Duplicate Access Control List (ACL) permissions in the file server
  4. Migrate files and folders with existing ACL to Amazon FSx using AWS DataSync
  5. Migrate User Computers

In this post, I focus on duplication of ACL permissions and migration of files and folders using Amazon FSx and AWS DataSync. In order to perform duplication of ACL permission in file servers, I use SubInACL tool, which is available from the Microsoft website.

Duplication of the ACL is required because users want to seamlessly access file shares once their computers are migrated to AWS Managed AD. Thus all migrated files and folders have permission with Managed AD users and group objects. For enterprises, the migration of user computers does not happen overnight. Normally, migration takes place in batches or phases. With ACL duplication, both migrated and non-migrated users can access their respective file shares seamlessly during and after migration.

Duplication of Access Control List (ACL)

Before we proceed with ACL duplication, we must ensure that the migration of user accounts and groups was completed. In my demo environment, I have already migrated on-premises users to the Managed Active Directory. In the meantime, we presume that we are migrating identical users to the Managed Active Directory. There might be a scenario where migrated user accounts have different naming such as samAccount name. In this case, we will need to handle this during ACL duplication with SubInACL. For more information about syntax, refer to the SubInACL documentation.

As indicated in following screenshots, I have two users created in the on-premises Active Directory (onprem.local) and those two identical users have been created in the Managed Active Directory too (corp.example.com).

Screenshot of on-premises Active Directory (onprem.local)


Screenshot of Active Directory

In the following screenshot, I have a shared folder called “HR_Documents” in an on-premises file server. Different users have different access rights to that folder. For example, John Smith has “Full Control” but Onprem User1 only have “Read & Execute”. Our plan is to add same access right to identical users from the Managed Active Directory, here corp.example.com, so that once John Smith is migrated to managed AD, he can access to shared folders in Amazon FSx using his Managed Active Directory credential.

Let’s verify the existing permission in the “HR_Documents” folder. Two users from onprem.local are found with different access rights.

Screenshot of HR docs

Screenshot of HR docs

Now it’s time to install SubInACL.

We install it in our on-premises file server. After the SubInACL tool is installed, it can be found under “C:\Program Files (x86)\Windows Resource Kits\Tools” folder by default. To perform an ACL duplication, run command prompt as administrator and run the following command;

Subinacl /outputlog=C:\temp\HR_document_log.txt /errorlog=C:\temp\HR_document_Err_log.txt /Subdirectories C:\HR_Documents\* /migratetodomain=onprem=corp

There are several parameters that I am using in the command:

  • Outputlog = where log file is saved
  • ErrorLog = where error log file is saved
  • Subdirectories = to apply permissions including subfolders and files
  • Migratetodomain= NetBIOS name of source domain and destination domain

Screenshot windows resources kits

screenshot of windows resources kit

If the command is run successfully, you should able to see a summary of the results. If there is no error or failure, you can verify whether ACL permissions are duplicated as expected by looking at the folders and files. In our case, we can see that there is one ACL entry of identical account from corp.example.com is added.

Note: you will always see two ACL entries, one from onprem.local and another one from corp.example.com domain in all the files and folders that you used during migration.  Permissions are now applied to both at the folder and file level.

screenshot of payroll properties

screenshot of doc 1 properties

Migrate files and folders using AWS DataSync

AWS DataSync is an online data transfer service that simplifies, automates, and accelerates moving data between on-premises storage systems and AWS Storage services such as Amazon S3, Amazon Elastic File System (Amazon EFS), or Amazon FSx for Windows File Server. Manual tasks related to data transfers can slow down migrations and burden IT operations. AWS DataSync reduces or automatically handles many of these tasks, including scripting copy jobs, scheduling and monitoring transfers, validating data, and optimizing network utilization.

Create an AWS DataSync agent

An AWS DataSync agent deploys as a virtual machine in an on-premises data center. An AWS DataSync agent can be run on ESXi, KVM, and Microsoft Hyper-V hypervisors. The AWS DataSync agent is used to access on-premises storage systems and transfer data to the AWS DataSync managed service running on AWS. AWS DataSync always performs incremental copies by comparing from a source to a destination and only copying files that are new or have changed.

AWS DataSync supports the following SMB (Server Message Block) locations to migrate data from:

  • Network File System (NFS)
  • Server Message Block (SMB)

In this blog, I use SMB as the source location, since I am migrating from an on-premises Windows File server. AWS DataSync supports SMB 2.1 and SMB 3.0 protocols.

AWS DataSync saves metadata and special files when copying to and from file systems. When files are copied from a SMB file share and Amazon FSx for Windows File Server, AWS DataSync copies the following metadata:

  • File timestamps: access time, modification time, and creation time
  • File owner and file group security identifiers (SIDs)
  • Standard file attributes
  • NTFS discretionary access lists (DACLs): access control entries (ACEs) that determine whether to grant access to an object

Data Synchronization with AWS DataSync

When a task starts, AWS DataSyc goes through different stages. It begins with examining file system follows by data transfer to destination. Once data transfer is completed, it performs verification for consistency between source and destination file systems. You can review detailed information about the data synchronization stages.

DataSync Endpoints

You can activate your agent by using one of the following endpoint types:

  • Public endpoints – If you use public endpoints, all communication from your DataSync agent to AWS occurs over the public internet.
  • Federal Information Processing Standard (FIPS) endpoints – If you need to use FIPS 140-2 validated cryptographic modules when accessing the AWS GovCloud (US-East) or AWS GovCloud (US-West) Region, use this endpoint to activate your agent. You use the AWS CLI or API to access this endpoint.
  • Virtual private cloud (VPC) endpoints – If you use a VPC endpoint, all communication from AWS DataSync to AWS services occurs through the VPC endpoint in your VPC in AWS. This approach provides a private connection between your self-managed data center, your VPC, and AWS services. It increases the security of your data as it is copied over the network.

In my demo environment, I have implemented AWS DataSync as indicated in following diagram. The DataSync Agent can be run either on VMware or Hyper-V and KVM platform in a customer on-premises data center.

Datasync Agent Arhictecture

Once the AWS DataSync Agent setup is completed and the task that defined the source file servers and destination Amazon FSx server is added, you can verify agent status in the AWS Management Console.

Console screenshot

Select Task and then choose Start to start copying files and folders. This will start the replication task (or you can wait until the task runs hourly). You can check the History tab to see a history of the replication task executions.

Console screenshot

Congratulations! You have replicated the contents of an on-premises file server to Amazon FSx. Let’s look and make sure the ACL permissions are still intact in their destination after migration. As shown in the following screenshots, the ACL permissions in the Payroll folder still remains as is, both on-premises users and Managed AD users are inside. Once the user’s computers are migrated to the Managed AD, they can access the same file share in Amazon FSx server using Managed AD credentials.

Payroll properties screenshot

Payroll properties screenshot

Cleaning up

If you are performing testing by following the preceding steps in your own account, delete the following resources, to avoid incurring future charges:

  • EC2 instances
  • Managed AD
  • Amazon FSx file system
  • AWS Datasync

Conclusion

You have learned how to duplicate ACL permissions and shared folder permissions during migration of file servers to Amazon FSx. This process provides a seamless migration experience for users. Once the user’s computers are migrated to the Managed AD, they only need to remap shared folders from Amazon FSx. This can be automated by pushing down shared folders mapping with a Group Policy. If new files or folders are created in the source file server, AWS Datasync will synchronize to Amazon FSx server.

For customers who are planning to do a domain migration from on-premises to AWS Managed Microsoft AD, migration of resources like file servers are common. Handling ACL permissions plays a vital role in providing a seamless migration experience. The duplication of ACL can be an option, otherwise, the ADMT tool can be used to migrate SID information from the source Domain to destination Domain. To migrate SID history, SID filtering needs to be disabled during migration.

If you want to provide feedback about this post, you are welcome to submit in the comments section below.

Field Notes provides hands-on technical guidance from AWS Solutions Architects, consultants, and technical account managers, based on their experiences in the field solving real-world business problems for customers.

Incorporating security in code-reviews using Amazon CodeGuru Reviewer

Post Syndicated from Nikunj Vaidya original https://aws.amazon.com/blogs/devops/incorporating-security-in-code-reviews-using-amazon-codeguru-reviewer/

Today, software development practices are constantly evolving to empower developers with tools to maintain a high bar of code quality. Amazon CodeGuru Reviewer offers this capability by carrying out automated code-reviews for developers, based on the trained machine learning models that can detect complex defects and providing intelligent actionable recommendations to mitigate those defects. A quick overview of CodeGuru is covered in this blog post.

Security analysis is a critical part of a code review and CodeGuru Reviewer offers this capability with a new set of security detectors. These security detectors introduced in CodeGuru Reviewer are geared towards identifying security risks from the top 10 OWASP categories and ensures that your code follows best practices for AWS Key Management Service (AWS KMS), Amazon Elastic Compute Cloud (Amazon EC2) API, and common Java crypto and TLS/SSL libraries. As of today, CodeGuru security analysis supports Java language, thus we will take an example of a Java application.

In this post, we will walk through the on-boarding workflow to carry out the security analysis of the code repository and generate recommendations for a Java application.


Security workflow overview:

The new security workflow, introduced for CodeGuru reviewer, utilizes the source code and build artifacts to generate recommendations. The security detector evaluates build artifacts to generate security-related recommendations whereas other detectors continue to scan the source code to generate recommendations. With the use of build artifacts for evaluation, the detector can carry out a whole-program inter-procedural analysis to discover issues that are caused across your code (e.g., hardcoded credentials in one file that are passed to an API in another) and can reduce false-positives by checking if an execution path is valid or not. You must provide the source code .zip file as well as the build artifact .zip file for a complete analysis.

Customers can run a security scan when they create a repository analysis. CodeGuru Reviewer provides an additional option to get both code and security recommendations. As explained in the following sections, CodeGuru Reviewer will create an Amazon Simple Storage Service (Amazon S3) bucket in your AWS account for that region to upload or copy your source code and build artifacts for the analysis. This repository analysis option can be run on Java code from any repository.


Prerequisites

Prepare the source code and artifact zip files: If you do not have your Java code locally, download the source code that you want to evaluate for security and zip it. Similarly, if needed, download the build artifact .jar file for your source code and zip it. It will be required to upload the source code and build artifact as separate .zip files as per the instructions in subsequent sections. Thus even if it is a single file (eg. single .jar file), you will still need to zip it. Even if the .zip file includes multiple files, the right files will be discovered and analyzed by CodeGuru. For our sample test, we will use src.zip and jar.zip file, saved locally.

Creating an S3 bucket repository association:

This section summarizes the high-level steps to create the association of your S3 bucket repository.

1. On the CodeGuru console, choose Code reviews.

2. On the Repository analysis tab, choose Create repository analysis.

Screenshot of initiating the repository analysis

Figure: Screenshot of initiating the repository analysis


3. For the source code analysis, select Code and security recommendations.

4. For Repository name, enter a name for your repository.

5. Under Additional settings, for Code review name, enter a name for trackability purposes.

6. Choose Create S3 bucket and associate.

Screenshot to show selection of Security Code Analysis

Figure: Screenshot to show selection of Security Code Analysis

It takes a few seconds to create a new S3 bucket in the current Region. When it completes, you will see the below screen.

Screenshot for Create repository analysis showing S3 bucket created

Figure: Screenshot for Create repository analysis showing S3 bucket created


7. Choose Upload to the S3 bucket option and under that choose Upload source code zip file and select the zip file (src.zip) from your local machine to upload.

Screenshot of popup to upload code and artifacts from S3 bucket

Figure: Screenshot of popup to upload code and artifacts from S3 bucket


8. Similarly, choose Upload build artifacts zip file and select the zip file (jar.zip) from your local machine and upload.


Screenshot for Create repository analysis showing S3 paths populated

Figure: Screenshot for Create repository analysis showing S3 paths populated


Alternatively, you can always upload the source code and build artifacts as zip file from any of your existing S3 bucket as below.

9. Choose Browse S3 buckets for existing artifacts and upload from there as shown below:


Screenshot to upload code and artifacts from S3 bucket

Figure: Screenshot to upload code and artifacts from an existing S3 bucket


10. Now click Create repository analysis and trigger the code review.

A new pending entry is created as shown below.


Screenshot of code review in Pending state

Figure: Screenshot of code review in Pending state

After a few minutes, you would see the recommendations generate that would include security analysis too. In the below case, there are 10 recommendations generated.

Screenshot of repository analysis being completed

Figure: Screenshot of repository analysis being completed


For the subsequent code reviews, you can use the same repository and upload new files or create a new repository as shown below:


Screenshot of subsequent code review making repository selection

Figure: Screenshot of subsequent code review making repository selection


Recommendations

Apart from detecting the security risks from the top 10 OWASP categories, the security detector, detects the deep security issues by analyzing data flow across multiple methods, procedures, and files.

The recommendations generated in the area of security are labelled as Security. In the below example we see a recommendation to remove hard-coded credentials and a non-security-related recommendation about refactoring of code for better maintainability.

Screenshot of Recommendations generated

Figure: Screenshot of Recommendations generated


Below is another example of recommendations pointing out the potential resource-leak as well as a security issue pointing to a potential risk of path traversal attack.

Screenshot of deep security recommendations

Figure: More examples of deep security recommendations


As this blog is focused on on-boarding aspects, we will cover the explanation of recommendations in more detail in a separate blog.

Disassociation of Repository (optional):

The association of CodeGuru to the S3 bucket repository can be removed by following below steps. Navigate to the Repositories page, select the repository and choose Disassociate repository.

Screenshot of disassociating the S3 bucket repo with CodeGuru

Figure: Screenshot of disassociating the S3 bucket repo with CodeGuru


Conclusion

This post reviewed the support for on-boarding workflow to carry out the security analysis in CodeGuru Reviewer. We initiated a full repository analysis for the Java code using a separate UI workflow and generated recommendations.

We hope this post was useful and would enable you to conduct code analysis using Amazon CodeGuru Reviewer.


About the Author

Author's profile photo


Nikunj Vaidya is a Sr. Solutions Architect with Amazon Web Services, focusing in the area of DevOps services. He builds technical content for the field enablement and offers technical guidance to the customers on AWS DevOps solutions and services that would streamline the application development process, accelerate application delivery, and enable maintaining a high bar of software quality.

Using Amazon SQS dead-letter queues to replay messages

Post Syndicated from James Beswick original https://aws.amazon.com/blogs/compute/using-amazon-sqs-dead-letter-queues-to-replay-messages/

Amazon Simple Queue Service (Amazon SQS) is a fully managed message queuing service. It enables you to decouple and scale microservices, distributed systems, and serverless applications. A commonly used feature of Amazon SQS is dead-letter queues. The DLQ (dead-letter queue) is used to store messages that can’t be processed (consumed) successfully.

This post describes how to add automated resilience to an existing SQS queue. It monitors the dead-letter queue and moves a message back to the main queue to see if it can be processed again. It also uses a specific algorithm to make sure this is not repeated forever. Each time it attempts to reprocess the message, the replay time increases until the message is finally considered dead.

I use Amazon SQS dead-letter queues, AWS Lambda, and a specific algorithm to decrease the rate of retries for failed messages. I then package and publish this serverless solution in the AWS Serverless Application Repository.

Dead-letter queues and message replay

The main task of a dead-letter queue (DLQ) is to handle message failure. It allows you to set aside and isolate non-processed messages to determine why processing failed. Often these failed messages are caused by application errors. For example, a consumer application fails to parse a message correctly and throws an unhandled exception. This exception then triggers an error response that sends the message to the DLQ. The AWS documentation contains a tutorial detailing the configuration of an Amazon SQS dead-letter queue.

To process the failed messages, I build a retry mechanism by implementing an exponential backoff algorithm. The idea behind exponential backoff is to use progressively longer waits between retries for consecutive error responses. Most exponential backoff algorithms use jitter (randomized delay) to prevent successive collisions. This spreads the message retries more evenly across time, allowing them to be processed more efficiently.

Solution overview

Solution architecture

The flow of the message sent by the producer to SQS is as follows:

  1. The producer application sends a message to an SQS queue
  2. The consumer application fails to process the message in the same SQS queue
  3. The message is moved from the main SQS queue to the default dead-letter queue as per the component settings.
  4. A Lambda function is configured with the SQS main dead-letter queue as an event source. It receives and sends back the message to the original queue adding a message timer.
  5. The message timer is defined by the exponential backoff and jitter algorithm.
  6. You can limit the number of retries. If the message exceeds this limit, the message is moved to a second DLQ where an operator processes it manually.

How the replay function works

Each time the SQS dead-letter queue receives a message, it triggers Lambda to run the replay function. The replay code uses an SQS message attribute `sqs-dlq-replay-nb` as a persistent counter for the current number of retries attempted. The number of retries is compared to the maximum number (defined in the application configuration file). If it exceeds the maximum, the message is moved to the human operated queue. If not, the function uses the AWS Lambda event data to build a new message for the Amazon SQS main queue. Finally it updates the retry counter, adds a new message timer to the message, and it sends the message back (replays) to the main queue.

def handler(event, context):
    """Lambda function handler."""
    for record in event['Records']:
        nbReplay = 0
        # number of replay
        if 'sqs-dlq-replay-nb' in record['messageAttributes']:
            nbReplay = int(record['messageAttributes']['sqs-dlq-replay-nb']["stringValue"])

        nbReplay += 1
        if nbReplay > config.MAX_ATTEMPS:
            raise MaxAttempsError(replay=nbReplay, max=config.MAX_ATTEMPS)

        # SQS attributes
        attributes = record['messageAttributes']
        attributes.update({'sqs-dlq-replay-nb': {'StringValue': str(nbReplay), 'DataType': 'Number'}})

        _sqs_attributes_cleaner(attributes)

        # Backoff
        b = backoff.ExpoBackoffFullJitter(base=config.BACKOFF_RATE, cap=config.MESSAGE_RETENTION_PERIOD)
        delaySeconds = b.backoff(n=int(nbReplay))

        # SQS
        SQS.send_message(
            QueueUrl=config.SQS_MAIN_URL,
            MessageBody=record['body'],
            DelaySeconds=int(delaySeconds),
            MessageAttributes=record['messageAttributes']
        )

How to use the application

You can use this serverless application via:

  • The Lambda console: choose the “Browse serverless app repository” option to create a function. Select “amazon-sqs-dlq-replay-backoff” application in the public applications repository. Then, configure the application with the default SQS parameters and the replay feature parameters.
  • The Serverless Framework, as described by Yan Cui in this blog post.
  • An AWS CloudFormation template by using the AWS::ServerlessRepo::Application resource, as described in the documentation.

Here is an example of a CloudFormation template using the AWS Serverless Application Repository application:

AWSTemplateFormatVersion: '2010-09-09'
Transform: AWS::Serverless-2016-10-31

Resources:
  ReplaySqsQueue:
    Type: AWS::Serverless::Application
    Properties:
      Location: 
        ApplicationId: arn:aws:serverlessrepo:eu-west-1:1234123412:applications~sqs-dlq-replay
        SemanticVersion: 1.0.0
      Parameters:
        BackoffRate: "2"
        MaxAttempts: "3"

Conclusion

I describe how an exponential backoff algorithm (with jitter) enhances the message processing capabilities of an Amazon SQS queue. You can now find the amazon-sqs-dlq-replay-backoff application in the AWS Serverless Application Repository. Download the code from this GitHub repository.

To get started with dead-letter queues in Amazon SQS, read:

To implement replay mechanisms, see:

For more serverless learning resources, visit https://serverlessland.com.

Field Notes: Setting Up Disaster Recovery in a Different Seismic Zone Using AWS Outposts

Post Syndicated from Vijay Menon original https://aws.amazon.com/blogs/architecture/field-notes-setting-up-disaster-recovery-in-a-different-seismic-zone-using-aws-outposts/

Recovering your mission-critical workloads from outages is essential for business continuity and providing services to customers with little or no interruption. That’s why many customers replicate their mission-critical workloads in multiple places using a Disaster Recovery (DR) strategy suited for their needs.

With AWS, a customer can achieve this by deploying multi Availability Zone High-Availability setup or a multi-region setup by replicating critical components of an application to another region.  Depending on the RPO and RTO of the mission-critical workload, the requirement for disaster recovery ranges from simple backup and restore, to multi-site, active-active, setup. In this blog post, I explain how AWS Outposts can be used for DR on AWS.

In many geographies, it is possible to set up your disaster recovery for a workload running in one AWS Region to another AWS Region in the same country (for example in US between us-east-1 and us-west-2). For countries where there is only one AWS Region, it’s possible to set up disaster recovery in another country where AWS Region is present. This method can be designed for the continuity, resumption and recovery of critical business processes at an agreed level and limits the impact on people, processes and infrastructure (including IT). Other reasons include to minimize the operational, financial, legal, reputational and other material consequences arising from such events.

However, for mission-critical workloads handling critical user data (PII, PHI or financial data), countries like India and Canada have regulations which mandate to have a disaster recovery setup at a “safe distance” within the same country. This ensures compliance with any data sovereignty or data localization requirements mandated by the regulators. “Safe distance” means the distance between the DR site and the primary site is such that the business can continue to operate in the event of any natural disaster or industrial events affecting the primary site. Depending on the geography, this safe distance could be 50KM or more. These regulations limit the options customers have to use another AWS Region in another country as a disaster recovery site of their primary workload running on AWS.

In this blog post, I describe an architecture using AWS Outposts which helps set up disaster recovery on AWS within the same country at a distance that can meet the requirements set by regulators. This architecture also helps customers to comply with various data sovereignty regulations in a given country. Another advantage of this architecture is the homogeneity of the primary and disaster recovery site. Your existing IT teams can set up and operate the disaster recovery site using familiar AWS tools and technology in a homogenous environment.

Prerequisites

Readers of this blog post should be familiar with basic networking concepts like WAN connectivity, BGP and the following AWS services:

Architecture Overview

I explain the architecture using an example customer scenario in India, where a customer is using AWS Mumbai Region for their mission-critical workload. This workload needs a DR setup to comply with local regulation and the DR setup needs to be in a different seismic zone than the one for Mumbai. Also, because of the nature of the regulated business, the user/sensitive data needs to be stored within India.

Following is the architecture diagram showing the logical setup.

This solution is similar to a typical AWS Outposts use case where a customer orders the Outposts to be installed in their own Data Centre (DC) or a CoLocation site (Colo). It will follow the shared responsibility model described in AWS Outposts documentation.

The only difference is that the AWS Outpost parent Region will be the closest Region other than AWS Mumbai, in this case Singapore. Customers will then provision an AWS Direct Connect public VIF locally for a Service Link to the Singapore Region. This ensures that the control plane stays available via the AWS Singapore Region even if there is an outage in AWS Mumbai Region affecting control plane availability. You can then launch and manage AWS Outposts supported resources in the AWS Outposts rack.

For data plane traffic, which should not go out of the country, the following options are available:

  • Provision a self-managed Virtual Private Network (VPN) between an EC2 instances running router AMI in a subnet of AWS Outposts and AWS Transit Gateway (TGW) in the primary Region.
  • Provision a self-managed Virtual Private Network (VPN) between an EC2 instances running router AMI in a subnet of AWS Outposts and Virtual Private Gateway (VGW) in the primary Region.

Note: The Primary Region in this example is AWS Mumbai Region. This VPN will be provisioned via Local Gateway and DX public VIF. This ensures that data plane traffic will not traverse any network out of the country (India) to comply with data localization mandated by the regulators.

Architecture Walkthrough

  1. Make sure your data center (DC) or the choice of collocate facility (Colo) meets the requirements for AWS Outposts.
  2. Create an Outpost and order Outpost capacity as described in the documentation. Make sure that you do this step while logged into AWS Outposts console of the AWS Singapore Region.
  3. Provision connectivity between AWS Outposts and network of your DC/Colo as mentioned in AWS Outpost documentation.  This includes setting up VLANs for service links and Local Gateway (LGW).
  4. Provision an AWS Direct Connect connection and public VIF between your DC/Colo and the primary Region via the closest AWS Direct Connect location.
    • For the WAN connectivity between your DC/Colo and AWS Direct Connect location you can choose any telco provider of your choice or work with one of AWS Direct Connect partners.
    • This public VIF will be used to attach AWS Outposts to its parent Region in Singapore over AWS Outposts service link. It will also be used to establish an IPsec GRE tunnel between AWS Outposts subnet and a TGW or VGW for data plane traffic (explained in subsequent steps).
    • Alternatively, you can provision separate Direct Connect connection and public VIFs for Service Link and data plane traffic for better segregation between the two. You will have to provision sufficient bandwidth on Direct Connect connection for the Service Link traffic as well as the Data Plane traffic (like data replication between primary Region and AWS outposts).
    • For an optimal experience and resiliency, AWS recommends that you use dual 1Gbps connections to the AWS Region. This connectivity can also be achieved over Internet transit; however, I recommend using AWS Direct Connect because it provides private connectivity between AWS and your DC/Colo  environment, which in many cases can reduce your network costs, increase bandwidth throughput, and provide a more consistent network experience than Internet-based connections.
  5. Create a subnet in AWS Outposts and launch an EC2 instance running a router AMI of your choice from AWS Marketplace in this subnet. This EC2 instance is used to establish the IPsec GRE tunnel to the TGW or VGW in primary Region.
  6. Add rules in security group of these EC2 instances to allow ISAKMP (UDP 500), NAT Traversal (UDP 4500), and ESP (IP Protocol 50) from VGW or TGW endpoint public IP addresses.
  7. NAT (Network Address Translation) the EIP assigned in step 5 to a public IP address at your edge router connecting to AWS Direct connect or internet transit. This public IP will be used as the customer gateway to establish IPsec GRE tunnel to the primary Region.
  8. Create a customer gateway using the public IP address used to NAT the EC2 instances step 7. Follow the steps in similar process found at Create a Customer Gateway.
  9. Create a VPN attachment for the transit gateway using the customer gateway created in step 8. This VPN must be a dynamic route-based VPN. For steps, review Transit Gateway VPN Attachments. If you are connecting the customer gateway to VPC using VGW in primary Region then follow the steps mentioned at How do I create a secure connection between my office network and Amazon Virtual Private Cloud?.
  10. Configure the customer gateway (EC2 instance running a router AMI in AWS Outposts subnet) side for VPN connectivity. You can base this configuration suggested by AWS during the creation of VPN in step 9. This suggested sample configuration can be downloaded from AWS console post VPN setup as discussed in this document.
  11. Modify the route table of AWS outpost Subnets to point to the EC2 instance launched in step 5 as the target for any destination in your VPCs in the primary Region, which is AWS Mumbai in this example.

At this point, you will have end-to-end connectivity between VPCs in a primary Region and resources in an AWS Outposts. This connectivity can now be used to replicate data from your primary site to AWS Outposts for DR purposes. This  keeps the setup compliant with any internal or external data localization requirements.

Conclusion

In this blog post, I described an architecture using AWS Outposts for Disaster Recovery on AWS in countries without a second AWS Region. To set up disaster recovery, your existing IT teams can set up and operate the disaster recovery site using the familiar AWS tools and technology in a homogeneous environment. To learn more about AWS Outposts, refer to the documentation and FAQ.

Field Notes provides hands-on technical guidance from AWS Solutions Architects, consultants, and technical account managers, based on their experiences in the field solving real-world business problems for customers.

Using NuGet with AWS CodeArtifact

Post Syndicated from John Standish original https://aws.amazon.com/blogs/devops/using-nuget-with-aws-codeartifact/

Managing NuGet packages for .NET development can be a challenge. Tasks such as initial configuration, ongoing maintenance, and scaling inefficiencies are the biggest pain points for developers and organizations. With its addition of NuGet package support, AWS CodeArtifact now provides easy-to-configure and scalable package management for .NET developers. You can use NuGet packages stored in CodeArtifact in Visual Studio, allowing you to use the tools you already know.

In this post, we show how you can provision NuGet repositories in 5 minutes. Then we demonstrate how to consume packages from your new NuGet repositories, all while using .NET native tooling.

All relevant code for this post is available in the aws-codeartifact-samples GitHub repo.

Prerequisites

For this walkthrough, you should have the following prerequisites:

Architecture overview

Two core resource types make up CodeArtifact: domains and repositories. Domains provide an easy way manage multiple repositories within an organization. Repositories store packages and their assets. You can connect repositories to other CodeArtifact repositories, or popular public package repositories such as nuget.org, using upstream and external connections. For more information about these concepts, see AWS CodeArtifact Concepts.

The following diagram illustrates this architecture.

AWS CodeArtifact core concepts

Figure: AWS CodeArtifact core concepts

Creating CodeArtifact resources with AWS CloudFormation

The AWS CloudFormation template provided in this post provisions three CodeArtifact resources: a domain, a team repository, and a shared repository. The team repository is configured to use the shared repository as an upstream repository, and the shared repository has an external connection to nuget.org.

The following diagram illustrates this architecture.

Example AWS CodeArtifact architecture

Figure: Example AWS CodeArtifact architecture

The following CloudFormation template used in this walkthrough:

AWSTemplateFormatVersion: '2010-09-09'
Description: AWS CodeArtifact resources for dotnet

Resources:
  # Create Domain
  ExampleDomain:
    Type: AWS::CodeArtifact::Domain
    Properties:
      DomainName: example-domain
      PermissionsPolicyDocument:
        Version: 2012-10-17
        Statement:
          - Effect: Allow
            Principal:
              AWS: 
              - !Sub arn:aws:iam::${AWS::AccountId}:root
            Resource: "*"
            Action:
              - codeartifact:CreateRepository
              - codeartifact:DescribeDomain
              - codeartifact:GetAuthorizationToken
              - codeartifact:GetDomainPermissionsPolicy
              - codeartifact:ListRepositoriesInDomain

  # Create External Repository
  MyExternalRepository:
    Type: AWS::CodeArtifact::Repository
    Condition: ProvisionNugetTeamAndUpstream
    Properties:
      DomainName: !GetAtt ExampleDomain.Name
      RepositoryName: my-external-repository       
      ExternalConnections:
        - public:nuget-org
      PermissionsPolicyDocument:
        Version: 2012-10-17
        Statement:
          - Effect: Allow
            Principal:
              AWS: 
              - !Sub arn:aws:iam::${AWS::AccountId}:root
            Resource: "*"
            Action:
              - codeartifact:DescribePackageVersion
              - codeartifact:DescribeRepository
              - codeartifact:GetPackageVersionReadme
              - codeartifact:GetRepositoryEndpoint
              - codeartifact:ListPackageVersionAssets
              - codeartifact:ListPackageVersionDependencies
              - codeartifact:ListPackageVersions
              - codeartifact:ListPackages
              - codeartifact:PublishPackageVersion
              - codeartifact:PutPackageMetadata
              - codeartifact:ReadFromRepository

  # Create Repository
  MyTeamRepository:
    Type: AWS::CodeArtifact::Repository
    Properties:
      DomainName: !GetAtt ExampleDomain.Name
      RepositoryName: my-team-repository
      Upstreams:
        - !GetAtt MyExternalRepository.Name
      PermissionsPolicyDocument:
        Version: 2012-10-17
        Statement:
          - Effect: Allow
            Principal:
              AWS: 
              - !Sub arn:aws:iam::${AWS::AccountId}:root
            Resource: "*"
            Action:
              - codeartifact:DescribePackageVersion
              - codeartifact:DescribeRepository
              - codeartifact:GetPackageVersionReadme
              - codeartifact:GetRepositoryEndpoint
              - codeartifact:ListPackageVersionAssets
              - codeartifact:ListPackageVersionDependencies
              - codeartifact:ListPackageVersions
              - codeartifact:ListPackages
              - codeartifact:PublishPackageVersion
              - codeartifact:PutPackageMetadata
              - codeartifact:ReadFromRepository

Getting the CloudFormation template

To use the CloudFormation stack, we recommend you clone the following GitHub repo so you also have access to the example projects. See the following code:

git clone https://github.com/aws-samples/aws-codeartifact-samples.git
cd aws-codeartifact-samples/getting-started/dotnet/cloudformation/

Alternatively, you can copy the previous template into a file on your local filesystem named deploy.yml.

Provisioning the CloudFormation stack

Now that you have a local copy of the template, you need to provision the resources using a CloudFormation stack. You can deploy the stack using the AWS CLI or on the AWS CloudFormation console.

To use the AWS CLI, enter the following code:

aws cloudformation deploy \
--template-file deploy.yml \
--region <YOUR_PREFERRED_REGION> \
--stack-name CodeArtifact-GettingStarted-DotNet

To use the AWS CloudFormation console, complete the following steps:

  1. On the AWS CloudFormation console, choose Create stack.
  2. Choose With new resources (standard).
  3. Select Upload a template file.
  4. Choose Choose file.
  5. Name the stack CodeArtifact-GettingStarted-DotNet.
  6. Continue to choose Next until prompted to create the stack.

Configuring your local development experience

We use the CodeArtifact credential provider to connect the Visual Studio IDE to a CodeArtifact repository. You need to download and install the AWS Toolkit for Visual Studio to configure the credential provider. The toolkit is an extension for Microsoft Visual Studio on Microsoft Windows that makes it easy to develop, debug, and deploy .NET applications to AWS. The credential provider automates fetching and refreshing the authentication token required to pull packages from CodeArtifact. For more information about the authentication process, see AWS CodeArtifact authentication and tokens.

To connect to a repository, you complete the following steps:

  1. Configure an account profile in the AWS Toolkit.
  2. Copy the source endpoint from the AWS Explorer.
  3. Set the NuGet package source as the source endpoint.
  4. Add packages for your project via your CodeArtifact repository.

Configuring an account profile in the AWS Toolkit

Before you can use the Toolkit for Visual Studio, you must provide a set of valid AWS credentials. In this step, we set up a profile that has access to interact with CodeArtifact. For instructions, see Providing AWS Credentials.

Visual Studio Toolkit for AWS Account Profile Setup

Figure: Visual Studio Toolkit for AWS Account Profile Setup

Copying the NuGet source endpoint

After you set up your profile, you can see your provisioned repositories.

  1. In the AWS Explorer pane, navigate to the repository you want to connect to.
  2. Choose your repository (right-click).
  3. Choose Copy NuGet Source Endpoint.
AWS CodeArtifact repositories shown in the AWS Explorer

Figure: AWS CodeArtifact repositories shown in the AWS Explorer


You use the source endpoint later to configure your NuGet package sources.

Setting the package source using the source endpoint

Now that you have your source endpoint, you can set up the NuGet package source.

  1. In Visual Studio, under Tools, choose Options.
  2. Choose NuGet Package Manager.
  3. Under Options, choose the + icon to add a package source.
  4. For Name , enter codeartifact.
  5. For Source, enter the source endpoint you copied from the previous step.
Configuring Nuget package sources for AWS CodeArtifact

Figure: Configuring NuGet package sources for AWS CodeArtifact


Adding packages via your CodeArtifact repository

After the package source is configured against your team repository, you can pull packages via the upstream connection to the shared repository.

  1. Choose Manage NuGet Packages for your project.
    • You can now see packages from nuget.org.
  2. Choose any package to add it to your project.
Exploring packages while connected to a AWS CodeArtifact repository

Exploring packages while connected to a AWS CodeArtifact repository

Viewing packages stored in your CodeArtifact team repository

Packages are stored in a repository you pull from, or referenced via the upstream connection. Because we’re pulling packages from nuget.org through an external connection, you can see cached copies of those packages in your repository. To view the packages, navigate to your repository on the CodeArtifact console.

Packages stored in a AWS CodeArtifact repository

Packages stored in a AWS CodeArtifact repository

Cleaning Up

When you’re finished with this walkthrough, you may want to remove any provisioned resources. To remove the resources that the CloudFormation template created, navigate to the stack on the AWS CloudFormation console and choose Delete Stack. It may take a few minutes to delete all provisioned resources.

After the resources are deleted, there are no more cleanup steps.

Conclusion

We have shown you how to set up CodeArtifact in minutes and easily integrate it with NuGet. You can build and push your package faster, from hours or days to minutes. You can also integrate CodeArtifact directly in your Visual Studio environment with four simple steps. With CodeArtifact repositories, you inherit the durability and security posture from the underlying storage of CodeArtifact for your packages.

As of November 2020, CodeArtifact is available in the following AWS Regions:

  • US: US East (Ohio), US East (N. Virginia), US West (Oregon)
  • AP: Asia Pacific (Mumbai), Asia Pacific (Singapore), Asia Pacific (Sydney), Asia Pacific (Tokyo)
  • EU: Europe (Frankfurt), Europe (Ireland), Europe (Stockholm)

For an up-to-date list of Regions where CodeArtifact is available, see AWS CodeArtifact FAQ.

About the Authors

John Standish

John Standish is a Solutions Architect at AWS and spent over 13 years as a Microsoft .Net developer. Outside of work, he enjoys playing video games, cooking, and watching hockey.

Nuatu Tseggai

Nuatu Tseggai is a Cloud Infrastructure Architect at Amazon Web Services. He enjoys working with customers to design and build event-driven distributed systems that span multiple services.

Neha Gupta

Neha Gupta is a Solutions Architect at AWS and have 16 years of experience as a Database architect/ DBA. Apart from work, she’s outdoorsy and loves to dance.

Elijah Batkoski

Elijah is a Technical Writer for Amazon Web Services. Elijah has produced technical documentation and blogs for a variety of tools and services, primarily focused around DevOps.

Publishing private npm packages with AWS CodeArtifact

Post Syndicated from Ryan Sonshine original https://aws.amazon.com/blogs/devops/publishing-private-npm-packages-aws-codeartifact/

This post demonstrates how to create, publish, and download private npm packages using AWS CodeArtifact, allowing you to share code across your organization without exposing your packages to the public.

The ability to control CodeArtifact repository access using AWS Identity and Access Management (IAM) removes the need to manage additional credentials for a private npm repository when developers already have IAM roles configured.

You can use private npm packages for a variety of use cases, such as:

  • Reducing code duplication
  • Configuration such as code linting and styling
  • CLI tools for internal processes

This post shows how to easily create a sample project in which we publish an npm package and install the package from CodeArtifact. For more information about pipeline integration, see AWS CodeArtifact and your package management flow – Best Practices for Integration.

Solution overview

The following diagram illustrates this solution.

Diagram showing npm package publish and install with CodeArtifact

In this post, you create a private scoped npm package containing a sample function that can be used across your organization. You create a second project to download the npm package. You also learn how to structure your npm package to make logging in to CodeArtifact automatic when you want to build or publish the package.

The code covered in this post is available on GitHub:

Prerequisites

Before you begin, you need to complete the following:

  1. Create an AWS account.
  2. Install the AWS Command Line Interface (AWS CLI). CodeArtifact is supported in these CLI versions:
    1. 18.83 or later: install the AWS CLI version 1
    2. 0.54 or later: install the AWS CLI version 2
  3. Create a CodeArtifact repository.
  4. Add required IAM permissions for CodeArtifact.

Creating your npm package

You can create your npm package in three easy steps: set up the project, create your npm script for authenticating with CodeArtifact, and publish the package.

Setting up your project

Create a directory for your new npm package. We name this directory my-package because it serves as the name of the package. We use an npm scope for this package, where @myorg represents the scope all of our organization’s packages are published under. This helps us distinguish our internal private package from external packages. See the following code:

npm init --scope=@myorg -y

{
  "name": "@myorg/my-package",
  "version": "1.0.0",
  "description": "A sample private scoped npm package",
  "main": "index.js",
  "scripts": {
    "test": "echo \"Error: no test specified\" && exit 1"
  }
}

The package.json file specifies that the main file of the package is called index.js. Next, we create that file and add our package function to it:

module.exports.helloWorld = function() {
  console.log('Hello world!');
}

Creating an npm script

To create your npm script, complete the following steps:

  1. On the CodeArtifact console, choose the repository you created as part of the prerequisites.

If you haven’t created a repository, create one before proceeding.

CodeArtifact repository details console

  1. Select your CodeArtifact repository and choose Details to view the additional details for your repository.

We use two items from this page:

  • Repository name (my-repo)
  • Domain (my-domain)
  1. Create a script named co:login in our package.json. The package.json contains the following code:
{
  "name": "@myorg/my-package",
  "version": "1.0.0",
  "description": "A sample private scoped npm package",
  "main": "index.js",
  "scripts": {
    "co:login": "aws codeartifact login --tool npm --repository my-repo --domain my-domain",
    "test": "echo \"Error: no test specified\" && exit 1"
  }
}

Running this script updates your npm configuration to use your CodeArtifact repository and sets your authentication token, which expires after 12 hours.

  1. To test our new script, enter the following command:

npm run co:login

The following code is the output:

> aws codeartifact login --tool npm --repository my-repo --domain my-domain
Successfully configured npm to use AWS CodeArtifact repository https://my-domain-<ACCOUNT ID>.d.codeartifact.us-east-1.amazonaws.com/npm/my-repo/
Login expires in 12 hours at 2020-09-04 02:16:17-04:00
  1. Add a prepare script to our package.json to run our login command:
{
  "name": "@myorg/my-package",
  "version": "1.0.0",
  "description": "A sample private scoped npm package",
  "main": "index.js",
  "scripts": {
    "prepare": "npm run co:login",
    "co:login": "aws codeartifact login --tool npm --repository my-repo --domain my-domain",
    "test": "echo \"Error: no test specified\" && exit 1"
  }
}

This configures our project to automatically authenticate and generate an access token anytime npm install or npm publish run on the project.

If you see an error containing Invalid choice, valid choices are:, you need to update the AWS CLI according to the versions listed in the perquisites of this post.

Publishing your package

To publish our new package for the first time, run npm publish.

The following screenshot shows the output.

Terminal showing npm publish output

If we navigate to our CodeArtifact repository on the CodeArtifact console, we now see our new private npm package ready to be downloaded.

CodeArtifact console showing published npm package

Installing your private npm package

To install your private npm package, you first set up the project and add the CodeArtifact configs. After you install your package, it’s ready to use.

Setting up your project

Create a directory for a new application and name it my-app. This is a sample project to download our private npm package published in the previous step. You can apply this pattern to all repositories you intend on installing your organization’s npm packages in.

npm init -y

{
  "name": "my-app",
  "version": "1.0.0",
  "description": "A sample application consuming a private scoped npm package",
  "main": "index.js",
  "scripts": {
    "test": "echo \"Error: no test specified\" && exit 1"
  }
}

Adding CodeArtifact configs

Copy the npm scripts prepare and co:login created earlier to your new project:

{
  "name": "my-app",
  "version": "1.0.0",
  "description": "A sample application consuming a private scoped npm package",
  "main": "index.js",
  "scripts": {
    "prepare": "npm run co:login",
    "co:login": "aws codeartifact login --tool npm --repository my-repo --domain my-domain",
    "test": "echo \"Error: no test specified\" && exit 1"
  }
}

Installing your new private npm package

Enter the following command:

npm install @myorg/my-package

Your package.json should now list @myorg/my-package in your dependencies:

{
  "name": "my-app",
  "version": "1.0.0",
  "description": "",
  "main": "index.js",
  "scripts": {
    "prepare": "npm run co:login",
    "co:login": "aws codeartifact login --tool npm --repository my-repo --domain my-domain",
    "test": "echo \"Error: no test specified\" && exit 1"
  },
  "dependencies": {
    "@myorg/my-package": "^1.0.0"
  }
}

Using your new npm package

In our my-app application, create a file named index.js to run code from our package containing the following:

const { helloWorld } = require('@myorg/my-package');

helloWorld();

Run node index.js in your terminal to see the console print the message from our @myorg/my-package helloWorld function.

Cleaning Up

If you created a CodeArtifact repository for the purposes of this post, use one of the following methods to delete the repository:

Remove the changes made to your user profile’s npm configuration by running npm config delete registry, this will remove the CodeArtifact repository from being set as your default npm registry.
Conclusion

In this post, you successfully published a private scoped npm package stored in CodeArtifact, which you can reuse across multiple teams and projects within your organization. You can use npm scripts to streamline the authentication process and apply this pattern to save time.

About the Author

Ryan Sonshine

Ryan Sonshine is a Cloud Application Architect at Amazon Web Services. He works with customers to drive digital transformations while helping them architect, automate, and re-engineer solutions to fully leverage the AWS Cloud.