Post Syndicated from Jonathan Nguyen original https://aws.amazon.com/blogs/security/how-to-automatically-build-forensic-kernel-modules-for-amazon-linux-ec2-instances/
In this blog post, we will walk you through the EC2 forensic module factory solution to deploy automation to build forensic kernel modules that are required for Amazon Elastic Compute Cloud (Amazon EC2) incident response automation.
When an EC2 instance is suspected to have been compromised, it’s strongly recommended to investigate what happened to the instance. You should look for activities such as:
- Open network connections
- List of running processes
- Processes that contain injected code
- Memory-resident infections
- Other forensic artifacts
When an EC2 instance is compromised, it’s important to take action as quickly as possible. Before you shut down the EC2 instance, you first need to capture the contents of its volatile memory (RAM) in a memory dump because it contains the instance’s in-progress operations. This is key in determining the root cause of compromise.
In order to capture volatile memory in Linux, you can use a tool like Linux Memory Extractor (LiME). This requires you to have the kernel modules that are specific to the kernel version of the instance for which you want to capture volatile memory. We also recommend that you limit the actions you take on the instance where you are trying to capture the volatile memory in order to minimize the set of artifacts created as part of the capture process, so you need a method to build the tools for capturing volatile memory outside the instance under investigation. After you capture the volatile memory, you can use a tool like Volatility2 to analyze it in a dedicated forensics environment. You can use tools like LiME and Volatility2 on EC2 instances that use x86, x64, and Graviton instance types.
Prerequisites
This solution has the following prerequisites:
- The Target EC2 instance is using Amazon Linux 2 operating system.
- An AWS Identity and Access Management (IAM) role with permissions to deploy the required resources in an AWS account. More details about these permissions follow in the next section.
Solution overview
The EC2 forensic module factory solution consists of the following resources:
- One AWS Step Functions workflow
- Two AWS Lambda functions
- One AWS Systems Manager document (SSM document)
Important: The SSM document clones the LiME and Volatility2 GitHub repositories, and these tools use version 2.0 of the GNU General Public License. This SSM document can be updated to include your preferred tools, like fmem or Volatility3, for forensic analysis and capture.
- One Amazon Simple Storage Service (Amazon S3) bucket
- One Amazon Virtual Private Cloud (Amazon VPC)
- One security group for the EC2 instance that is provisioned during the automation
- The solution uses the following VPC endpoints for AWS services:
- ec2_endpoint
- ec2_msg_endpoint
- kms_endpoint
- ssm_endpoint
- ssm_msg_endpoint
- s3_endpoint
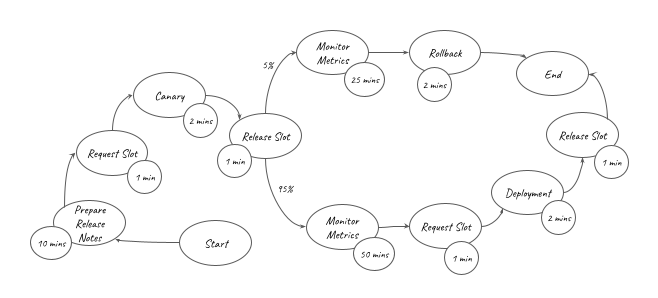
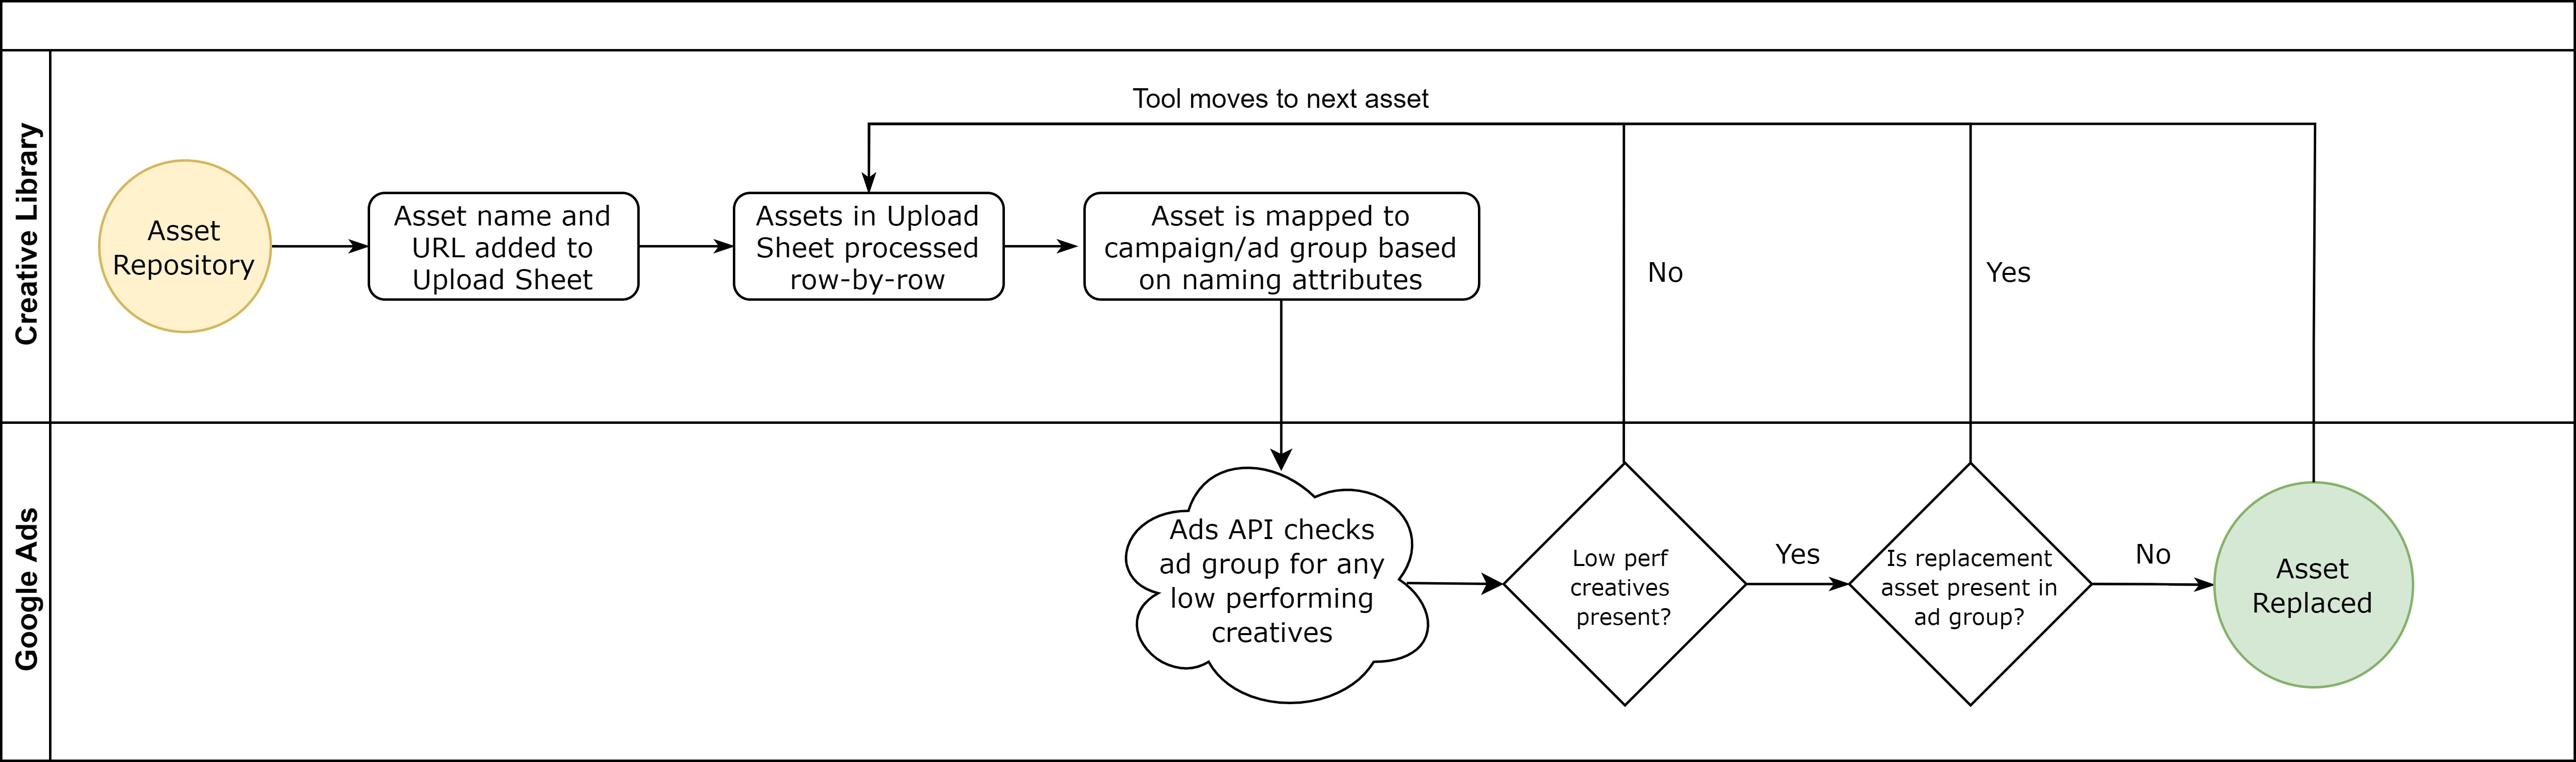
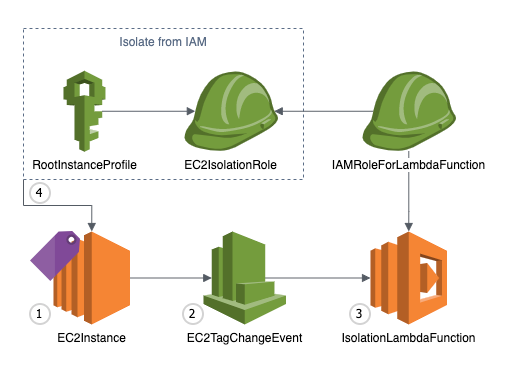
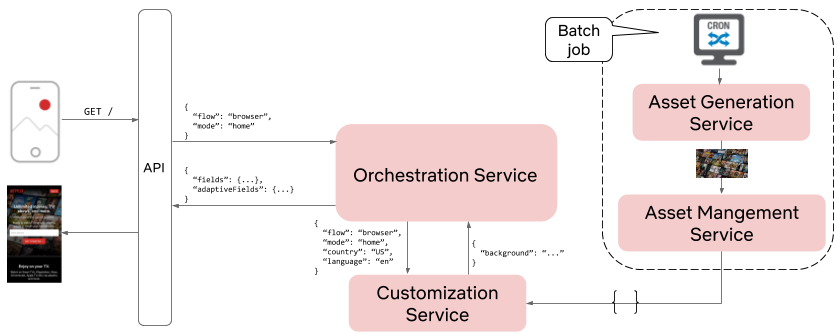
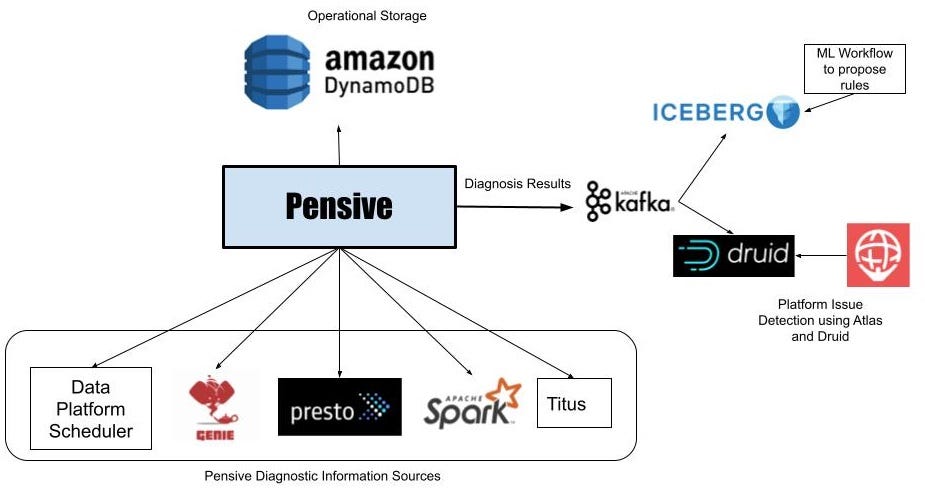
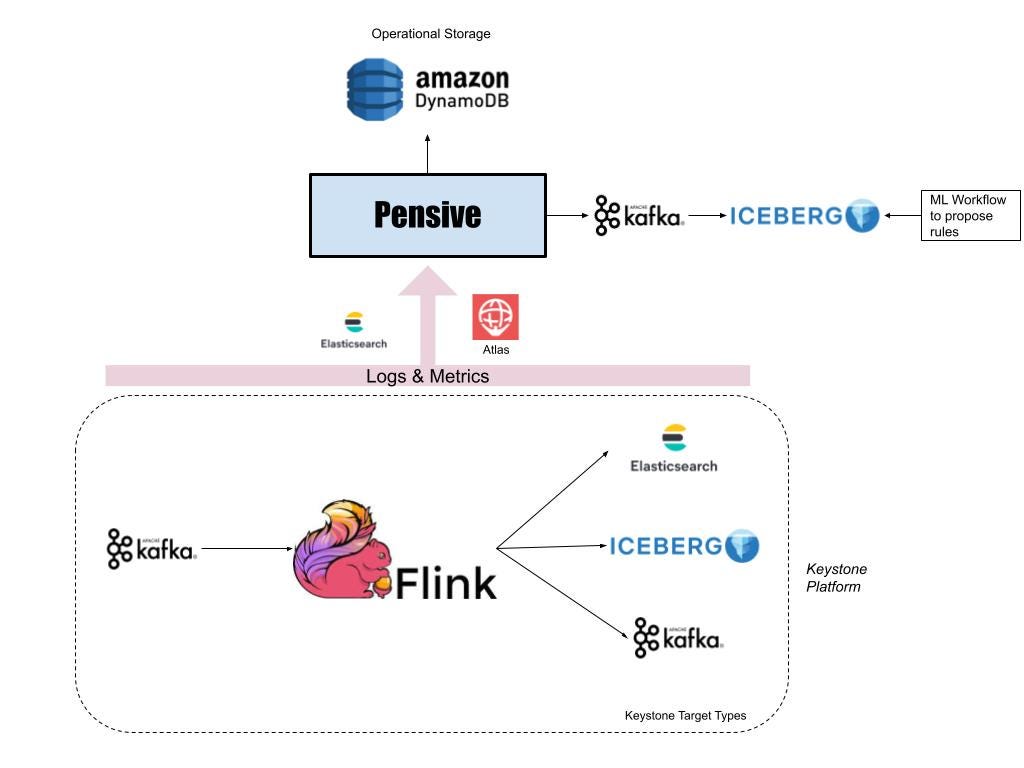
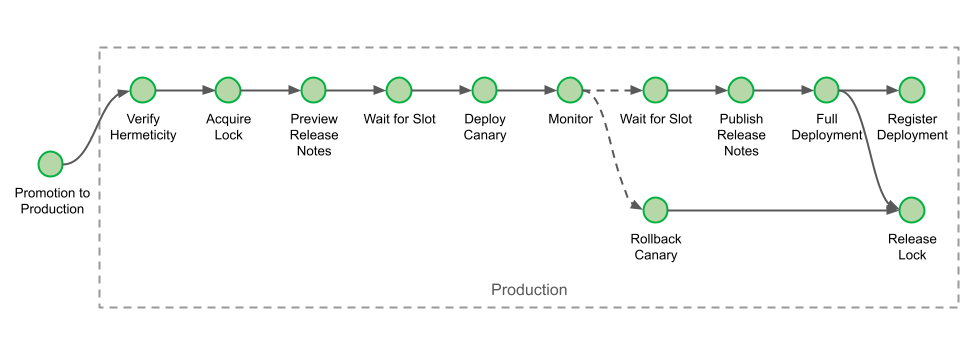
Figure 1 shows an overview of the EC2 forensic module factory solution workflow.
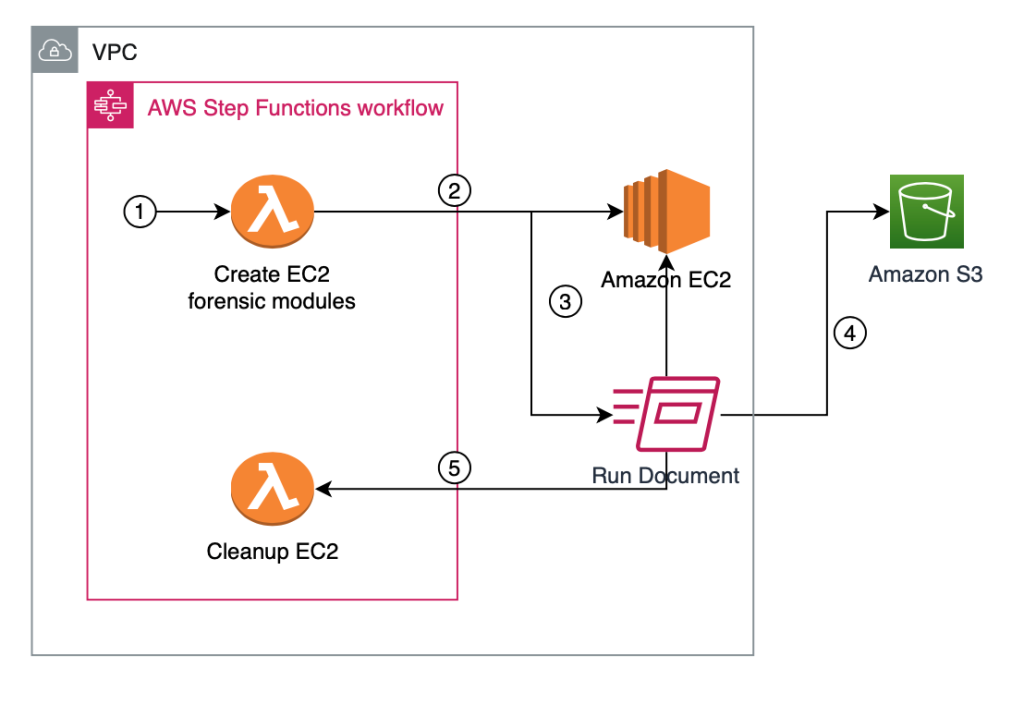
Figure 1: Automation to build forensic kernel modules for an Amazon Linux EC2 instance
The EC2 forensic module factory solution workflow in Figure 1 includes the following numbered steps:
- A Step Functions workflow is started, which creates a Step Functions task token and invokes the first Lambda function, createEC2module, to create EC2 forensic modules.
- A Step Functions task token is used to allow long-running processes to complete and to avoid a Lambda timeout error. The createEC2module function runs for approximately 9 minutes. The run time for the function can vary depending on any customizations to the createEC2module function or the SSM document.
- The createEC2module function launches an EC2 instance based on the Amazon Machine Image (AMI) provided.
- Once the EC2 instance is running, an SSM document is run, which includes the following steps:
- If a specific kernel version is provided in step 1, this kernel version will be installed on the EC2 instance. If no kernel version is provided, the default kernel version on the EC2 instance will be used to create the modules.
- If a specific kernel version was selected and installed, the system is rebooted to use this kernel version.
- The prerequisite build tools are installed, as well as the LiME and Volatility2 packages.
- The LiME kernel module and the Volatility2 profile are built.
- The kernel modules for LiME and Volatility2 are put into the S3 bucket.
- Upon completion, the Step Functions task token is sent to the Step Functions workflow to invoke the second cleanupEC2module Lambda function to terminate the EC2 instance that was launched in step 2.
Solution deployment
You can deploy the EC2 forensic module factory solution by using either the AWS Management Console or the AWS Cloud Development Kit (AWS CDK).
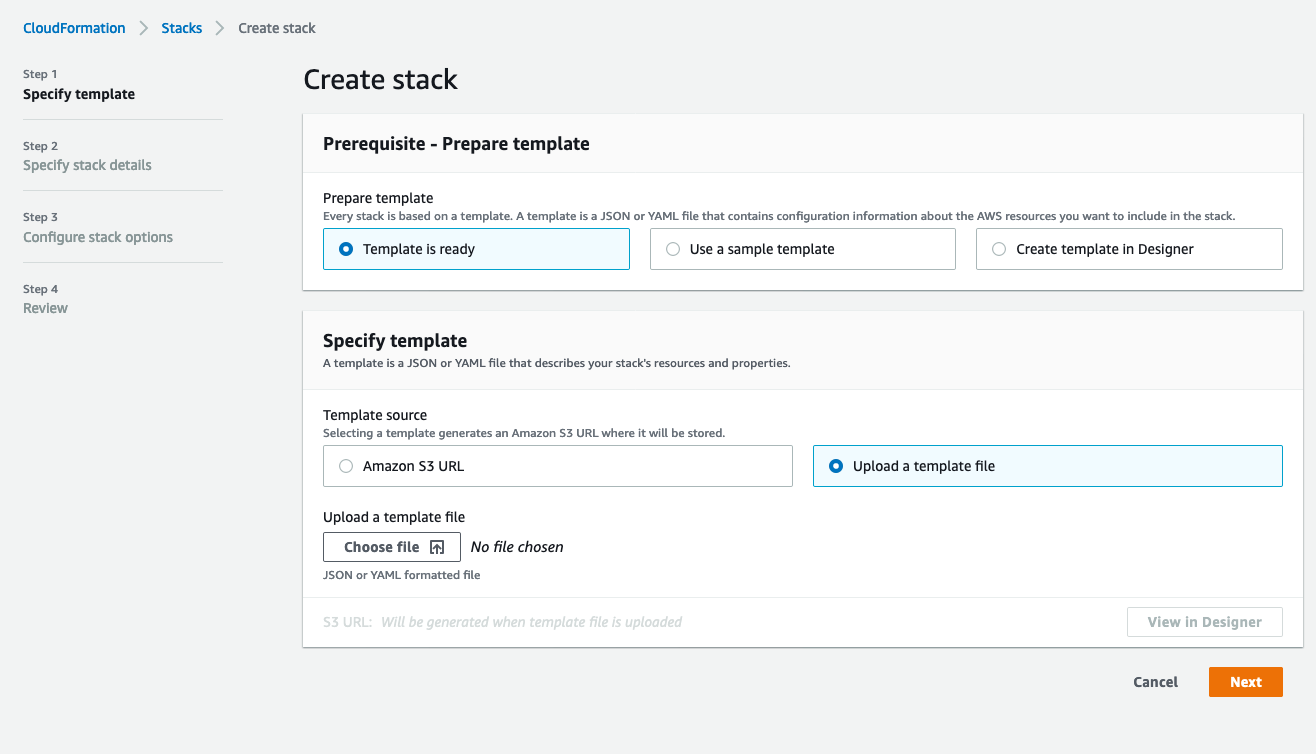
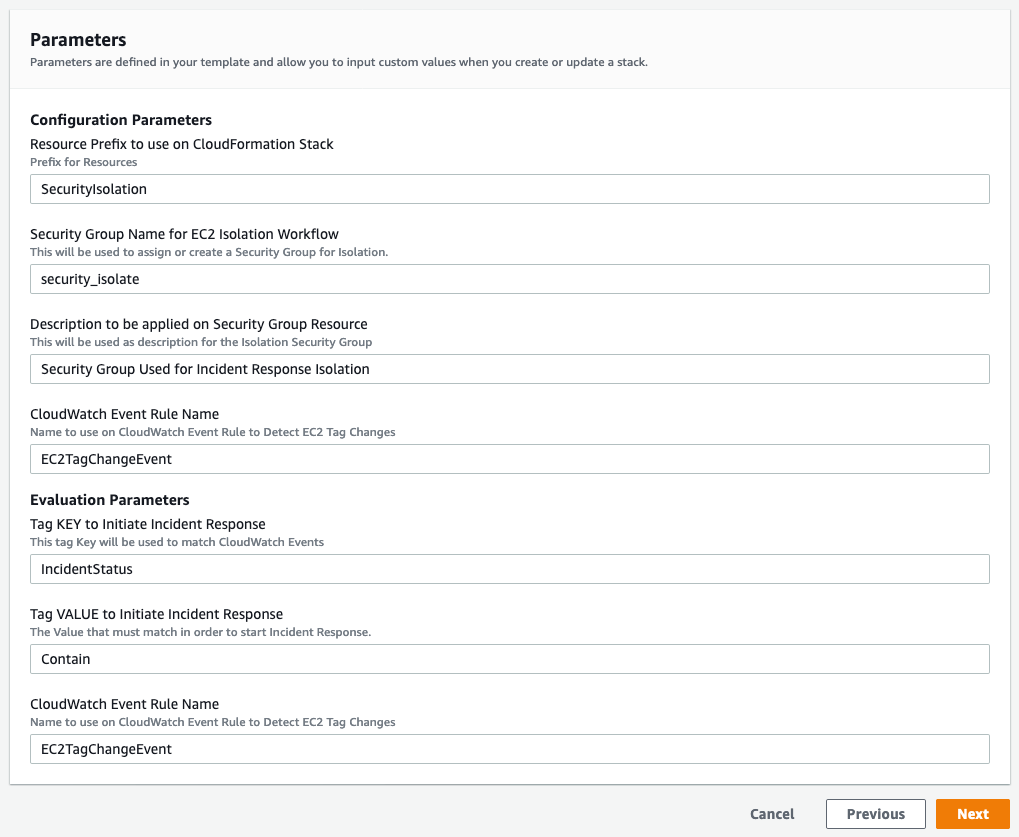
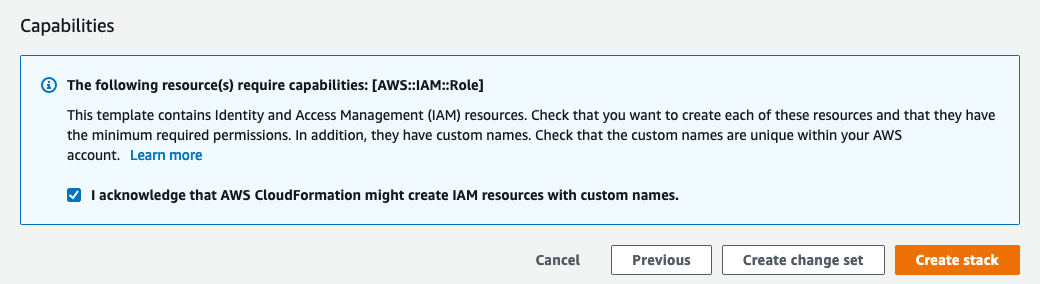
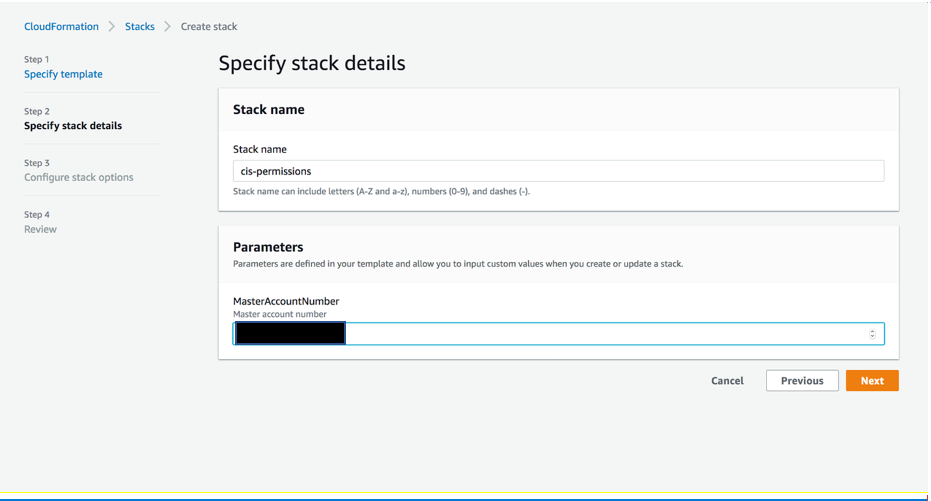
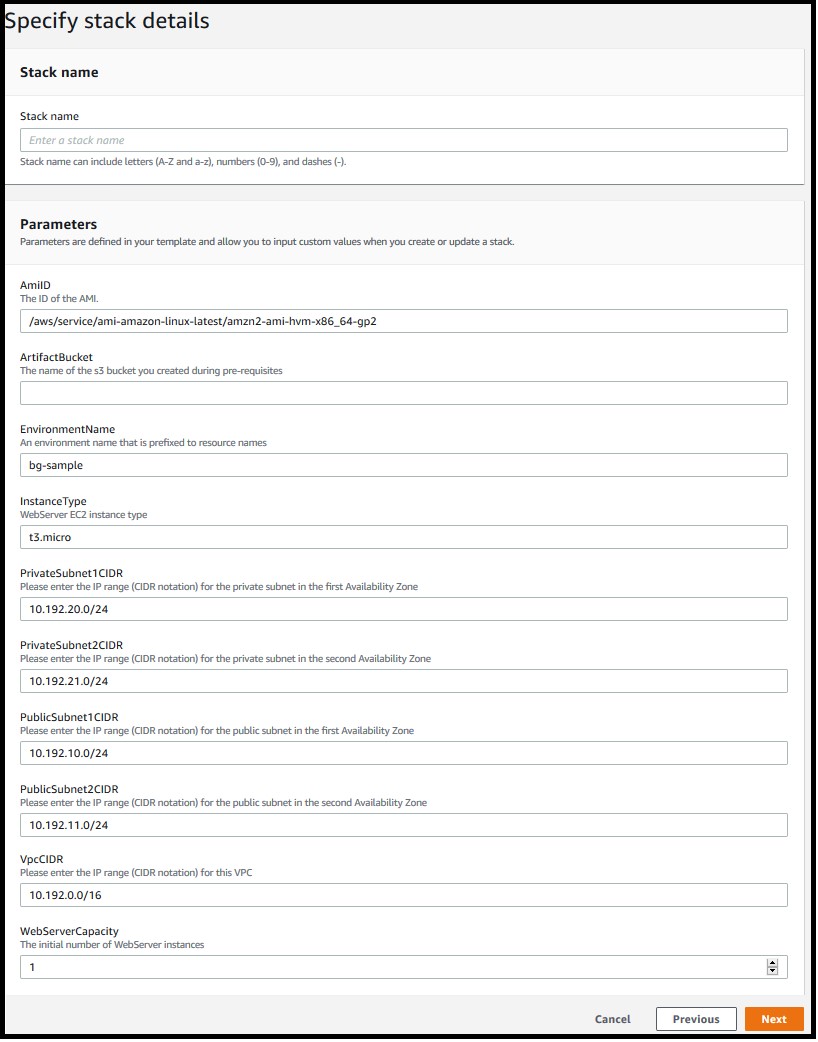
Option 1: Deploy the solution with AWS CloudFormation (console)
Sign in to your preferred security tooling account in the AWS Management Console, and choose the following Launch Stack button to open the AWS CloudFormation console pre-loaded with the template for this solution. It will take approximately 10 minutes for the CloudFormation stack to complete.
![]()
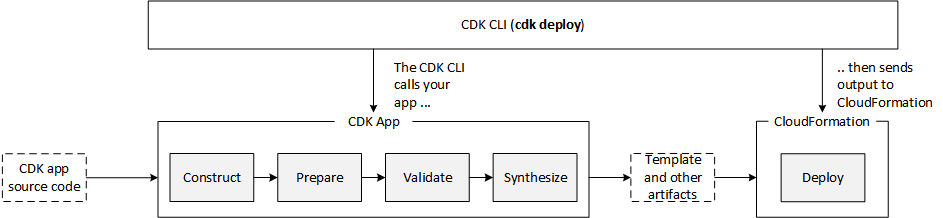
Option 2: Deploy the solution by using the AWS CDK
You can find the latest code for the EC2 forensic module factory solution in the ec2-forensic-module-factory GitHub repository, where you can also contribute to the sample code. For instructions and more information on using the AWS CDK, see Get Started with AWS CDK.
To deploy the solution by using the AWS CDK
- To build the app when navigating to the project’s root folder, use the following commands.
npm install -g aws-cdk
npm install - Run the following commands in your terminal while authenticated in your preferred security tooling AWS account. Be sure to replace <INSERT_AWS_ACCOUNT> with your account number, and replace <INSERT_REGION> with the AWS Region that you want the solution deployed to.
cdk bootstrap aws://<INSERT_AWS_ACCOUNT>/<INSERT_REGION>
 cdk deploy
Run the solution to build forensic kernel objects
Now that you’ve deployed the EC2 forensic module factory solution, you need to invoke the Step Functions workflow in order to create the forensic kernel objects. The following is an example of manually invoking the workflow, to help you understand what actions are being performed. These actions can also be integrated and automated with an EC2 incident response solution.
To manually invoke the workflow to create the forensic kernel objects (console)
- In the AWS Management Console, sign in to the account where the solution was deployed.
- In the AWS Step Functions console, select the state machine named create_ec2_volatile_memory_modules.
- Choose Start execution.
- At the input prompt, enter the following JSON values.
{
 "AMI_ID": "ami-0022f774911c1d690",
 "kernelversion":"kernel-4.14.104-95.84.amzn2.x86_64"
} - Choose Start execution to start the workflow, as shown in Figure 2.

Figure 2: Step Functions step input example to build custom kernel version using Amazon Linux 2 AMI ID

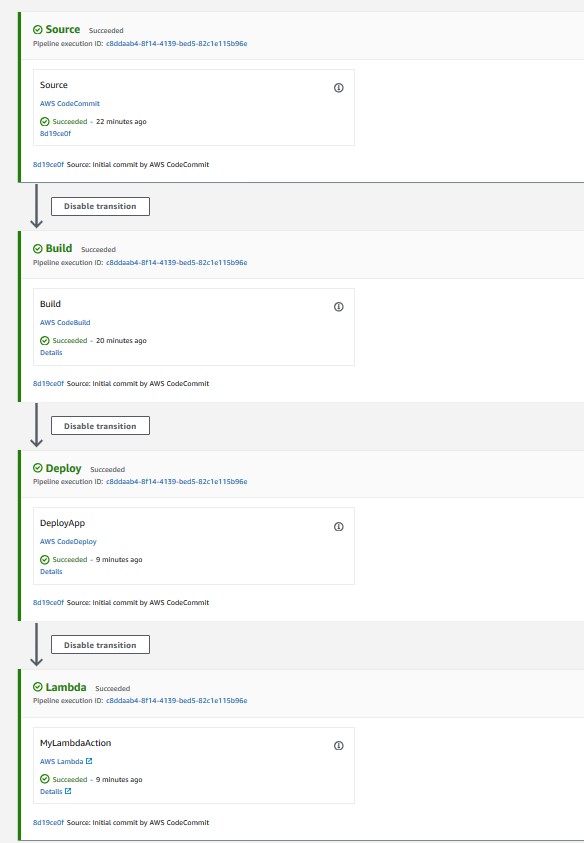
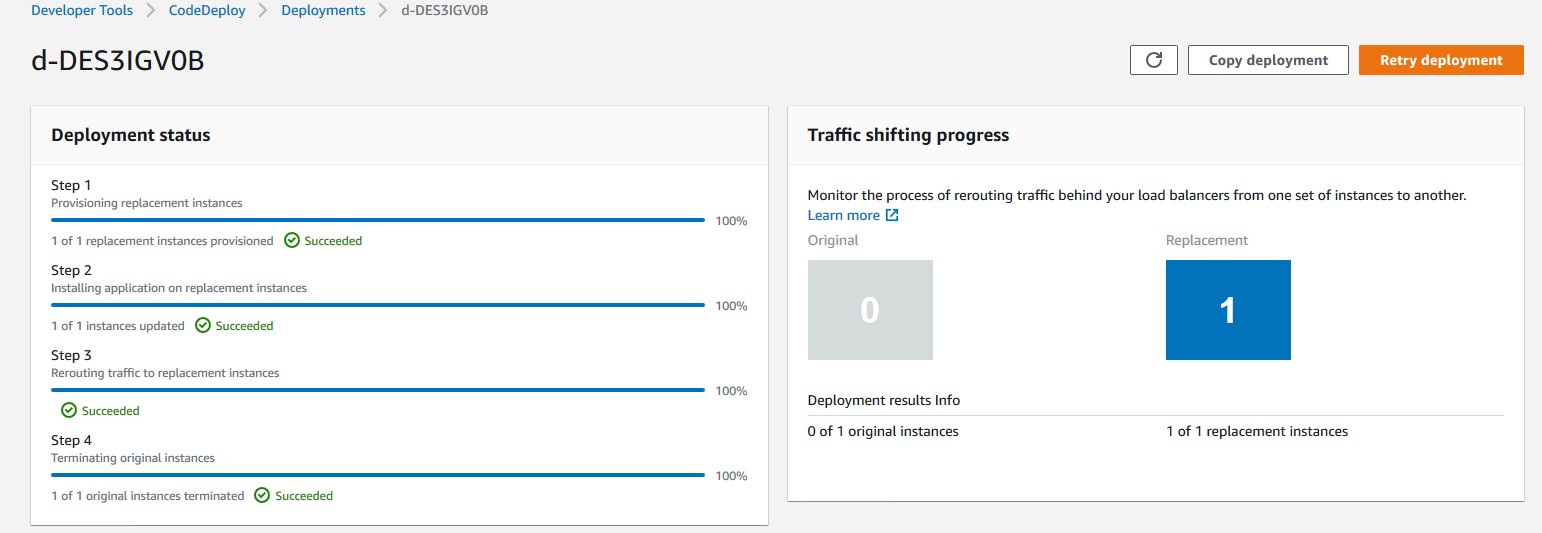
Workflow progress
You can use the AWS Management Console to follow the progress of the Step Functions workflow. If the workflow is successful, you should see the image when you view the status of the Step Functions workflow, as shown in Figure 3.

Figure 3: Step Functions workflow success example
Note: The Step Functions workflow run time depends on the commands that are being run in the SSM document. The example SSM document included in this post runs for approximately 9 minutes. For information about possible Step Functions errors, see Error handling in Step Functions.
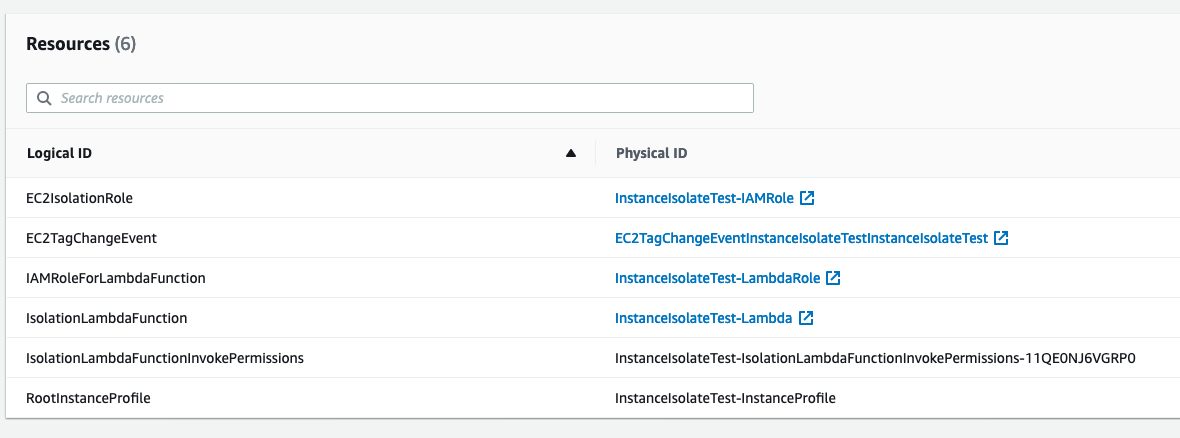
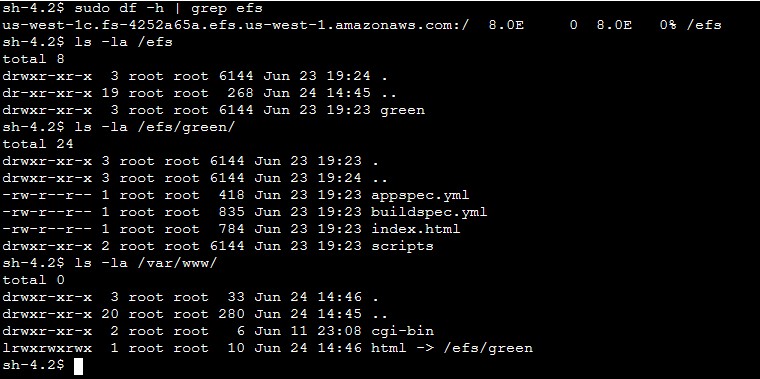
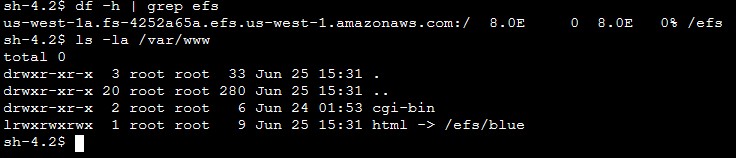
To verify that the artifacts are built
- After the Step Functions workflow has successfully completed, go to the S3 bucket that was provisioned in the EC2 forensic module factory solution.
- Look for two prefixes in the bucket for LiME and Volatility2, as shown in Figure 4.

Figure 4: S3 bucket prefix for forensic kernel modules
- Open each tool name prefix in S3 to find the actual module, such as in the following examples:
- LiME example: lime-4.14.104-95.84.amzn2.x86_64.ko
- Volatility2 example: 4.14.104-95.84.amzn2.x86_64.zip

Now that the objects have been created, the solution has successfully completed.
Incorporate forensic module builds into an EC2 AMI pipeline
Each organization has specific requirements for allowing application teams to use various EC2 AMIs, and organizations commonly implement an EC2 image pipeline using tools like EC2 Image Builder. EC2 Image Builder uses recipes to install and configure required components in the AMI before application teams can launch EC2 instances in their environment.
The EC2 forensic module factory solution we implemented here makes use of an existing EC2 instance AMI. As mentioned, the solution uses an SSM document to create forensic modules. The logic in the SSM document could be incorporated into your EC2 image pipeline to create the forensic modules and store them in an S3 bucket. S3 also allows additional layers of protection such as enforcing default bucket encryption with an AWS Key Management Service Customer Managed Key (CMK), verifying S3 object integrity with checksum, S3 Object Lock, and restrictive S3 bucket policies. These protections can help you to ensure that your forensic modules have not been modified and are only accessible by authorized entities.
It is important to note that incorporating forensic module creation into an EC2 AMI pipeline will build forensic modules for the specific kernel version used in that AMI. You would still need to employ this EC2 forensic module solution to build a specific forensic module version if it is missing from the S3 bucket where you are creating and storing these forensic modules. The need to do this can arise if the EC2 instance is updated after the initial creation of the AMI.
Incorporate the solution into existing EC2 incident response automation
There are many existing solutions to automate incident response workflow for quarantining and capturing forensic evidence for EC2 instances, but the majority of EC2 incident response automation solutions have a single dependency in common, which is the use of specific forensic modules for the target EC2 instance kernel version. The EC2 forensic module factory solution in this post enables you to be both proactive and reactive when building forensic kernel modules for your EC2 instances.
You can use the EC2 forensic module factory solution in two different ways:
- Ad-hoc – In this post, you walked through the solution by running the Step Functions workflow with specific parameters. You can do this to build a repository of kernel modules.
- Automated – Alternatively, you can incorporate this solution into existing automation by invoking the Step Functions workflow and passing the AMI ID and kernel version. An example could be the following:
- An existing EC2 incident response solution attempts to get the forensic modules to capture the volatile memory from an S3 bucket.
- If the specific kernel version is missing in the S3 bucket, the solution updates the automation to StartExecution on the create_ec2_volatile_memory_modules state machine.
- The Step Functions workflow builds the specific forensic modules.
- After the Step Functions workflow is complete, the EC2 incident response solution restarts its workflow to get the forensic modules to capture the volatile memory on the EC2 instance.
Now that you have the kernel modules, you can both capture the volatile memory by using LiME, and then conduct analysis on the memory dump by using a Volatility2 profile.
To capture and analyze volatile memory on the target EC2 instance (high-level steps)
- Copy the LiME module from the S3 bucket holding the module repository to the target EC2 instance.
- Capture the volatile memory by using the LiME module.
- Stream the volatile memory dump to a S3 bucket.
- Launch an EC2 forensic workstation instance, with Volatility2 installed.
- Copy the Volatility2 profile from the S3 bucket to the appropriate location.
- Copy the volatile memory dump to the EC2 forensic workstation.
- Run analysis on the volatile memory with Volatility2 by using the specific Volatility2 profile created for the target EC2 instance.
Automated self-service AWS solution
AWS has also released the Automated Forensics Orchestrator for Amazon EC2 solution that you can use to quickly set up and configure a dedicated forensics orchestration automation solution for your security teams. The Automated Forensics Orchestrator for Amazon EC2 allows you to capture and examine the data from EC2 instances and attached Amazon Elastic Block Store (Amazon EBS) volumes in your AWS environment. This data is collected as forensic evidence for analysis by the security team.
The Automated Forensics Orchestrator for Amazon EC2 creates the foundational components to enable the EC2 forensic module factory solution’s memory forensic acquisition workflow and forensic investigation and reporting service. Both the Automated Forensics Orchestrator for Amazon EC2, and the EC2 forensic module factory, are hosted in different GitHub projects. And you will need to reconcile the expected S3 bucket locations for the associated modules:
- Automated Forensics Orchestrator for Amazon EC2 modules: S3 bucket location for LiME and S3 bucket location for Volatility2
- EC2 forensic module factory modules: S3 bucket location for LiME and S3 bucket location for Volatility2
Customize the EC2 forensic module factory solution
The SSM document pulls open-source packages to build tools for the specific Linux kernel version. You can update the SSM document to your specific requirements for forensic analysis, including expanding support for other operating systems, versions, and tools.
You can also update the S3 object naming convention and object tagging, to allow external solutions to reference and copy the appropriate kernel module versions to enable the forensic workflow.
Clean up
If you deployed the EC2 forensic module factory solution by using the Launch Stack button in the AWS Management Console or the CloudFormation template ec2_module_factory_cfn, do the following to clean up:
- In the AWS CloudFormation console for the account and Region where you deployed the solution, choose the Ec2VolModules stack.
- Choose the option to Delete the stack.
If you deployed the solution by using the AWS CDK, run the following command.
cdk destroy
Conclusion
In this blog post, we walked you through the deployment and use of the EC2 forensic module factory solution to use AWS Step Functions, AWS Lambda, AWS Systems Manager, and Amazon EC2 to create specific versions of forensic kernel modules for Amazon Linux EC2 instances.
The solution provides a framework to create the foundational components required in an EC2 incident response automation solution. You can customize the solution to your needs to fit into an existing EC2 automation, or you can deploy this solution in tandem with the Automated Forensics Orchestrator for Amazon EC2.
If you have feedback about this post, submit comments in the Comments section below. If you have any questions about this post, start a thread on re:Post.
Want more AWS Security news? Follow us on Twitter.


 Rakesh Singh
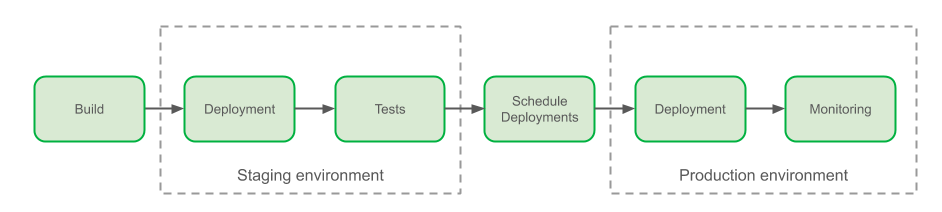
 ) is represented in the graph above. It can be converted into the equation below: