Storage, storage, storage! Last week, we celebrated 18 years of innovation on Amazon Simple Storage Service (Amazon S3) at AWS Pi Day 2024. Amazon S3 mascot Buckets joined the celebrations and had a ton of fun! The 4-hour live stream was packed with puns, pie recipes powered by PartyRock, demos, code, and discussions about generative AI and Amazon S3.
AWS Pi Day 2024 — Twitch live stream on March 14, 2024
Up to 40 percent faster stack creation with AWS CloudFormation — AWS CloudFormation now creates stacks up to 40 percent faster and has a new event called CONFIGURATION_COMPLETE. With this event, CloudFormation begins parallel creation of dependent resources within a stack, speeding up the whole process. The new event also gives users more control to shortcut their stack creation process in scenarios where a resource consistency check is unnecessary. To learn more, read this AWS DevOps Blog post.
Amazon SageMaker Canvas extends its model registry integration — SageMaker Canvas has extended its model registry integration to include time series forecasting models and models fine-tuned through SageMaker JumpStart. Users can now register these models to the SageMaker Model Registry with just a click. This enhancement expands the model registry integration to all problem types supported in Canvas, such as regression/classification tabular models and CV/NLP models. It streamlines the deployment of machine learning (ML) models to production environments. Check the Developer Guide for more information.
Amazon S3 Connector for PyTorch — The Amazon S3 Connector for PyTorch now lets PyTorch Lightning users save model checkpoints directly to Amazon S3. Saving PyTorch Lightning model checkpoints is up to 40 percent faster with the Amazon S3 Connector for PyTorch than writing to Amazon Elastic Compute Cloud (Amazon EC2) instance storage. You can now also save, load, and delete checkpoints directly from PyTorch Lightning training jobs to Amazon S3. Check out the open source project on GitHub.
AWS open source news and updates — My colleague Ricardo writes this weekly open source newsletter in which he highlights new open source projects, tools, and demos from the AWS Community.
Upcoming AWS events Check your calendars and sign up for these AWS events:
AWS at NVIDIA GTC 2024 — The NVIDIA GTC 2024 developer conference is taking place this week (March 18–21) in San Jose, CA. If you’re around, visit AWS at booth #708 to explore generative AI demos and get inspired by AWS, AWS Partners, and customer experts on the latest offerings in generative AI, robotics, and advanced computing at the in-booth theatre. Check out the AWS sessions and request 1:1 meetings.
AWS Summits — It’s AWS Summit season again! The first one is Paris (April 3), followed by Amsterdam (April 9), Sydney (April 10–11), London (April 24), Berlin (May 15–16), and Seoul (May 16–17). AWS Summits are a series of free online and in-person events that bring the cloud computing community together to connect, collaborate, and learn about AWS.
AWS re:Inforce — Join us for AWS re:Inforce (June 10–12) in Philadelphia, PA. AWS re:Inforce is a learning conference focused on AWS security solutions, cloud security, compliance, and identity. Connect with the AWS teams that build the security tools and meet AWS customers to learn about their security journeys.
At re:Invent in 2023, AWS announced Infrastructure as Code (IaC) support for Amazon CodeWhisperer. CodeWhisperer is an AI-powered productivity tool for the IDE and command line that helps software developers to quickly and efficiently create cloud applications to run on AWS. Languages currently supported for IaC are YAML and JSON for AWS CloudFormation, Typescript and Python for AWS CDK, and HCL for HashiCorp Terraform. In addition to providing code recommendations in the editor, CodeWhisperer also features a security scanner that alerts the developer to potentially insecure infrastructure code, and offers suggested fixes than can be applied with a single click.
In this post, we will walk you through some common scenarios and show you how to get the most out of CodeWhisperer in the IDE. CodeWhisperer is supported by several IDEs, such as Visual Studio Code and JetBrains. For the purposes of this post, we’ll focus on Visual Studio Code. There are a few things that you need to follow along with the examples, listed in the prerequisites section below.
Now that you have the toolkit configured, open a new source file with the yaml extension. Since YAML files can represent a wide variety of different configuration file types, it helps to add the AWSTemplateFormatVersion: '2010-09-09' header to the file to let CodeWhisperer know that you are editing a CloudFormation file. Just typing the first few characters of that header is likely to result in a recommendation from CodeWhisperer. Press TAB to accept recommendations and Escape to ignore them.
AWSTemplateFormatVersion header
If you have a good idea about the various resources you want to include in your template, include them in a top level Description field. This will help CodeWhisperer to understand the relationships between the resources you will create in the file. In the example below, we describe the stack we want as a “VPC with public and private subnets”. You can be more descriptive if you want, using a multi-line YAML string to add more specific details about the resources you want to create.
Creating a CloudFormation template with a description
After accepting that recommendation for the parameters, you can continue to create resources.
Creating CloudFormation resources
You can also trigger recommendations with inline comments and descriptive logical IDs if you want to create one resource at a time. The more code you have in the file, the more CodeWhisperer will understand from context what you are trying to achieve.
CDK
It’s also possible to create CDK code using CodeWhisperer. In the example below, we started with a CDK project using cdk init, wrote a few lines of code to create a VPC in a TypeScript file, and CodeWhisperer proposed some code suggestions using what we started to write. After accepting the suggestion, it is possible to customize the code to fit your needs. CodeWhisperer will learn from your coding style and make more precise suggestions as you add more code to the project.
Create a CDK stack
You can choose whether you want to get suggestions that include code with references with the professional version of CodeWhisperer. If you choose to get the references, you can find them in the Code Reference Log. These references let you know when the code recommendation was a near exact match for code in an open source repository, allowing you to inspect the license and decide if you want to use that code or not.
References
Terraform HCL
After a close collaboration between teams at Hashicorp and AWS, Terraform HashiCorp Configuration Language (HCL) is also supported by CodeWhisperer. CodeWhisperer recommendations are triggered by comments in the file. In this example, we repeat a prompt that is similar to what we used with CloudFormation and CDK.
Terraform code suggestion
Security Scanner
In addition to CodeWhisperer recommendations, the toolkit configuration also includes a built in security scanner. Considering that the resulting code can be edited and combined with other preexisting code, it’s good practice to scan the final result to see if there are any best-practice security recommendations that can be applied.
Expand the CodeWhisperer section of the AWS Toolkit to see the “Run Security Scan” button. Click it to initiate a scan, which might take up to a minute to run. In the example below, we defined an S3 bucket that can be read by anyone on the internet.
Security scanner
Once the security scan completes, the code with issues is underlined and each suggestion is added to the ‘Problems’ tab. Click on any of those to get more details.
Scan results
CodeWhisperer provides a clickable link to get more information about the vulnerability, and what you can do to fix it.
Scanner Link
Conclusion
The integration of generative AI tools like Amazon CodeWhisperer are transforming the landscape of cloud application development. By supporting Infrastructure as Code (IaC) languages such as CloudFormation, CDK, and Terraform HCL, CodeWhisperer is expanding its reach beyond traditional development roles. This advancement is pivotal in merging runtime and infrastructure code into a cohesive unit, significantly enhancing productivity and collaboration in the development process. The inclusion of IaC enables a broader range of professionals, especially Site Reliability Engineers (SREs), to actively engage in application development, automating and optimizing infrastructure management tasks more efficiently.
CodeWhisperer’s capability to perform security scans on the generated code aligns with the critical objectives of system reliability and security, essential for both developers and SREs. By providing insights into security best practices, CodeWhisperer enables robust and secure infrastructure management on the AWS cloud. This makes CodeWhisperer a valuable tool not just for developers, but as a comprehensive solution that bridges different technical disciplines, fostering a collaborative environment for innovation in cloud-based solutions.
Bio
Eric Beard is a Solutions Architect at AWS specializing in DevOps, CI/CD, and Infrastructure as Code, the author of the AWS Sysops Cookbook, and an editor for the AWS DevOps blog channel. When he’s not helping customers to design Well-Architected systems on AWS, he is usually playing tennis or watching tennis.
Amar Meriche is a Sr Technical Account Manager at AWS in Paris. He helps his customers improve their operational posture through advocacy and guidance, and is an active member of the DevOps and IaC community at AWS. He’s passionate about helping customers use the various IaC tools available at AWS following best practices.
AWS CloudFormation customers often inquire about the behind-the-scenes process of provisioning resources and why certain resources or stacks take longer to provision compared to the AWS Management Console or AWS Command Line Interface (AWS CLI). In this post, we will delve into the various factors affecting resource provisioning in CloudFormation, specifically focusing on resource stabilization, which allows CloudFormation and other Infrastructure as Code (IaC) tools to ensure resilient deployments. We will also introduce a new optimistic stabilization strategy that improves CloudFormation stack deployment times by up to 40% and provides greater visibility into resource provisioning through the new CONFIGURATION_COMPLETE status.
AWS CloudFormation is an IaC service that allows you to model your AWS and third-party resources in template files. By creating CloudFormation stacks, you can provision and manage the lifecycle of the template-defined resources manually via the AWS CLI, Console, AWS SAM, or automatically through an AWS CodePipeline, where CLI and SAM can also be leveraged or through Git sync. You can also use AWS Cloud Development Kit (AWS CDK) to define cloud infrastructure in familiar programming languages and provision it through CloudFormation, or leverage AWS Application Composer to design your application architecture, visualize dependencies, and generate templates to create CloudFormation stacks.
Deploying a CloudFormation stack
Let’s examine a deployment of a containerized application using AWS CloudFormation to understand CloudFormation’s resource provisioning.
Figure 1. Sample application architecture to deploy an ECS service
For deploying a containerized application, you need to create an Amazon ECS service. To set up the ECS service, several key resources must first exist: an ECS cluster, an Amazon ECR repository, a task definition, and associated Amazon VPC infrastructure such as security groups and subnets. Since you want to manage both the infrastructure and application deployments using AWS CloudFormation, you will first define a CloudFormation template that includes: an ECS cluster resource (AWS::ECS::Cluster), a task definition (AWS::ECS::TaskDefinition), an ECR repository (AWS::ECR::Repository), required VPC resources like subnets (AWS::EC2::Subnet) and security groups (AWS::EC2::SecurityGroup), and finally, the ECS Service (AWS::ECS::Service) itself. When you create the CloudFormation stack using this template, the ECS service (AWS::ECS::Service) is the final resource created, as it waits for the other resources to finish creation. This brings up the concept of Resource Dependencies.
Resource Dependency:
In CloudFormation, resources can have dependencies on other resources being created first. There are two types of resource dependencies:
Implicit: CloudFormation automatically infers dependencies when a resource uses intrinsic functions to reference another resource. These implicit dependencies ensure the resources are created in the proper order.
Explicit: Dependencies can be directly defined in the template using the DependsOn attribute. This allows you to customize the creation order of resources.
The following template snippet shows the ECS service’s dependencies visualized in a dependency graph:
In the above template snippet, the ECS Service (AWS::ECS::Service) resource has an explicit dependency on the PublicRoute resource, specified using the DependsOn attribute. The ECS service also has implicit dependencies on the ECSCluster, SecurityGroup, PublicSubnet, and TaskDefinition resources. Even without an explicit DependsOn, CloudFormation understands that these resources must be created before the ECS service, since the service references them using the Ref intrinsic function. Now that you understand how CloudFormation creates resources in a specific order based on their definition in the template file, let’s look at the time taken to provision these resources.
Resource Provisioning Time:
The total time for CloudFormation to provision the stack depends on the time required to create each individual resource defined in the template. The provisioning duration per resource is determined by several time factors:
Engine Time: CloudFormation Engine Time refers to the duration spent by the service reading and persisting data related to a resource. This includes the time taken for operations like parsing and interpreting the CloudFormation template, and for the resolution of intrinsic functions like Fn::GetAtt and Ref.
Resource Creation Time: The actual time an AWS service requires to create and configure the resource. This can vary across resource types provisioned by the service.
Resource Stabilization Time: The duration required for a resource to reach a usable state after creation.
What is Resource Stabilization?
When provisioning AWS resources, CloudFormation makes the necessary API calls to the underlying services to create the resources. After creation, CloudFormation then performs eventual consistency checks to ensure the resources are ready to process the intended traffic, a process known as resource stabilization. For example, when creating an ECS service in the application, the service is not readily accessible immediately after creation completes (after creation time). To ensure the ECS service is available to use, CloudFormation performs additional verification checks defined specifically for ECS service resources. Resource stabilization is not unique to CloudFormation and must be handled to some degree by all IaC tools.
Stabilization Criteria and Stabilization Timeout
For CloudFormation to mark a resource as CREATE_COMPLETE, the resource must meet specific stabilization criteria called stabilization parameters. These checks validate that the resource is not only created but also ready for use.
If a resource fails to meet its stabilization parameters within the allowed stabilization timeout period, CloudFormation will mark the resource status as CREATE_FAILED and roll back the operation. Stabilization criteria and timeouts are defined uniquely for each AWS resource supported in CloudFormation by the service, and are applied during both resource create and update workflows.
AWS CloudFormation vs AWS CLI to provision resources
Now, you will create a similar ECS service using the AWS CLI. You can use the following AWS CLI command to deploy an ECS service using the same task definition, ECS cluster and VPC resources created earlier using CloudFormation.
The following snippet from the output of the above command shows that the ECS Service has been successfully created and its status is ACTIVE.
Figure 3. Snapshot of the ECS service API call
However, when you navigate to the ECS console and review the service, tasks are still in the Pending state, and you are unable to access the application.
Figure 4. ECS console view
You have to wait for the service to reach a steady state before you can successfully access the application.
Figure 5. ECS service events from the AWS console
When you create the same ECS service using AWS CloudFormation, the service is accessible immediately after the resource reaches a status of CREATE_COMPLETE in the stack. This reliable availability is due to CloudFormation’s resource stabilization process. After initially creating the ECS service, CloudFormation waits and continues calling the ECS DescribeServices API action until the service reaches a steady state. Once the ECS service passes its consistency checks and is fully ready for use, only then will CloudFormation mark the resource status as CREATE_COMPLETE in the stack. This creation and stabilization orchestration allows you to access the service right away without any further delays.
The following is an AWS CloudTrail snippet of CloudFormation performing DescribeServices API calls during Stabilization:
Figure 6. Snapshot of AWS CloudTrail event
By handling resource stabilization natively, CloudFormation saves you the extra coding effort and complexity of having to implement custom status checks and availability polling logic after resource creation. You would have to develop this additional logic using tools like the AWS CLI or API across all the infrastructure and application resources. With CloudFormation’s built-in stabilization orchestration, you can deploy the template once and trust that the services will be fully ready after creation, allowing you to focus on developing your application functionality.
Evolution of Stabilization Strategy
CloudFormation’s stabilization strategy couples resource creation with stabilization such that the provisioning of a resource is not considered COMPLETE until stabilization is complete.
Historic Stabilization Strategy
For resources that have no interdependencies, CloudFormation starts the provisioning process in parallel. However, if a resource depends on another resource, CloudFormation will wait for the entire resource provisioning operation of the dependency resource to complete before starting the provisioning of the dependent resource.
The diagram above shows a deployment of some of the ECS application resources that you deploy using AWS CloudFormation. The Task Definition (AWS::ECS::TaskDefinition) resource depends on the ECR Repository (AWS::ECR::Repository) resource, and the ECS Service (AWS::ECS:Service) resource depends on both the Task Definition and ECS Cluster (AWS::ECS::Cluster) resources. The ECS Cluster resource has no dependencies defined. CloudFormation initiates creation of the ECR Repository and ECS Cluster resources in parallel. It then waits for the ECR Repository to complete consistency checks before starting provisioning of the Task Definition resource. Similarly, creation of the ECS Service resource begins only when the Task Definition and ECS Cluster resources have been created and are ready. This sequential approach ensures safety and stability but causes delays. CloudFormation strictly deploys dependent resources one after the other, slowing down deployment of the entire stack. As the number of interdependent resources grows, the overall stack deployment time increases, creating a bottleneck that prolongs the whole stack operation.
New Optimistic Stabilization Strategy
To improve stack provisioning times and deployment performance, AWS CloudFormation recently launched a new optimistic stabilization strategy. The optimistic strategy can reduce customer stack deployment duration by up to 40%. It allows dependent resources to be created in parallel. This concurrent resource creation helps significantly improve deployment speed.
Figure 8. CloudFormation’s new optimistic stabilization strategy
The diagram above shows deployment of the same 4 resources discussed in the historic strategy. The Task Definition (AWS::ECS::TaskDefinition) resource depends on the ECR Repository (AWS::ECR::Repository) resource, and the ECS Service (AWS::ECS:Service) resource depends on both the Task Definition and ECS Cluster (AWS::ECS::Cluster) resources. The ECS Cluster resource has no dependencies defined. CloudFormation initiates creation of the ECR Repository and ECS Cluster resources in parallel. Then, instead of waiting for the ECR Repository to complete consistency checks, it starts creating the Task Definition when the ECR Repository completes creation, but before stabilization is complete. Similarly, creation of the ECS Service resource begins after Task Definition and ECS Cluster creation. The change was made because not all resources require their dependent resources to complete consistency checks before starting creation. If the ECS Service fails to provision because the Task Definition or ECS Cluster resources are still undergoing consistency checks, CloudFormation will wait for those dependencies to complete their consistency checks before attempting to create the ECS Service again.
Figure 9. CloudFormation’s new stabilization strategy with the retry capability
This parallel creation of dependent resources with automatic retry capabilities results in faster deployment times compared to the historical linear resource provisioning strategy. The Optimistic stabilization strategy currently applies only to create workflows with resources that have implicit dependencies. For resources with an explicit dependency, CloudFormation leverages the historic strategy in deploying resources.
Improved Visibility into Resource Provisioning
When creating a CloudFormation stack, a resource can sometimes take longer to provision, making it appear as if it’s stuck in an IN_PROGRESS state. This can be because CloudFormation is waiting for the resource to complete consistency checks during its resource stabilization step. To improve visibility into resource provisioning status, CloudFormation has introduced a new “CONFIGURATION_COMPLETE” event. This event is emitted at both the individual resource level and the overall stack level during create workflow when resource(s) creation or configuration is complete, but stabilization is still in progress.
Figure 10. CloudFormation stack events of the ECS Application
The above diagram shows the snapshot of stack events of the ECS application’s CloudFormation stack named ECSApplication. Observe the events from the bottom to top:
At 10:46:08 UTC-0600, ECSService (AWS::ECS::Service) resource creation was initiated.
At 10:46:09 UTC-0600, the ECSService has CREATE_IN_PROGRESS status in the Status tab and CONFIGURATION_COMPLETE status in the Detailed status tab, meaning the resource was successfully created and the consistency check was initiated.
At 10:46:09 UTC-0600, the stack ECSApplication has CREATE_IN_PROGRESS status in the Status tab and CONFIGURATION_COMPLETE status in the Detailed status tab, meaning all the resources in the ECSApplication stack are successfully created and are going through stabilization. This stack level CONFIGURATION_COMPLETE status can also be viewed in the stack’s Overview tab.
Figure 11. CloudFormation Overview tab for the ECSApplication stack
At 10:47:09 UTC-0600, the ECSService has CREATE_COMPLETE status in the Status tab, meaning the service is created and completed consistency checks.
At 10:47:10 UTC-0600, ECSApplication has CREATE_COMPLETE status in the Status tab, meaning all the resources are successfully created and completed consistency checks.
Conclusion:
In this post, I hope you gained some insights into how CloudFormation deploys resources and the various time factors that contribute to the creation of a stack and its resources. You also took a deeper look into what CloudFormation does under the hood with resource stabilization and how it ensures the safe, consistent, and reliable provisioning of resources in critical, high-availability production infrastructure deployments. Finally, you learned about the new optimistic stabilization strategy to shorten stack deployment times and improve visibility into resource provisioning.
Happy Lunar New Year! Wishing you a year filled with joy, success, and endless opportunities! May the Year of the Dragon bring uninterrupted connections and limitless growth
In case you missed it, here’s outstanding news you need to know as you plan your year in early 2024.
Last Week’s Launches Here are some launches that got my attention:
A new Local Zone in Houston, Texas – Local Zones are an AWS infrastructure deployment that places compute, storage, database, and other select services closer to large population, industry, and IT centers where no AWS Region exists. AWS Local Zones are available in the US in 15 other metro areas and globally in an additional 17 metros areas, allowing you to deliver low-latency applications to end users worldwide. You can enable the new Local Zone in Houston (us-east-1-iah-2a) from the Zones tab in the Amazon EC2 console settings.
AWS CloudFormation IaC generator – You can generate a template using AWS resources provisioned in your account that are not already managed by CloudFormation. With this launch, you can onboard workloads to Infrastructure as Code (IaC) in minutes, eliminating weeks of manual effort. You can then leverage the IaC benefits of automation, safety, and scalability for the workloads. Use the template to import resources into CloudFormation or replicate resources in a new account or Region. See the user guide and blog post to learn more.
A new look-and-feel of Amazon Bedrock console – Amazon Bedrock now offers an enhanced console experience with updated UI improves usability, responsiveness, and accessibility with more seamless support for dark mode. To get started with the new experience, visit the Amazon Bedrock console.
One-click WAF integration on ALB – Application Load Balancer (ALB) now supports console integration with AWS WAF that allows you to secure your applications behind ALB with a single click. This integration enables AWS WAF protections as a first line of defense against common web threats for your applications that use ALB. You can use this one-click security protection provided by AWS WAF from the integrated services section of the ALB console for both new and existing load balancers.
Up to 49% price reduction for AWS Fargate Windows containers on Amazon ECS – Windows containers running on Fargate are now billed per second for infrastructure and Windows Server licenses that their containerized application requests. Along with the infrastructure pricing for on-demand, we are also reducing the minimum billing duration for Windows containers to 5 minutes (from 15 minutes) for any Fargate Windows tasks starting February 1st, 2024 (12:00am UTC). The infrastructure pricing and minimum billing period changes will automatically reflect in your monthly AWS bill. For more information on the specific price reductions, see our pricing page.
Introducing Amazon Data Firehose – We are renaming Amazon Kinesis Data Firehose to Amazon Data Firehose. Amazon Data Firehose is the easiest way to capture, transform, and deliver data streams into Amazon S3, Amazon Redshift, Amazon OpenSearch Service, Splunk, Snowflake, and other 3rd party analytics services. The name change is effective in the AWS Management Console, documentations, and product pages.
Other AWS News Some other updates and news that you might have missed:
NFL’s digital athlete in the Super Bowl – AWS is working with the National Football League (NFL) to take player health and safety to the next level. Using AI and machine learning, they are creating a precise picture of each player in training, practice, and games. You could see this technology in action, especially with the Super Bowl on the last Sunday!
Amazon’s commiting the responsible AI – On February 7, Amazon joined the U.S. Artificial Intelligence Safety Institute Consortium, established by the National Institute of Standards of Technology (NIST), to further our government and industry collaboration to advance safe and secure artificial intelligence (AI). Amazon will contribute compute credits to help develop tools to evaluate AI safety and help the institute set an interoperable and trusted foundation for responsible AI development and use.
Compliance updates in South Korea – AWS has completed the 2023 South Korea Cloud Service Providers (CSP) Safety Assessment Program, also known as the Regulation on Supervision on Electronic Financial Transactions (RSEFT) Audit Program. AWS is committed to helping our customers adhere to applicable regulations and guidelines, and we help ensure that our financial customers have a hassle-free experience using the cloud. Also, AWS has successfully renewed certification under the Korea Information Security Management System (K-ISMS) standard (effective from December 16, 2023, to December 15, 2026).
Join AWS Cloud Clubs Captains – AWS Cloud Clubs are student-led user groups for post-secondary level students and independent learners. Interested in founding or co-founding a Cloud Club in your university or region? We are accepting applications from February 5-18, 2024.
Upcoming AWS Events Check your calendars and sign up for upcoming AWS events:
AWS Innovate AI/ML and Data Edition – Join our free online conference to learn how you and your organization can leverage the latest advances in generative AI. You can register upcoming AWS Innovate Online event that fits your timezone in Asia Pacific & Japan (February 22), EMEA (February 29), and Americas (March 14).
AWS Public Sector events – Join us at the AWS Public Sector Symposium Brussels (March 12) to discover how the AWS Cloud can help you improve resiliency, develop sustainable solutions, and achieve your mission. AWS Public Sector Day London (March 19) gathers professionals from government, healthcare, and education sectors to tackle pressing challenges in United Kingdom public services.
Kicking off AWS Global Summits– AWS Summits are a series of free online and in-person events that bring the cloud computing community together to connect, collaborate, and learn about AWS. Below is a list of available AWS Summit events taking place in April:
Last week’s launches Here are some launches that got my attention during the previous week.
Amazon Q data integration in AWS Glue (Preview) – Now you can use natural language to ask Amazon Q to author jobs, troubleshoot issues, and answer questions about AWS Glue and data integration. Amazon Q was launched in preview at AWS re:invent 2023, and is a generative AI–powered assistant to help you solve problems, generate content, and take action.
General availability of CDK Migrate – CDK Migrate is a component of the AWS Cloud Development Kit (CDK) that enables you to migrate AWS CloudFormation templates, previously deployed CloudFormation stacks, or resources created outside of Infrastructure as Code (IaC) into a CDK application. This feature was launched alongside the CloudFormation IaC Generator to give you an end-to-end experience that enables you to create an IaC configuration based off a resource, as well as its relationships. You can expect the IaC generator to have a huge impact for a common use case we’ve seen.
Other AWS news Here are some additional projects, programs, and news items that you might find interesting:
Amazon API Gateway processed over 100 trillion API requests in 2023, demonstrating the growing demand for API-driven applications. API Gateway is a fully-managed API management service. Customers from all industry verticals told us they’re adopting API Gateway for multiple reasons. First, its ability to scale to meet the demands of even the most high-traffic applications. Second, its fully-managed, serverless architecture, which eliminates the need to manage any infrastructure, and frees customers to focus on their core business needs.
Join the PartyRock Generative AI Hackathon by AWS. This is a challenge for you to get hands-on building generative AI-powered apps. You’ll use Amazon PartyRock, an Amazon Bedrock Playground, as a fast and fun way to learn about Prompt Engineering and Foundational Models (FMs) to build a functional app with generative AI.
AWS open source news and updates – My colleague Ricardo writes this weekly open source newsletter in which he highlights new open source projects, tools, and demos from the AWS Community.
Upcoming AWS events Whether you’re in the Americas, Asia Pacific & Japan, or EMEA region, there’s an upcoming AWS Innovate Online event that fits your timezone. Innovate Online events are free, online, and designed to inspire and educate you about AWS.
AWS Summits are a series of free online and in-person events that bring the cloud computing community together to connect, collaborate, and learn about AWS. These events are designed to educate you about AWS products and services and help you develop the skills needed to build, deploy, and operate your infrastructure and applications. Find an AWS Summit near you and register or set a notification to know when registration opens for a Summit that interests you.
AWS Community re:Invent re:Caps – Join a Community re:Cap event organized by volunteers from AWS User Groups and AWS Cloud Clubs around the world to learn about the latest announcements from AWS re:Invent.
AWS Infrastructure as Code (IaC) enables customers to manage, model, and provision infrastructure at scale. You can declare your infrastructure as code in YAML or JSON by using AWS CloudFormation, in a general purpose programming language using the AWS Cloud Development Kit (CDK), or visually using Application Composer. IaC configurations can then be audited and version controlled in a version control system of your choice. Finally, deploying AWS IaC enables deployment previews using change sets, automated rollbacks, proactive enforcement of resource compliance using hooks, and more. Millions of customers enjoy the safety and reliability of AWS IaC products.
Not every resource starts in IaC, however. Customers create non-IaC resources for various reasons: they didn’t know about IaC, or they prefer to work in the CLI or management console. In 2019, we introduced the ability to import existing resources into CloudFormation. While this feature proved integral for bringing resources into IaC on an individual basis, the process of manually creating templates to match those resources wasn’t ideal. Customers were required to look up documentation on resources and painstakingly copy values manually. Customers also told us they traditionally engaged with applications (that is, groupings of related resources), so dealing with individual resources didn’t match that experience. We set out to create a more holistic flow for managing resources and their relations.
Recently, we announced the IaC generator and CDK Migrate, an end-to-end experience that enables customers to create an IaC configuration based off a resource as well as its relationships. This works by scanning an AWS account and using the CloudFormation resource type schema to find relationships between resources. Once this configuration is created, you can use it to either import those resources into an existing stack, or create a brand new stack from scratch. It’s now possible to bring entire applications into a managed CloudFormation stack without having to recreate any resources!
In this post, I’ll explore a common use case we’ve seen and expect the IaC generator to solve: an existing network architecture, created outside of any IaC tool, needs to be managed by CloudFormation.
IaC generator in Action
Consider the following scenario:
As a new hire to an organization that’s just starting its cloud adoption journey, you’ve been tasked with continuing the development of the team’s shared Amazon Virtual Private Cloud (VPC) resources. These are actively in use by the development teams. As you dig around, you find out that these resources were created without any form of IaC. There’s no documentation, and the person who set it up is no longer with the team. Confounding the problem, you have multiple VPCs and their related resources, such subnets, route tables, and internet gateways.
You understand the benefits of IaC – repeatability, reliability, auditability, and safety. Bringing these resources under CloudFormation management will extend these benefits to your existing resources. You’ve imported resources into CloudFormation before, so you set about the task of finding all related resources manually to create a template. You quickly discover, however, that this won’t be a simple task. VPCs don’t store relations to items; instead, relations are reversed – items know which VPC they belong to, but VPCs don’t know which items belong to them. In order to find all the resources that are related to a VPC, you’ll have to manually go through all the VPC-related resources and scan to see which vpc-id they belong to. You’ll have to be diligent, as it’s very easy to miss a resource because you weren’t aware that it existed or it may even be different class of resource altogether! For example, some resources may use an elastic network interface (ENI) to attach to the VPC, like an Amazon Relational Database Service instance.
You, however, recently learned about the IaC generator. The generator works by running a scan of your account and creating an up-to-date inventory of resources. CloudFormation will then leverage the resource type schema to find relationships between resources. For example, it can determine that a subnet has a relationship to a VPC via a vpc-id property. Once these relationships have been determined, you can then select the top-level resources you want to generate a template for. Finally, you’ll be able to leverage the wizard to create a stack from this existing template.
You can navigate to the IaC generator page in the Amazon Management Console and start a scan on your account. Scans last for 30 days, and you can run three scans per day in an account.
Once the scan completes, you create a template by selecting the Create Template button. After selecting Start from a new template, you fill out the relevant details about the stack, including the Template name and any stack policies. In this case, you leave it as Retain.
On the next page, you’ll see all the scanned resources. You can add filters to the resource such as tags to view a subset of scanned resources. This example will only use a Resource type prefix filter. More information on filters can be found here. Once you find the VPC, you can select it from the list.
On the next page, you’ll see the list of resources that CloudFormation has determined to have a link to this VPC. You see this includes a myriad of networking related resource. You keep these all selected to create a template from them.
At this point, you select Create template and CloudFormation will generate a template from the existing resources. Since you don’t have an existing stack to import these resource into, you must create a new stack. You now select this template and then select the Import to stack button.
After entering the Stack name, you can then enter any Parameters your template needs.
CloudFormation will create a change set for your new stack. Change sets allow you to see the changes CloudFormation will apply to a stack. In this example, all of the resources will have the Import status. You see the resources CloudFormation found, and once you’re satisfied, you create the stack.
At this point, the create stack operation will proceed as normal, going through each resource and importing it into the stack. You can report back to your team that you have successfully imported your entire networking stack! As next steps, you should source this template in a version control system. We recently announced a new feature to keep CloudFormation templates synced with popular version control systems. Finally, make sure to make any changes through CloudFormation to avoid a configuration drift between the stated configuration and the existing configuration.
This example was primarily CloudFormation-based, but CDK customers can use CDK Migrate to import this configuration into a CDK application.
Available Now
The IaC generator is now available in all regions where CloudFormation is supported. You can access the IaC generator using the console, CLI, and SDK.
Conclusion
In this post, we explored the new IaC generator feature of CloudFormation. We walked through a scenario of needing to manage previously existing resources and using the IaC generator’s provided wizard flow to generate a CloudFormation template. We then used that template and created a stack to manage these resources. These resources will now enjoy the safety and repeatability that IaC provides. Though this is just one example, we foresee other use cases for this feature, such as enabling a console-first development experience. We’re really excited to hear your thoughts about the feature. Please let us know how you feel!
Today we’re excited to announce the general availability of CDK Migrate, a component of the AWS Cloud Development Kit (CDK). This feature enables users to migrate AWS CloudFormation templates, previously deployed CloudFormation stacks, or resources created outside of Infrastructure as Code (IaC) into a CDK application. This feature is being launched in tandem with the CloudFormation IaC Generator, which helps customers import resources created outside of CloudFormation into a template, and into a newly generated, fully managed CloudFormation stack. To read more on this feature, check out the launch post.
There are various ways to create and manage resources in AWS, whether that be via “ClickOps” (creating and updating via the AWS Console), via AWS API’s, or using Infrastructure as Code (IaC). While it’s a good and recommended practice to manage the lifecycle of resources using IaC, there can be an on-ramp to getting started. For those that aren’t ready to use IaC, it is likely that they use the console to create the resources and update them accordingly. While this can be acceptable for smaller use cases or for testing out a new service, it becomes more challenging as the complexity of the environment grows. This is further exacerbated when there is a need to re-deploy the exact configuration to other accounts, environments, or regions, as the process becomes very error prone when trying to replicate it. IaC is built to help solve this problem by allowing users to define once and deploy everywhere. For those who have been putting off the move to IaC, now is the time to take the plunge with the IaC generator functionality and CDK migrate, which can accelerate and simplify the move.
Getting Started
The first step when migrating resources into the AWS CDK is to understand the best mechanism for how the users would prefer to interact with their IaC.
For users that are looking to define their IaC declaratively (manage resources via a configuration language like YAML), it is recommended that they look at IaC generator, which can generate a CloudFormation template as well as manage the existing resources in a CloudFormation stack.
For users that are looking to manage their IaC via a higher level programming language as well as build on top of those templates with higher level abstractions and automation, the AWS Cloud Development Kit and CDK migrate serve as an excellent option,
There is also functionality in the CDK CLI to import resources into an existing CDK application. Let’s review the use cases for when to use CDK migrate vs when to use CDK import.
CDK Migrate
Users are looking to migrate one or many resources into a new CDK application.
Examples of existing resources in the AWS region to be migrated:
Resources created outside of IaC
A deployed CloudFormation Stack
Users want to migrate from CloudFormation templates into a new CDK application
Users are looking for a managed experience to generate CDK code from existing resources and/or CloudFormation templates.
While the CDK migrate feature is designed to help accelerate those users looking to use the AWS CDK, it’s important to understand that there are limitations. For more information on the limitations, please review the documentation.
CDK Import
Users have an existing CDK application and want to import one or many resources that were created outside of the CDK.
Examples of existing resources in the AWS region to be migrated:
Resources created outside of IaC (via ClickOps)
A deployed CloudFormation Stack
The user must define the resources in their CDK app on their own, and ensure that the resources defined in the CDK code map directly to the resource as it exists in the account. There is a multi-step process to follow when using this feature, for more information see here.
This post will walk through an example of how to take a local CloudFormation template and convert it into a new CDK application.
Walkthrough
To start, take the CloudFormation template below that will be converted to a CDK application. The template creates an AWS Lambda Function, AWS Identity and Access Management (IAM) role, and an Amazon S3 Bucket along with some parameters to help make some of the inputs dynamic. Below is the template in full:
AWSTemplateFormatVersion: "2010-09-09"
Description: AWS CDK Migrate Demo Template
Parameters:
  FunctionResponse:
    Description: Response message from the Lambda function
    Type: String
    Default: Hello World
  BucketTag:
    Description: The tag value of the S3 bucket
    Type: String
    Default: ChangeMe
Resources:
  LambdaExecutionRole:
    Type: AWS::IAM::Role
    Properties:
      AssumeRolePolicyDocument:
        Version: "2012-10-17"
        Statement:
          - Effect: Allow
            Principal:
              Service: lambda.amazonaws.com
            Action: sts:AssumeRole
      ManagedPolicyArns:
        - arn:aws:iam::aws:policy/service-role/AWSLambdaBasicExecutionRole
  HelloWorldFunction:
    Type: AWS::Lambda::Function
    Properties:
      Role: !GetAtt LambdaExecutionRole.Arn
      Code:
        ZipFile: |
          import os
          def lambda_handler(event, context):
            function_response = os.getenv('FUNCTION_RESPONSE')
            return {
              "statusCode": 200,
              "body": function_response
            }
      Handler: index.lambda_handler
      Runtime: python3.11
      Environment:
        Variables:
          FUNCTION_RESPONSE: !Ref FunctionResponse
  S3Bucket:
    Type: AWS::S3::Bucket
    Properties:
      PublicAccessBlockConfiguration:
        BlockPublicAcls: true
        BlockPublicPolicy: true
        IgnorePublicAcls: true
        RestrictPublicBuckets: true
      BucketEncryption:
        ServerSideEncryptionConfiguration:
          - ServerSideEncryptionByDefault:
              SSEAlgorithm: AES256
      Tags:
        - Key: Application
          Value: Git-Sync-Demo
        - Key: DynamicTag
          Value: !Ref BucketTag
Outputs:
  S3BucketName:
    Description: The name of the S3 bucket
    Value: !Ref S3Bucket
    Export:
      Name: !Sub ${AWS::StackName}-S3BucketName
This is the template that you will use when running the migration command. As a reminder, this demo migrates a CloudFormation template to a CDK application, but you can also migrate a previously deployed stack or non IaC created resources.
Migrate
The migration from the CloudFormation template to the CDK is done with a single command: cdk migrate. Simply point to the local CloudFormation template file (let’s call it demo-template.yaml), and watch as the CLI converts the template into a CDK application. The output and result from running the command will be a directory comprised of the CDK code and dependencies, but will not deploy the stack.
In the above command, you’re instructing the CDK CLI to consume the CloudFormation template file using the --from-path parameter, and choose the language as the output for the CDK application. The CDK CLI will convert the template as well as create a project folder along with the required dependencies for the CDK application.
When the migration is complete, the CDK application along with the project structure and files are available and ready to use, but have not yet been deployed. Below is the file structure of what was generated:
The above output represents the scaffold for your CDK Typescript application, ready for deployment. The two directories that house the CDK code are bin and lib. Within the bin directory you’ll find the code that creates our CDK app and calls the CDK Stack class. The name of the files will match the input that was passed into the –stack-name parameter when running the migrate command, so in this case the file is named: bin/cdk-local-template-migrate-demo.ts. Below is the generated code:
The CdkLocalTemplateMigrateDemoStack is imported and then instantiated. This is where the code that was converted from the existing CloudFormation template (or stack, or resources) resides. Again, similar to how the file was named above, the filename and location for the CDK stack code is lib/cdk-local-template-migrate-demo-stack.ts. Let’s look at the code that was converted.
Comparing the above auto generated code to the original CloudFormation template, the definitions of the resources look similar. This is because the migrate command is generating the CDK code using L1 constructs, which represent all resources available in CloudFormation. For more information on CDK constructs and the various levels of abstraction they offer, check out this video.
The CloudFormation parameters were converted to properties inside of an interface, which are passed in to the Stack class. Inside of the Stack class code, it honors the defaults set in the properties based on the defaults were set in the original CloudFormation parameters. If you wanted to override those defaults, you could pass those properties into the CDK stack as follows:
With your newly created CDK application, you’re ready to deploy it to your AWS account.
Deploy
If this is the first time that you are using the CDK in the account and region, you will need to run the cdk bootstrap command, which creates assets required for the CDK to properly deploy resources to the region and account. For more information see here. Assuming the bootstrap process has happened, you can proceed to deployment.
The Infrastructure as Code is ready to deploy, but prior to deploying you should run a cdk diff to see what will be deployed. Running the diff command creates a change set and surfaces the changes being proposed (in this case it is a brand new stack with new resources).
From the output you can see that all new resources are being created. If the cdk diff command was run against existing resources or stacks, assuming nothing changed (like above where I updated the properties), the diff would show no changes to the existing resources.
Next, deploy the stack (by running the cdk deploy command) and once the deployment is complete, head over to the AWS console and find your Lambda function. Run a test on your lambda function, and the response should match the functionResponse property that was updated as “CDK Migrate Demo Blog”.
Wrapping up
In this post, we discussed how the CDK migrate command can help you move your resources to the CDK to manage your infrastructure as code, whether it’s from a CloudFormation template, previously deployed CloudFormation stack, or from importing resources via the CloudFormation IaC generator feature. As always, we encourage you to test this feature and provide feedback and/or feature requests in our GitHub repo. In addition, if you’re new to the CDK there are some resources that can help you get started.
AWS CloudFormation StackSets help deploy CloudFormation stacks to multiple accounts and regions with a single operation. Using service-managed permissions, StackSets automatically generate the IAM roles required to deploy stack instances, eliminating the need for manual creation in each target account prior to deployment. StackSets provide auto-deploy capabilities to deploy stacks to new accounts as they’re added to an Organizational Unit (OU) in AWS Organization. With StackSets, you can deploy AWS well-architected multi-account solutions organization-wide in a single click and target stacks to selected accounts in OUs. You can also leverage StackSets to auto deploy foundational stacks like networking, policies, security, monitoring, disaster recovery, billing, and analytics to new accounts. This ensures consistent security and governance reflecting AWS best practices.
AWS CloudFormation Hooks allow customers to invoke custom logic to validate resource configurations before a CloudFormation stack create/update/delete operation. This helps enforce infrastructure-as-code policies by preventing non-compliant resources. Hooks enable policy-as-code to support consistency and compliance at scale. Without hooks, controlling CloudFormation stack operations centrally across accounts is more challenging because governance checks and enforcement have to be implemented through disjointed workarounds across disparate services after the resources are deployed. Other options like Config rules evaluate resource configurations on a timed basis rather than on stack operations. And SCPs manage account permissions but don’t include custom logic tailored to granular resource configurations. In contrast, CloudFormation hooks allows customer-defined automation to validate each resource as new stacks are deployed or existing ones updated. This enables stronger compliance guarantees and rapid feedback compared to asynchronous or indirect policy enforcement via other mechanisms.
Follow the later sections of this post that provide a step-by-step implementation for deploying hooks across accounts in an organization unit (OU) with a StackSet including:
Configure service-managed permissions to automatically create IAM roles
Create the StackSet in the delegated administrator account
Target the OU to distribute hook stacks to member accounts
This shows how to easily enable a policy-as-code framework organization-wide.
I will show you how to register a custom CloudFormation hook as a private extension, restricting permissions and usage to internal administrators and automation. Registering the hook as a private extension limits discoverability and access. Only approved accounts and roles within the organization can invoke the hook, following security best practices of least privilege.
StackSets Architecture
As depicted in the following AWS StackSets architecture diagram, a dedicated Delegated Administrator Account handles creation, configuration, and management of the StackSet that defines the template for standardized provisioning. In addition, these centrally managed StackSets are deploying a private CloudFormation hook into all member accounts that belong to the given Organization Unit. Registering this as a private CloudFormation hook enables administrative control over the deployment lifecycle events it can respond to. Private hooks prevent public usage, ensuring the hook can only be invoked by approved accounts, roles, or resources inside your organization.
Diagram 1: StackSets Delegated Administration and Member Account Diagram
In the above architecture, Member accounts join the StackSet through their inclusion in a central Organization Unit. By joining, these accounts receive deployed instances of the StackSet template which provisions resources consistently across accounts, including the controlled private hook for administrative visibility and control.
The delegation of StackSet administration responsibilities to the Delegated Admin Account follows security best practices. Rather than having the sensitive central Management Account handle deployment logistics, delegation isolates these controls to an admin account with purpose-built permissions. The Management Account representing the overall AWS Organization focuses more on high-level compliance governance and organizational oversight. The Delegated Admin Account translates broader guardrails and policies into specific infrastructure automation leveraging StackSets capabilities. This separation of duties ensures administrative privileges are restricted through delegation while also enabling an organization-wide StackSet solution deployment at scale.
Centralized StackSets facilitate account governance through code-based infrastructure management rather than manual account-by-account changes. In summary, the combination of account delegation roles, StackSet administration, and joining through Organization Units creates an architecture to allow governed, infrastructure-as-code deployments across any number of accounts in an AWS Organization.
Sample Hook Development and Deployment
In the section, we will develop a hook on a workstation using the AWS CloudFormation CLI, package it, and upload it to the Hook Package S3 Bucket. Then we will deploy a CloudFormation stack that in turn deploys a hook across member accounts within an Organization Unit (OU) using StackSets.
The sample hook used in this blog post enforces that server-side encryption must be enabled for any S3 buckets and SQS queues created or updated on a CloudFormation stack. This policy requires that all S3 buckets and SQS queues be configured with server-side encryption when provisioned, ensuring security is built into our infrastructure by default. By enforcing encryption at the CloudFormation level, we prevent data from being stored unencrypted and minimize risk of exposure. Rather than manually enabling encryption post-resource creation, our developers simply enable it as a basic CloudFormation parameter. Adding this check directly into provisioning stacks leads to a stronger security posture across environments and applications. This example hook demonstrates functionality for mandating security best practices on infrastructure-as-code deployments.
Prerequisites
On the AWS Organization:
An AWS Organization setup with a management account or a delegated administrator for stack set deployments. For more information, see CloudFormation StackSets delegated administration for setting a delegated administrator.
An AWS Organization setup with Organization Units with AWS accounts. For more information, refer Managing organizational units.
Enable trusted access to CloudFormation StackSets with AWS Organizations. This is required for the service-managed permissions to work. Follow the steps in the AWS CloudFormation User Guide to enable trusted access with AWS Organizations.
On the workstation where the hooks will be developed:
AWS CLI installedand configured with your AWS credentials that has access to the delegated administrator account. This post uses the us-west-2 Region.
aws configure
Default region name [us-east-1]: us-west-2
In the Delegated Administrator account:
Create a hooks package S3 bucket within the delegated administrator account. Upload the hooks package and CloudFormation templates that StackSets will deploy. Ensure the S3 bucket policy allows access from the AWS accounts within the OU. This access lets AWS CloudFormation access the hooks package objects and CloudFormation template objects in the S3 bucket from the member accounts during stack deployment.
Follow these steps to deploy a CloudFormation template that sets up the S3 bucket and permissions:
Click here to download the admin-cfn-hook-deployment-s3-bucket.yaml template file in to your local workstation. Note: Make sure you model the S3 bucket and IAM policies as least privilege as possible. For the above S3 Bucket policy, you can add a list of IAM Role ARNs created by the StackSets service managed permissions instead of AWS: “*”, which allows S3 bucket access to all the IAM entities from the accounts in the OU. The ARN of this role will be “arn:aws:iam:::role/stacksets-exec-” in every member account within the OU. For more information about equipping least privilege access to IAM policies and S3 Bucket Policies, refer IAM Policies and Bucket Policies and ACLs! Oh, My! (Controlling Access to S3 Resources) blog post.
After deploying the stack, note down the AWS S3 bucket name from the CloudFormation Outputs.
Hook Development
In this section, you will develop a sample CloudFormation hook package that will enforce encryption for S3 Buckets and SQS queues within the preCreate and preDelete hook. Follow the steps in the walkthrough to develop a sample hook and generate a zip package for deploying and enabling them in all the accounts within an OU. While following the walkthrough, within the Registering hooks section, make sure that you stop right after executing the cfn submit --dry-run command. The --dry-run option will make sure that your hook is built and packaged your without registering it with CloudFormation on your account. While initiating a Hook project if you created a new directory with the name mycompany-testing-mytesthook, the hook package will be generated as a zip file with the name mycompany-testing-mytesthook.zip at the root your hooks project.
Upload mycompany-testing-mytesthook.zip file to the hooks package S3 bucket within the Delegated Administrator account. The packaged zip file can then be distributed to enable the encryption hooks across all accounts in the target OU.
Note: If you are using your own hooks project and not doing the tutorial, irrespective of it, you should make sure that you are executing the cfn submit command with the --dry-run option. This ensures you have a hooks package that can be distributed and reused across multiple accounts.
Hook Deployment using CloudFormation Stack Sets
In this section, deploy the sample hook developed previously across all accounts within an OU. Use a centralized CloudFormation stack deployed from the delegated administrator account via StackSets.
Deploying hooks via CloudFormation requires these key resources:
AWS::IAM::Role #1: Task execution role that grants the hook permissions
AWS::IAM::Role #2: (Optional) role for CloudWatch logging that CloudFormation will assume to send log entries during hook execution
AWS::Logs::LogGroup: (Optional) Enables CloudWatch error logging for hook executions
Follow these steps to deploy CloudFormation Hooks to accounts within the OU using StackSets:
Click here to download the hooks-template.yaml template file into your local workstation and upload it into the Hooks package S3 bucket in the Delegated Administrator account.
Deploy the hooks CloudFormation template hooks-template.yaml to all accounts within an OU using StackSets. Leverage service-managed permissions for automatic IAM role creation across the OU. To deploy the hooks template hooks-template.yaml across OU using StackSets, click here to download the CloudFormation StackSets template hooks-stack-sets-template.yaml locally, and upload it to the hooks package S3 bucket in the delegated administrator account. This StackSets template contains an AWS::CloudFormation::StackSet resource that will deploy the necessary hooks resources from hooks-template.yaml to all accounts in the target OU. Using SERVICE_MANAGED permissions model automatically handle provisioning the required IAM execution roles per account within the OU.
Execute the following command to deploy the template hooks-stack-sets-template.yaml using AWS CLI. For more information see Creating a stack using the AWS Command Line Interface. If using AWS CloudFormation console, see Creating a stack on the AWS CloudFormation console.To get the S3 Https URL for the hooks template, hooks package and StackSets template, login to the AWS S3 service on the AWS console, select the respective object and click on Copy URL button as shown in the following screenshot: Diagram 2: S3 Https URL
To get the OU Id, see Viewing the details of an OU. OU Id starts with “ou-“. Make sure to replace the <S3BucketName> and then <OU_Id> accordingly in the following command:
Check the progress of the stack deployment using the aws cloudformation describe-stack command. Move to the next section when the stack status is CREATE_COMPLETE.
If you navigate to the AWS CloudFormation Service’s StackSets section in the console, you can view the stack instances deployed to the accounts within the OU. Alternatively, you can execute the AWS CloudFormation list-stack-instances CLI command below to list the deployed stack instances:
Provision a non-compliant stack without server-side encryption using the following template:
AWSTemplateFormatVersion: 2010-09-09
Description: |
  This CloudFormation template provisions an S3 Bucket
Resources:
  S3Bucket:
    Type: 'AWS::S3::Bucket'
    Properties: {}
The stack deployment will not succeed and will give the following error message
The following hook(s) failed: [MyCompany::Testing::MyTestHook] and the hook status reason as shown in the following screenshot:
Diagram 3: S3 Bucket creation failure with hooks execution
Provision a stack using the following template that has server-side encryption for the S3 Bucket.
AWSTemplateFormatVersion: 2010-09-09
Description: |
  This CloudFormation template provisions an encrypted S3 Bucket. **WARNING** This template creates an Amazon S3 bucket and a KMS key that you will be charged for. You will be billed for the AWS resources used if you create a stack from this template.
Resources:
  EncryptedS3Bucket:
    Type: "AWS::S3::Bucket"
    Properties:
      BucketName: !Sub "encryptedbucket-${AWS::Region}-${AWS::AccountId}"
      BucketEncryption:
        ServerSideEncryptionConfiguration:
          - ServerSideEncryptionByDefault:
              SSEAlgorithm: "aws:kms"
              KMSMasterKeyID: !Ref EncryptionKey
            BucketKeyEnabled: true
  EncryptionKey:
    Type: "AWS::KMS::Key"
    DeletionPolicy: Retain
    UpdateReplacePolicy: Retain
    Properties:
      Description: KMS key used to encrypt the resource type artifacts
      EnableKeyRotation: true
      KeyPolicy:
        Version: 2012-10-17
        Statement:
          - Sid: Enable full access for owning account
            Effect: Allow
            Principal:
              AWS: !Ref "AWS::AccountId"
            Action: "kms:*"
            Resource: "*"
Outputs:
  EncryptedBucketName:
    Value: !Ref EncryptedS3Bucket
The deployment will succeed as it will pass the hook validation with the following hook status reason as shown in the following screenshot:
Diagram 4: S3 Bucket creation success with hooks execution
Updating the hooks package
To update the hooks package, follow the same steps described in the Hooks Development section to change the hook code accordingly. Then, execute the cfn submit --dry-run command to build and generate the hooks package file with the registering the type with the CloudFormation registry. Make sure to rename the zip file with a unique name compared to what was previously used. Otherwise, while updating the CloudFormation StackSets stack, it will not see any changes in the template and thus not deploy updates. The best practice is to use a CI/CD pipeline to manage the hook package. Typically, it is good to assign unique version numbers to the hooks packages so that CloudFormation stacks with the new changes get deployed.
Cleanup
Navigate to the AWS CloudFormation console on the Delegated Administrator account, and note down the Hooks package S3 bucket name and empty its contents. Refer to Emptying the Bucket for more information.
Delete the CloudFormation stacks in the following order:
Test stack that failed
Test stack that passed
StackSets CloudFormation stack. This has a DeletionPolicy set to Retain, update the stack by removing the DeletionPolicy and then initiate a stack deletion via CloudFormation or physically delete the StackSet instances and StackSets from the Console or CLI by following: 1. Delete stack instances from your stack set 2. Delete a stack set
Throughout this blog post, you have explored how AWS StackSets enable the scalable and centralized deployment of CloudFormation hooks across all accounts within an Organization Unit. By implementing hooks as reusable code templates, StackSets provide consistency benefits and slash the administrative labor associated with fragmented and manual installs. As organizations aim to fortify governance, compliance, and security through hooks, StackSets offer a turnkey mechanism to efficiently reach hundreds of accounts. By leveraging the described architecture of delegated StackSet administration and member account joining, organizations can implement a single hook across hundreds of accounts rather than manually enabling hooks per account. Centralizing your hook code-base within StackSets templates facilitates uniform adoption while also simplifying maintenance. Administrators can update hooks in one location instead of attempting fragmented, account-by-account changes. By enclosing new hooks within reusable StackSets templates, administrators benefit from infrastructure-as-code descriptiveness and version control instead of one-off scripts. Once configured, StackSets provide automated hook propagation without overhead. The delegated administrator merely needs to include target accounts through their Organization Unit alignment rather than handling individual permissions. New accounts added to the OU automatically receive hook deployments through the StackSet orchestration engine.
About the Author
Kirankumar Chandrashekar is a Sr. Solutions Architect for Strategic Accounts at AWS. He focuses on leading customers in architecting DevOps, modernization using serverless, containers and container orchestration technologies like Docker, ECS, EKS to name a few. Kirankumar is passionate about DevOps, Infrastructure as Code, modernization and solving complex customer issues. He enjoys music, as well as cooking and traveling.
AWS CloudFormation, an Infrastructure as Code (IaC) service that lets you model, provision, and manage AWS and third-party resources, now supports using Git sync to automatically trigger a deployment whenever a tracked Git repository is updated. This enables developers to significantly speed up the development cycle for CloudFormation by integrating into their Git workflow and reducing time lost to context switching. The new integration works directly with GitHub, GitHub Enterprise, GitLab, and Bitbucket.
In this post, you’ll explore what a modern development experience looks like using both GitHub’s native tooling as well as the native CloudFormation Git sync integration. You’ll be creating a cloud development environment using GitHub CodeSpaces, integrating direct feedback into Pull Requests using GitHub Actions and the CloudFormation Linter, and automating safe deployments.
Requirements
An AWS account. You will be deploying Amazon Virtual Private Cloud (Amazon VPC) resources, which are provided at no extra cost. AWS Accounts may only have five (5) VPCs without a limit increase.
A GitHub account with access to Codespaces and Actions. These have a free tier but may incur charges if exceeded.
For this, you’ll start with a new GitHub repository. GitHub allows you to create new Git repositories for free. For this example, you’ll create a repository called git-sync.
Setting up a Codespace
Once you create the repository, you’ll have the option to create a Codespace. Codespaces are remote development environments managed by GitHub that allows you to develop from anywhere on standardized virtual machines.
Codespaces uses Visual Studio Code as its code editor of choice. Visual Studio Code is an open-source code editor that has excellent flexibility and extensibility due to the ability to install extensions.
Once it finishes creating, you can set up the environment much like you would your local development environment. You’re going to be adding the CloudFormation Linter extension to provide fast in-editor feedback when developing your template. This lets you avoid having to send CloudFormation your templates for validation and instead have good confidence that your templates are valid before you submit them for provisioning. You’ll install it both using the command line and an extension to Visual Studio Code itself. In the terminal, run:
pip3 install cfn-lint
Once that installs, you can install the linter in the extensions panel:
Next, you’ll create your template in the base directory called vpc.yaml. As you start typing, the linter extension will offer recommendations and auto-complete for you.
Copy the following template into our newly created vpc.yaml file:
This template creates a VPC with a CIDR block of 10.0.0.0/16.
You can verify the template gives no errors by running cfn-lint in the terminal and verifying it returns no errors.
cfn-lint -t vpc.yaml
Adding the deployment file
In order to support many different types of deployments, Git sync supports a deployment file to provide flexibility for managing CloudFormation stacks from within a Git repository. This config file manages the location of the template file, and any parameters or tags you may be interested in using. I strongly encourage you to use a config file for managing your parameters and tags, as it enables easy auditability and deterministic deployments.
You’ll be creating a new file called deployment-file.yaml in your repository. Since this stack doesn’t have parameters or tags, it’ll be relatively simple:
template-file-path: ./vpc.yaml
You also have the ability to add this file in the console later.
Adding Pull Request actions
Now that you’ve configured your development environment just the way you want it, you want to ensure that anyone who submits a pull-request will receive the same high-quality feedback that you’re getting locally. You can do this using GitHub Actions. Actions are a customizable workflow tool that you can leverage to enable pull-request feedback and CI builds.
To do that, you’ll have to create the following folder structure: .github/workflows/pull-request.yaml. The contents of this file are as follows:
Once you push these commits, GitHub will allow you to create a pull request against your main branch. However, once you create it, you’ll notice that your checks fail when your GitHub Actions finish running.
You can see what went wrong by checking the “Files changed” tab. Your linter action will provide feedback directly on the pull request and block your merge action if you’ve set up your branch protection. This repository requires at least one reviewer and all checks to pass, so you’ll have to resolve both these failures.
Now that you have the high-quality feedback as well as the offending line numbers, you can go back to your template and make the necessary fix of changing VpcName to VpcId.
The local linter is happy, and after you commit again you’ll see that your remote linter is equally happy. After getting another approver, you can merge your commit into your main branch.
Enabling Git sync
You now have a high-quality cloud development environment and your pull request process ensures your templates are linted before merging. You can be sure that a CloudFormation template that makes it to the main branch is ready to be deployed. Next, you’ll be leveraging the newly released Git sync feature of CloudFormation to automatically sync your deployed stack with this new template.
First, create the role that will deploy our CloudFormation template. Be sure to note the name you select for this as you’ll be using it to manage your stack later. This example uses vpc-example-cloudformation-deployment-role.
Once the role has been created, you’ll have to create a new stack:
Here, you can see the new option to select Sync from Git template source, which you can configure on the next screen. Since you already created your stack deployment file, you can select I am providing my own file in my repository.
Next, you can configure your Git integration to choose your repository. Since it’s your first time, you’ll need to use the CodeStar Connection you created beforehand and select your repository.
Select GitHub, your connection, the repository, and branch, the deployment file location.
Finally, you will select New IAM Role to create a service managed role. This role will enable Git sync to connect to your repository. You’ll only need to do this once; in the future you’ll be able to use the existing role you’ll create here.
On the next page, you’ll select the IAM Role you created to manage this stack. This role controls the resources that CloudFormation will deploy. Stacks managed by Git sync must have a role already created.
Finally, you can see the status of your sync in the new “Git sync” tab, including the configuration you provided earlier as well as the status of your sync, your previous deployments, and the option to retry or disconnect the sync if needed.
Conclusion
At this point, you’ve configured a remote development environment to get high-quality feedback when creating and updating your CloudFormation templates. You also have the same high-quality feedback when creating a pull request. Finally, when a template does get merged to the main branch, it will be automatically deployed to your stack. This represents a robust and extensible CI/CD system to manage your infrastructure as code. I’m excited to hear your feedback about this feature!
This post is written by Julian Wood, Principal Developer Advocate, and Dan Fox, Principal Specialist Serverless Solutions Architect.
AWS Lambda supports multiple programming languages through the use of runtimes. A Lambda runtime provides a language-specific execution environment, which provides the OS, language support, and additional settings, such as environment variables and certificates that you can access from your function code.
You can use managed runtimes that Lambda provides or build your own. Each major programming language release has a separate managed runtime, with a unique runtime identifier, such as python3.11 or nodejs20.x.
Lambda automatically applies patches and security updates to all managed runtimes and their corresponding container base images. Automatic runtime patching is one of the features customers love most about Lambda. When these patches are no longer available, Lambda ends support for the runtime. Over the next few months, Lambda is deprecating a number of popular runtimes, triggered by end of life of upstream language versions and of Amazon Linux 1.
Runtime
Deprecation
Node.js 14
Nov 27, 2023
Node.js 16
Mar 11, 2024
Python 3.7
Nov 27, 2023
Java 8 (Amazon Linux 1)
Dec 31, 2023
Go 1.x
Dec 31, 2023
Ruby 2.7
Dec 07, 2023
Custom Runtime (provided)
Dec 31, 2023
Runtime deprecation is not unique to Lambda. You must upgrade code using Python 3.7 or Node.js 14 when those language versions reach end of life, regardless of which compute service your code is running on. Lambda can help make this easier by tracking which runtimes you are using and providing deprecation notifications.
This post contains considerations and best practices for managing runtime deprecations and upgrades when using Lambda. Adopting these techniques makes managing runtime upgrades easier, especially when working with a large number of functions.
Specifying Lambda runtimes
When you deploy your function as a .zip file archive, you choose a runtime when you create the function. To change the runtime, you can update your function’s configuration.
Lambda keeps each managed runtime up to date by taking on the operational burden of patching the runtimes with security updates, bug fixes, new features, performance enhancements, and support for minor version releases. These runtime updates are published as runtime versions. Lambda applies runtime updates to functions by migrating the function from an earlier runtime version to a new runtime version.
You can control how your functions receive these updates using runtime management controls. Runtime versions and runtime updates apply to patch updates for a given Lambda runtime. Lambda does not automatically upgrade functions between major language runtime versions, for example, from nodejs14.x to nodejs18.x.
For a function defined as a container image, you choose a runtime and the Linux distribution when you create the container image. Most customers start with one of the Lambda base container images, although you can also build your own images from scratch. To change the runtime, you create a new container image from a different base container image.
Why does Lambda deprecate runtimes?
Lambda deprecates a runtime when upstream runtime language maintainers mark their language end-of-life or security updates are no longer available.
In almost all cases, the end-of-life date of a language version or operating system is published well in advance. The Lambda runtime deprecation policy gives end-of-life schedules for each language that Lambda supports. Lambda notifies you by email and via your Personal Health Dashboard if you are using a runtime that is scheduled for deprecation.
Lambda runtime deprecation happens in several stages. Lambda first blocks creating new functions that use a given runtime. Lambda later also blocks updating existing functions using the unsupported runtime, except to update to a supported runtime. Lambda does not block invocations of functions that use a deprecated runtime. Function invocations continue indefinitely after the runtime reaches end of support.
Lambda is extending the deprecation notification period from 60 days before deprecation to 180 days. Previously, blocking new function creation happened at deprecation and blocking updates to existing functions 30 days later. Blocking creation of new functions now happens 30 days after deprecation, and blocking updates to existing functions 60 days after.
Lambda occasionally delays deprecation of a Lambda runtime for a limited period beyond the end of support date of the language version that the runtime supports. During this period, Lambda only applies security patches to the runtime OS. Lambda doesn’t apply security patches to programming language runtimes after they reach their end of support date.
Can Lambda automatically upgrade my runtime?
Moving from one major version of the language runtime to another has a significant risk of being a breaking change. Some libraries and dependencies within a language have deprecation schedules and do not support versions of a language past a certain point. Moving functions to new runtimes could potentially impact large-scale production workloads that customers depend on.
Since Lambda cannot guarantee backward compatibility between major language versions, upgrading the Lambda runtime used by a function is a customer-driven operation.
Lambda function versions
You can use function versions to manage the deployment of your functions. In Lambda, you make code and configuration changes to the default function version, which is called $LATEST. When you publish a function version, Lambda takes a snapshot of the code, runtime, and function configuration to maintain a consistent experience for users of that function version. When you invoke a function, you can specify the version to use or invoke the $LATEST version. Lambda function versions are required when using Provisioned Concurrency or SnapStart.
Some developers use an auto-versioning process by creating a new function version each time they deploy a change. This results in many versions of a function, with only a single version actually in use.
While Lambda applies runtime updates to published function versions, you cannot update the runtime major version for a published function version, for example from Node.js 16 to Node.js 20. To update the runtime for a function, you must update the $LATEST version, then create a new published function version if necessary. This means that different versions of a function can use different runtimes. The following shows the same function with version 1 using Node.js 14.x and version 2 using Node.js 18.x.
Version 1 using Node.js 14.x
Version 2 using Node.js 18.x
Ensure you create a maintenance process for deleting unused function versions, which also impact your Lambda storage quota.
Managing function runtime upgrades
Managing function runtime upgrades should be part of your software delivery lifecycle, in a similar way to how you treat dependencies and security updates. You need to understand which functions are being actively used in your organization. Organizations can create prioritization based on security profiles and/or function usage. You can use the same communication mechanisms you may already be using for handling security vulnerabilities.
Implement preventative guardrails to ensure that developers can only create functions using supported runtimes. Using infrastructure as code, CI/CD pipelines, and robust testing practices makes updating runtimes easier.
Identifying impacted functions
There are tools available to check Lambda runtime configuration and to identify which functions and what published function versions are actually in use. Deleting a function or function version that is no longer in use is the simplest way to avoid runtime deprecations.
You can identify functions using deprecated or soon to be deprecated runtimes using AWS Trusted Advisor. Use the AWS Lambda Functions Using Deprecated Runtimes check, in the Security category that provides 120 days’ notice.
AWS Trusted Advisor Lambda functions using deprecated runtimes
Trusted Advisor scans all versions of your functions, including $LATEST and published versions.
The AWS Command Line Interface (AWS CLI) can list all functions in a specific Region that are using a specific runtime. To find all functions in your account, repeat the following command for each AWS Region and account. Replace the <REGION> and <RUNTIME> parameters with your values. The --function-version ALL parameter causes all function versions to be returned; omit this parameter to return only the $LATEST version.
aws lambda list-functions --function-version ALL --region <REGION> --output text —query "Functions[?Runtime=='<RUNTIME>'].FunctionArn"
You can use AWS Config to create a view of the configuration of resources in your account and also store configuration snapshot data in Amazon S3. AWS Config queries do not support published function versions, they can only query the $LATEST version.
There are a number of ways that you can track Lambda function usage.
You can use Amazon CloudWatch metrics explorer to view Lambda by runtime and track the Invocations metric within the default CloudWatch metrics retention period of 15 months.
Track invocations in Amazon CloudWatch metrics
You can turn on AWS CloudTrail data event logging to log an event every time Lambda functions are invoked. This helps you understand what identities are invoking functions and the frequency of their invocations.
AWS Config rules allow you to check that Lambda function settings for the runtime match expected values. For more information on running these rules before deployment, see Preventative Controls with AWS Config. You can also reactively flag functions as non-compliant as your governance policies evolve. For more information, see Detective Controls with AWS Config.
Use infrastructure as code tools to build and manage your Lambda functions, which can make it easier to manage upgrades.
Ensure you run tests against your functions when developing locally. Include automated tests as part of your CI/CD pipelines to provide confidence in your runtime upgrades. When rolling out function upgrades, you can use weighted aliases to shift traffic between two function versions as you monitor for errors and failures.
Using runtimes after deprecation
AWS strongly advises you to upgrade your functions to a supported runtime before deprecation to continue to benefit from security patches, bug-fixes, and the latest runtime features. While deprecation does not affect function invocations, you will be using an unsupported runtime, which may have unpatched security vulnerabilities. Your function may eventually stop working, for example, due to a certificate expiry.
Lambda blocks function creation and updates for functions using deprecated runtimes. To create or update functions after these operations are blocked, contact AWS Support.
Conclusion
Lambda is deprecating a number of popular runtimes over the next few months, reflecting the end-of-life of upstream language versions and Amazon Linux 1. This post covers considerations for managing Lambda function runtime upgrades.
For more serverless learning resources, visit Serverless Land.
Customers often ask for help with implementing Blue/Green deployments to Amazon Elastic Container Service (Amazon ECS) using AWS CodeDeploy. Their use cases usually involve cross-Region and cross-account deployment scenarios. These requirements are challenging enough on their own, but in addition to those, there are specific design decisions that need to be considered when using CodeDeploy. These include how to configure CodeDeploy, when and how to create CodeDeploy resources (such as Application and Deployment Group), and how to write code that can be used to deploy to any combination of account and Region.
Today, I will discuss those design decisions in detail and how to use CDK Pipelines to implement a self-mutating pipeline that deploys services to Amazon ECS in cross-account and cross-Region scenarios. At the end of this blog post, I also introduce a demo application, available in Java, that follows best practices for developing and deploying cloud infrastructure using AWS Cloud Development Kit (AWS CDK).
The Pipeline
CDK Pipelines is an opinionated construct library used for building pipelines with different deployment engines. It abstracts implementation details that developers or infrastructure engineers need to solve when implementing a cross-Region or cross-account pipeline. For example, in cross-Region scenarios, AWS CloudFormation needs artifacts to be replicated to the target Region. For that reason, AWS Key Management Service (AWS KMS) keys, an Amazon Simple Storage Service (Amazon S3) bucket, and policies need to be created for the secondary Region. This enables artifacts to be moved from one Region to another. In cross-account scenarios, CodeDeploy requires a cross-account role with access to the KMS key used to encrypt configuration files. This is the sort of detail that our customers want to avoid dealing with manually.
AWS CodeDeploy is a deployment service that automates application deployment across different scenarios. It deploys to Amazon EC2 instances, On-Premises instances, serverless Lambda functions, or Amazon ECS services. It integrates with AWS Identity and Access Management (AWS IAM), to implement access control to deploy or re-deploy old versions of an application. In the Blue/Green deployment type, it is possible to automate the rollback of a deployment using Amazon CloudWatch Alarms.
CDK Pipelines was designed to automate AWS CloudFormation deployments. Using AWS CDK, these CloudFormation deployments may include deploying application software to instances or containers. However, some customers prefer using CodeDeploy to deploy application software. In this blog post, CDK Pipelines will deploy using CodeDeploy instead of CloudFormation.
Design Considerations
In this post, I’m considering the use of CDK Pipelines to implement different use cases for deploying a service to any combination of accounts (single-account & cross-account) and regions (single-Region & cross-Region) using CodeDeploy. More specifically, there are four problems that need to be solved:
CodeDeploy Configuration
The most popular options for implementing a Blue/Green deployment type using CodeDeploy are using CloudFormation Hooks or using a CodeDeploy construct. I decided to operate CodeDeploy using its configuration files. This is a flexible design that doesn’t rely on using custom resources, which is another technique customers have used to solve this problem. On each run, a pipeline pushes a container to a repository on Amazon Elastic Container Registry (ECR) and creates a tag. CodeDeploy needs that information to deploy the container.
I recommend creating a pipeline action to scan the AWS CDK cloud assembly and retrieve the repository and tag information. The same action can create the CodeDeploy configuration files. Three configuration files are required to configure CodeDeploy: appspec.yaml, taskdef.json and imageDetail.json. This pipeline action should be executed before the CodeDeploy deployment action. I recommend creating template files for appspec.yaml and taskdef.json. The following script can be used to implement the pipeline action:
##
#!/bin/sh
#
# Action Configure AWS CodeDeploy
# It customizes the files template-appspec.yaml and template-taskdef.json to the environment
#
# Account = The target Account Id
# AppName = Name of the application
# StageName = Name of the stage
# Region = Name of the region (us-east-1, us-east-2)
# PipelineId = Id of the pipeline
# ServiceName = Name of the service. It will be used to define the role and the task definition name
#
# Primary output directory is codedeploy/. All the 3 files created (appspec.json, imageDetail.json and
# taskDef.json) will be located inside the codedeploy/ directory
#
##
Account=$1
Region=$2
AppName=$3
StageName=$4
PipelineId=$5
ServiceName=$6
repo_name=$(cat assembly*$PipelineId-$StageName/*.assets.json | jq -r '.dockerImages[] | .destinations[] | .repositoryName' | head -1)
tag_name=$(cat assembly*$PipelineId-$StageName/*.assets.json | jq -r '.dockerImages | to_entries[0].key')
echo ${repo_name}
echo ${tag_name}
printf '{"ImageURI":"%s"}' "$Account.dkr.ecr.$Region.amazonaws.com/${repo_name}:${tag_name}" > codedeploy/imageDetail.json
sed 's#APPLICATION#'$AppName'#g' codedeploy/template-appspec.yaml > codedeploy/appspec.yaml
sed 's#APPLICATION#'$AppName'#g' codedeploy/template-taskdef.json | sed 's#TASK_EXEC_ROLE#arn:aws:iam::'$Account':role/'$ServiceName'#g' | sed 's#fargate-task-definition#'$ServiceName'#g' > codedeploy/taskdef.json
cat codedeploy/appspec.yaml
cat codedeploy/taskdef.json
cat codedeploy/imageDetail.json
Using a Toolchain
A good strategy is to encapsulate the pipeline inside a Toolchain to abstract how to deploy to different accounts and regions. This helps decoupling clients from the details such as how the pipeline is created, how CodeDeploy is configured, and how cross-account and cross-Region deployments are implemented. To create the pipeline, deploy a Toolchain stack. Out-of-the-box, it allows different environments to be added as needed. Depending on the requirements, the pipeline may be customized to reflect the different stages or waves that different components might require. For more information, please refer to our best practices on how to automate safe, hands-off deployments and its reference implementation.
In detail, the Toolchain stack follows the builder pattern used throughout the CDK for Java. This is a convenience that allows complex objects to be created using a single statement:
In the statement above, the continuous deployment pipeline is created in the TOOLCHAIN_ACCOUNT and TOOLCHAIN_REGION. It implements a stage that builds the source code and creates the Java archive (JAR) using Apache Maven. The pipeline then creates a Docker image containing the JAR file.
The UAT stage will deploy the service to the SERVICE_ACCOUNT and SERVICE_REGION using the deployment configuration CANARY_10_PERCENT_5_MINUTES. This means 10 percent of the traffic is shifted in the first increment and the remaining 90 percent is deployed 5 minutes later.
To create additional deployment stages, you need a stage name, a CodeDeploy deployment configuration and an environment where it should deploy the service. As mentioned, the pipeline is, by default, a self-mutating pipeline. For example, to add a Prod stage, update the code that creates the Toolchain object and submit this change to the code repository. The pipeline will run and update itself adding a Prod stage after the UAT stage. Next, I show in detail the statement used to add a new Prod stage. The new stage deploys to the same account and Region as in the UAT environment:
In the statement above, the Prod stage will deploy new versions of the service using a CodeDeploy deployment configurationCANARY_10_PERCENT_5_MINUTES. It means that 10 percent of traffic is shifted in the first increment of 5 minutes. Then, it shifts the rest of the traffic to the new version of the application. Please refer to Organizing Your AWS Environment Using Multiple Accounts whitepaper for best-practices on how to isolate and manage your business applications.
Some customers might find this approach interesting and decide to provide this as an abstraction to their application development teams. In this case, I advise creating a construct that builds such a pipeline. Using a construct would allow for further customization. Examples are stages that promote quality assurance or deploy the service in a disaster recovery scenario.
The implementation creates a stack for the toolchain and another stack for each deployment stage. As an example, consider a toolchain created with a single deployment stage named UAT. After running successfully, the DemoToolchain and DemoService-UAT stacks should be created as in the next image:
CodeDeploy Application and Deployment Group
CodeDeploy configuration requires an application and a deployment group. Depending on the use case, you need to create these in the same or in a different account from the toolchain (pipeline). The pipeline includes the CodeDeploy deployment action that performs the blue/green deployment. My recommendation is to create the CodeDeploy application and deployment group as part of the Service stack. This approach allows to align the lifecycle of CodeDeploy application and deployment group with the related Service stack instance.
CodePipeline allows to create a CodeDeploy deployment action that references a non-existing CodeDeploy application and deployment group. This allows us to implement the following approach:
Toolchain stack deploys the pipeline with CodeDeploy deployment action referencing a non-existing CodeDeploy application and deployment group
When the pipeline executes, it first deploys the Service stack that creates the related CodeDeploy application and deployment group
The next pipeline action executes the CodeDeploy deployment action. When the pipeline executes the CodeDeploy deployment action, the related CodeDeploy application and deployment will already exist.
Below is the pipeline code that references the (initially non-existing) CodeDeploy application and deployment group.
To make this work, you should use the same application name and deployment group name values when creating the CodeDeploy deployment action in the pipeline and when creating the CodeDeploy application and deployment group in the Service stack (where the Amazon ECS infrastructure is deployed). This approach is necessary to avoid a circular dependency error when trying to create the CodeDeploy application and deployment group inside the Service stack and reference these objects to configure the CodeDeploy deployment action inside the pipeline. Below is the code that uses Service stack construct ID to name the CodeDeploy application and deployment group. I set the Service stack construct ID to the same name I used when creating the CodeDeploy deployment action in the pipeline.
CDK Pipelines creates roles and permissions the pipeline uses to execute deployments in different scenarios of regions and accounts. When using CodeDeploy in cross-account scenarios, CDK Pipelines deploys a cross-account support stack that creates a pipeline action role for the CodeDeploy action. This cross-account support stack is defined in a JSON file that needs to be published to the AWS CDK assets bucket in the target account. If the pipeline has the self-mutation feature on (default), the UpdatePipeline stage will do a cdk deploy to deploy changes to the pipeline. In cross-account scenarios, this deployment also involves deploying/updating the cross-account support stack. For this, the SelfMutate action in UpdatePipeline stage needs to assume CDK file-publishing and a deploy roles in the remote account.
The IAM role associated with the AWS CodeBuild project that runs the UpdatePipeline stage does not have these permissions by default. CDK Pipelines cannot grant these permissions automatically, because the information about the permissions that the cross-account stack needs is only available after the AWS CDK app finishes synthesizing. At that point, the permissions that the pipeline has are already locked-in. Hence, for cross-account scenarios, the toolchain should extend the permissions of the pipeline’s UpdatePipeline stage to include the file-publishing and deploy roles.
In cross-account environments it is possible to manually add these permissions to the UpdatePipeline stage. To accomplish that, the Toolchain stack may be used to hide this sort of implementation detail. In the end, a method like the one below can be used to add these missing permissions. For each different mapping of stage and environment in the pipeline it validates if the target account is different than the account where the pipeline is deployed. When the criteria is met, it should grant permission to the UpdatePipeline stage to assume CDK bootstrap roles (tagged using key aws-cdk:bootstrap-role) in the target account (with the tag value as file-publishing or deploy). The example below shows how to add permissions to the UpdatePipeline stage:
Let’s consider a pipeline that has a single deployment stage, UAT. The UAT stage deploys a DemoService. For that, it requires four actions: DemoService-UAT (Prepare and Deploy), ConfigureBlueGreenDeploy and Deploy.
The DemoService-UAT.Deploy action will create the ECS resources and the CodeDeploy application and deployment group. The ConfigureBlueGreenDeploy action will read the AWS CDK cloud assembly. It uses the configuration files to identify the Amazon Elastic Container Registry (Amazon ECR) repository and the container image tag pushed. The pipeline will send this information to the Deploy action. The Deploy action starts the deployment using CodeDeploy.
Solution Overview
As a convenience, I created an application, written in Java, that solves all these challenges and can be used as an example. The application deployment follows the same 5 steps for all deployment scenarios of account and Region, and this includes the scenarios represented in the following design:
Conclusion
In this post, I identified, explained and solved challenges associated with the creation of a pipeline that deploys a service to Amazon ECS using CodeDeploy in different combinations of accounts and regions. I also introduced a demo application that implements these recommendations. The sample code can be extended to implement more elaborate scenarios. These scenarios might include automated testing, automated deployment rollbacks, or disaster recovery. I wish you success in your transformative journey.
Customers often need to architect solutions to support components across multiple cloud service providers, a need which may arise if they have acquired a company running on another cloud, or for functional purposes where specific services provide a differentiated capability. In this post, we will show you how to use the AWS Cloud Development Kit (AWS CDK) to create a single pane of glass for managing your multicloud resources.
AWS CDK is an open source framework that builds on the underlying functionality provided by AWS CloudFormation. It allows developers to define cloud resources using common programming languages and an abstraction model based on reusable components called constructs. There is a misconception that CloudFormation and CDK can only be used to provision resources on AWS, but this is not the case. The CloudFormation registry, with support for third party resource types, along with custom resource providers, allow for any resource that can be configured via an API to be created and managed, regardless of where it is located.
Multicloud solution design paradigm
Multicloud solutions are often designed with services grouped and separated by cloud, creating a segregation of resource and functions within the design. This approach leads to a duplication of layers of the solution, most commonly a duplication of resources and the deployment processes for each environment. This duplication increases cost, and leads to a complexity of management increasing the potential break points within the solution or practice.
Along with simplifying resource deployments, and the ever-increasing complexity of customer needs, so too has the need increased for the capability of IaC solutions to deploy resources across hybrid or multicloud environments. Through meeting this need, a proliferation of supported tools, frameworks, languages, and practices has created “choice overload”. At worst, this scares the non-cloud-savvy away from adopting an IaC solution benefiting their cloud journey, and at best confuses the very reason for adopting an IaC practice.
A single pane of glass
Systems Thinking is a holistic approach that focuses on the way a system’s constituent parts interrelate and how systems work as a whole especially over time and within the context of larger systems. Systems thinking is commonly accepted as the backbone of a successful systems engineering approach. Designing solutions taking a full systems view, based on the component’s function and interrelation within the system across environments, more closely aligns with the ability to handle the deployment of each cloud-specific resource, from a single control plane.
While AWS provides a list of services that can be used to help design, manage and operate hybrid and multicloud solutions, with AWS as the primary cloud you can go beyond just using services to support multicloud. CloudFormation registry resource types model and provision resources using custom logic, as a component of stacks in CloudFormation. Public extensions are not only provided by AWS, but third-party extensions are made available for general use by publishers other than AWS, meaning customers can create their own extensions and publish them for anyone to use.
The AWS CDK, which has a 1:1 mapping of all AWS CloudFormation resources, as well as a library of abstracted constructs, supports the ability to import custom AWS CloudFormation extensions, enabling customers and partners to create custom AWS CDK constructs for their extensions. The chosen programming language can be used to inherit and abstract the custom resource into reusable AWS CDK constructs, allowing developers to create solutions that contain native AWS extensions along with secondary hybrid or alternate cloud resources.
Providing the ability to integrate mixed resources in the same stack more closely aligns with the functional design and often diagrammatic depiction of the solution. In essence, we are creating a single IaC pane of glass over the entire solution, deployed through a single control plane. This lowers the complexity and the cost of maintaining separate modules and deployment pipelines across multiple cloud providers.
A common use case for a multicloud: disaster recovery
One of the most common use cases of the requirement for using components across different cloud providers is the need to maintain data sovereignty while designing disaster recovery (DR) into a solution.
Data sovereignty is the idea that data is subject to the laws of where it is physically located, and in some countries extends to regulations that if data is collected from citizens of a geographical area, then the data must reside in servers located in jurisdictions of that geographical area or in countries with a similar scope and rigor in their protection laws.
This requires organizations to remain in compliance with their host country, and in cases such as state government agencies, a stricter scope of within state boundaries, data sovereignty regulations. Unfortunately, not all countries, and especially not all states, have multiple AWS regions to select from when designing where their primary and recovery data backups will reside. Therefore, the DR solution needs to take advantage of multiple cloud providers in the same geography, and as such a solution must be designed to backup or replicate data across providers.
The multicloud solution
A multicloud solution to the proposed use case would be the backup of data from an AWS resource such as an Amazon S3 bucket to another cloud provider within the same geography, such as an Azure Blob Storage container, using AWS event driven behaviour to trigger the copying of data from the primary AWS resource to the secondary Azure backup resource.
Following the IaC single pane of glass approach, the Azure Blob Storage container is created as a resource type in the CloudFormation Registry, and imported into the AWS CDK to be used as a construct in the solution. However, before the extension resource type can be used effectively in the CDK as a reusable construct and added to your private library, you will first need to go through the import into CDK process for creating Constructs.
There are three different levels of constructs, beginning with low-level constructs, which are called CFN Resources (or L1, short for “layer 1”). These constructs directly represent all resources available in AWS CloudFormation. They are named CfnXyz, where Xyz is name of the resource.
Layer 1 Construct
In this example, an L1 construct named CfnAzureBlobStorage represents an Azure::BlobStorage AWS CloudFormation extension. Here you also explicitly configure the ref property, in order for higher level constructs to access the Output value which will be the Azure blob container url being provisioned.
As with every CDK Construct, the constructor arguments are scope, id and props. scope and id are propagated to the cdk.Construct base class. The props argument is of type CfnAzureBlobStorageProps which includes four properties all of type string. This is how the Azure credentials are propagated down from upstream constructs.
Layer 2 Construct
The next level of constructs, L2, also represent AWS resources, but with a higher-level, intent-based API. They provide similar functionality, but incorporate the defaults, boilerplate, and glue logic you’d be writing yourself with a CFN Resource construct. They also provide convenience methods that make it simpler to work with the resource.
In this example, an L2 construct is created to abstract the CfnAzureBlobStorage L1 construct and provides additional properties and methods.
The custom L2 construct class is declared as AzureBlobStorage, this time without the Cfn prefix to represent an L2 construct. This time the constructor arguments include the Azure credentials and client secret, and the ref from the L1 construct us output to the public variable AzureBlobContainerUrl.
As an L2 construct, the AzureBlobStorage construct could be used in CDK Apps along with AWS Resource Constructs in the same Stack, to be provisioned through AWS CloudFormation creating the IaC single pane of glass for a multicloud solution.
Layer 3 Construct
The true value of the CDK construct programming model is in the ability to extend L2 constructs, which represent a single resource, into a composition of multiple constructs that provide a solution for a common task. These are Layer 3, L3, Constructs also known as patterns.
In this example, the L3 construct represents the solution architecture to backup objects uploaded to an Amazon S3 bucket into an Azure Blob Storage container in real-time, using AWS Lambda to process event notifications from Amazon S3.
import { RemovalPolicy, Duration, CfnOutput } from "aws-cdk-lib";
import { Bucket, BlockPublicAccess, EventType } from "aws-cdk-lib/aws-s3";
import { DockerImageFunction, DockerImageCode } from "aws-cdk-lib/aws-lambda";
import { PolicyStatement, Effect } from "aws-cdk-lib/aws-iam";
import { LambdaDestination } from "aws-cdk-lib/aws-s3-notifications";
import { IStringParameter, StringParameter } from "aws-cdk-lib/aws-ssm";
import { Secret, ISecret } from "aws-cdk-lib/aws-secretsmanager";
import { Construct } from "constructs";
import { AzureBlobStorage } from "./azure-blob-storage";

// L3 Construct
export class S3ToAzureBackupService extends Construct {
  constructor(
    scope: Construct,
    id: string,
    azureSubscriptionIdParamName: string,
    azureClientIdParamName: string,
    azureTenantIdParamName: string,
    azureClientSecretName: string
  ) {
    super(scope, id);

    // Retrieve existing SSM Parameters
    const azureSubscriptionIdParameter = this.getSSMParameter("AzureSubscriptionIdParam", azureSubscriptionIdParamName);
    const azureClientIdParameter = this.getSSMParameter("AzureClientIdParam", azureClientIdParamName);
    const azureTenantIdParameter = this.getSSMParameter("AzureTenantIdParam", azureTenantIdParamName);

    // Retrieve existing Azure Client Secret
    const azureClientSecret = this.getSecret("AzureClientSecret", azureClientSecretName);

    // Create an S3 bucket
    const sourceBucket = new Bucket(this, "SourceBucketForAzureBlob", {
      removalPolicy: RemovalPolicy.RETAIN,
      blockPublicAccess: BlockPublicAccess.BLOCK_ALL,
    });

    // Create a corresponding Azure Blob Storage account and a Blob Container
    const azurebBlobStorage = new AzureBlobStorage(
      this,
      "MyCustomAzureBlobStorage",
      azureSubscriptionIdParameter.stringValue,
      azureClientIdParameter.stringValue,
      azureTenantIdParameter.stringValue,
      azureClientSecretName
    );

    // Create a lambda function that will receive notifications from S3 bucket
    // and copy the new uploaded object to Azure Blob Storage
    const copyObjectToAzureLambda = new DockerImageFunction(
      this,
      "CopyObjectsToAzureLambda",
      {
        timeout: Duration.seconds(60),
        code: DockerImageCode.fromImageAsset("copy_s3_fn_code", {
          buildArgs: {
            "--platform": "linux/amd64"
          }
        }),
      },
    );

    // Add an IAM policy statement to allow the Lambda function to access the
    // S3 bucket
    sourceBucket.grantRead(copyObjectToAzureLambda);

    // Add an IAM policy statement to allow the Lambda function to get the contents
    // of an S3 object
    copyObjectToAzureLambda.addToRolePolicy(
      new PolicyStatement({
        effect: Effect.ALLOW,
        actions: ["s3:GetObject"],
        resources: [`arn:aws:s3:::${sourceBucket.bucketName}/*`],
      })
    );

    // Set up an S3 bucket notification to trigger the Lambda function
    // when an object is uploaded
    sourceBucket.addEventNotification(
      EventType.OBJECT_CREATED,
      new LambdaDestination(copyObjectToAzureLambda)
    );

    // Grant the Lambda function read access to existing SSM Parameters
    azureSubscriptionIdParameter.grantRead(copyObjectToAzureLambda);
    azureClientIdParameter.grantRead(copyObjectToAzureLambda);
    azureTenantIdParameter.grantRead(copyObjectToAzureLambda);

    // Put the Azure Blob Container Url into SSM Parameter Store
    this.createStringSSMParameter(
      "AzureBlobContainerUrl",
      "Azure blob container URL",
      "/s3toazurebackupservice/azureblobcontainerurl",
      azurebBlobStorage.blobContainerUrl,
      copyObjectToAzureLambda
    );

    // Grant the Lambda function read access to the secret
    azureClientSecret.grantRead(copyObjectToAzureLambda);

    // Output S3 bucket arn
    new CfnOutput(this, "sourceBucketArn", {
      value: sourceBucket.bucketArn,
      exportName: "sourceBucketArn",
    });

    // Output the Blob Conatiner Url
    new CfnOutput(this, "azureBlobContainerUrl", {
      value: azurebBlobStorage.blobContainerUrl,
      exportName: "azureBlobContainerUrl",
    });
  }

}
The custom L3 construct can be used in larger IaC solutions by calling the class called S3ToAzureBackupService and providing the Azure credentials and client secret as properties to the constructor.
import * as cdk from "aws-cdk-lib";
import { Construct } from "constructs";
import { S3ToAzureBackupService } from "./s3-to-azure-backup-service";

export class MultiCloudBackupCdkStack extends cdk.Stack {
  constructor(scope: Construct, id: string, props?: cdk.StackProps) {
    super(scope, id, props);

    const s3ToAzureBackupService = new S3ToAzureBackupService(
      this,
      "MyMultiCloudBackupService",
      "/s3toazurebackupservice/azuresubscriptionid",
      "/s3toazurebackupservice/azureclientid",
      "/s3toazurebackupservice/azuretenantid",
      "s3toazurebackupservice/azureclientsecret"
    );
  }
}
Solution Diagram
Diagram 1: IaC Single Control Plane, demonstrates the concept of the Azure Blob Storage extension being imported from the AWS CloudFormation Registry into AWS CDK as an L1 CfnResource, wrapped into an L2 Construct and used in an L3 pattern alongside AWS resources to perform the specific task of backing up from and Amazon s3 Bucket into an Azure Blob Storage Container.
Diagram 1: IaC Single Control Plan
The CDK application is then synthesized into one or more AWS CloudFormation Templates, which result in the CloudFormation service deploying AWS resource configurations to AWS and Azure resource configurations to Azure.
This solution demonstrates not only how to consolidate the management of secondary cloud resources into a unified infrastructure stack in AWS, but also the improved productivity by eliminating the complexity and cost of operating multiple deployment mechanisms into multiple public cloud environments.
The following video demonstrates an example in real-time of the end-state solution:
Next Steps
While this was just a straightforward example, with the same approach you can use your imagination to come up with even more and complex scenarios where AWS CDK can be used as a single pane of glass for IaC to manage multicloud and hybrid solutions.
To get started with the solution discussed in this post, this workshop will provide you with the instructions you need to understand the steps required to create the S3ToAzureBackupService.
Once you have learned how to create AWS CloudFormation extensions and develop them into AWS CDK Constructs, you will learn how, with just a few lines of code, you can develop reusable multicloud unified IaC solutions that deploy through a single AWS control plane.
Conclusion
By adopting AWS CloudFormation extensions and AWS CDK, deployed through a single AWS control plane, the cost and complexity of maintaining deployment pipelines across multiple cloud providers is reduced to a single holistic solution-focused pipeline. The techniques demonstrated in this post and the related workshop provide a capability to simplify the design of complex systems, improve the management of integration, and more closely align the IaC and deployment management practices with the design.
The AWS Cloud spans more than 30 geographic regions around the world and is continuously adding new locations. When a new region launches, a core set of services are included with additional services launching within 12 months of a new region launch. As your business grows, so do your needs to expand to new regions and new markets, and it’s imperative that you understand which services and features are available in a region prior to launching your workload.
In this post, I’ll demonstrate how you can query the AWS CloudFormation registry to identify which services and features are supported within a region, so you can make informed decisions on which regions are currently compatible with your application’s requirements.
CloudFormation registry
The CloudFormation registry contains information about the AWS and third-party extensions, such as resources, modules, and hooks, that are available for use in your AWS account. You can utilize the CloudFormation API to provide a list of all the available AWS public extensions within a region. As resource availability may vary by region, you can refer to the CloudFormation registry for that region to gain an accurate list of that region’s service and feature offerings.
To view the AWS public extensions available in the region, you can use the following AWS Command Line Interface (AWS CLI) command which calls the list-types CloudFormation API. This API call returns summary information about extensions that have been registered with the CloudFormation registry. To learn more about the AWS CLI, please check out our Get started with the AWS CLI documentation page.
aws cloudformation list-types --visibility PUBLIC --filters Category=AWS_TYPES --region us-east-2
The output of this command is the list of CloudFormation extensions available in the us-east-2 region. The call has been filtered to restrict the visibility to PUBLIC which limits the returned list to extensions that are publicly visible and available to be activated within any AWS account. It is also filtered to AWS_TYPES only for Category to only list extensions available for use from Amazon. The region filter determines which region to use and therefore which region’s CloudFormation registry types to list. A snippet of the output of this command is below:
{
  "TypeSummaries": [
    {
      "Type": "RESOURCE",
      "TypeName": "AWS::ACMPCA::Certificate",
      "TypeArn": "arn:aws:cloudformation:us-east-2::type/resource/AWS-ACMPCA-Certificate",
      "LastUpdated": "2023-07-20T13:58:56.947000+00:00",
      "Description": "A certificate issued via a private certificate authority"
    },
    {
      "Type": "RESOURCE",
      "TypeName": "AWS::ACMPCA::CertificateAuthority",
      "TypeArn": "arn:aws:cloudformation:us-east-2::type/resource/AWS-ACMPCA-CertificateAuthority",
      "LastUpdated": "2023-07-19T14:06:07.618000+00:00",
      "Description": "Private certificate authority."
    },
    {
      "Type": "RESOURCE",
      "TypeName": "AWS::ACMPCA::CertificateAuthorityActivation",
      "TypeArn": "arn:aws:cloudformation:us-east-2::type/resource/AWS-ACMPCA-CertificateAuthorityActivation",
      "LastUpdated": "2023-07-20T13:45:58.300000+00:00",
      "Description": "Used to install the certificate authority certificate and update the certificate authority status."
    }
  ]
}
You can also perform client-side filtering and set the output format on the AWS CLI’s response to make the list of resource types easy to parse. In the command below the output parameter is set to text and used with the query parameter to return only the TypeName field for each resource type.
aws cloudformation list-types --visibility PUBLIC --filters Category=AWS_TYPES --region us-east-2 --output text --query 'TypeSummaries[*].[TypeName]'
It removes the extraneous definition information such as description and last updated sections. A snippet of the resulting output looks like this:
Now you have a method of generating a consolidated list of all the resource types CloudFormation supports within the us-east-2 region.
Comparing two regions
Now that you know how to generate a list of CloudFormation resource types in a region, you can compare with a region you plan to expand your workload to, such as the Israel (Tel Aviv) region which just launched in August of 2023. This region launched with core services available, and AWS service teams are hard at work bringing additional services and features to the region.
Adjust your command above by changing the region parameter from us-east-2 to il-central-1 which will allow you to list all the CloudFormation resource types in the Israel (Tel Aviv) region.
aws cloudformation list-types --visibility PUBLIC --filters Category=AWS_TYPES --region il-central-1 --output text --query 'TypeSummaries[*].[TypeName]'
Now compare the differences between the two regions to understand which services and features may not have launched in the Israel (Tel Aviv) region yet. You can use the diff command to compare the output of the two CloudFormation registry queries:
diff -y <(aws cloudformation list-types --visibility PUBLIC --filters Category=AWS_TYPES --region us-east-2 --output text --query 'TypeSummaries[*].[TypeName]') <(aws cloudformation list-types --visibility PUBLIC --filters Category=AWS_TYPES --region il-central-1 --output text --query 'TypeSummaries[*].[TypeName]')
Here’s an example snippet of the command’s output:
Here, you see regional service parity of services supported by CloudFormation, down to the feature level. Amazon Simple Storage Service (Amazon S3) is a core service that was available at Israel (Tel Aviv) region’s launch. However, certain Amazon S3 features such as Storage Lens and Multi-Region Access Points are not yet launched in the region.
With this level of detail, you are able to accurately determine if the region you’re considering for expansion currently has the service and feature offerings necessary to support your workload.
Evaluating CloudFormation stacks
Now that you know how to compare the CloudFormation resource types supported between two regions, you can make this more applicable by evaluating an existing CloudFormation stack and determining if the resource types specified in the stack are available in a region.
You can use the list-stack-resources API to query the stack and return the list of resource types used within it. You again use client-side filtering and set the output format on the AWS CLI’s response to make the list of resource types easy to parse.
Next, use the below command which uses grep with the -v flag to compare the Israel (Tel Aviv) region’s available CloudFormation registry resource types with the resource types used in the CloudFormation stack.
grep -v -f <(aws cloudformation list-types --visibility PUBLIC --filters Category=AWS_TYPES --region il-central-1 --output text --query 'TypeSummaries[*].[TypeName]') <(aws cloudformation list-stack-resources --stack-name PHPHelloWorldSample --region us-east-2 --output text --query 'StackResourceSummaries[*].[ResourceType]')
The output is blank, which indicates all of the CloudFormation resource types specified in the stack are available in the Israel (Tel Aviv) region.
Now try an example where a service or feature may not yet be launched in the region, AWS Cloud9 for example. Update the stack template to include the AWS::Cloud9::EnvironmentEC2 resource type. To do this, include the following lines within the CloudFormation template json file’s Resources section as shown below and update the stack. Instructions on how to modify a CloudFormation template and update the stack can be found in the AWS CloudFormation stack updates documentation.
grep -v -f <(aws cloudformation list-types --visibility PUBLIC --filters Category=AWS_TYPES --region il-central-1 --output text --query 'TypeSummaries[*].[TypeName]') <(aws cloudformation list-stack-resources --stack-name PHPHelloWorldSample --region us-east-2 --output text --query 'StackResourceSummaries[*].[ResourceType]')
The output returns the below line indicating the AWS::Cloud9::EnvironmentEC2 resource type is not present in the CloudFormation registry for the Israel (Tel Aviv), yet. You would not be able to deploy this resource type in that region.
AWS::Cloud9::EnvironmentEC2
To clean-up, delete the stack you deployed by following our documentation on Deleting a stack.
This solution can be expanded to evaluate all of your CloudFormation stacks within a region. To do this, you would use the list-stacks API to list all of your stack names and then loop through each one by calling the list-stack-resources API to generate a list of all the resource types used in your CloudFormation stacks within the region. Finally, you’d use the grep example above to compare the list of resource types contained in all of your stacks with the CloudFormation registry for the region.
A note on opt-in regions
If you intend to compare a newly launched region, you need to first enable the region which will then allow you to perform the AWS CLI queries provided above. This is because only regions introduced prior to March 20, 2019 are all enabled by default. For example, to query the Israel (Tel Aviv) region you must first enable the region. You can learn more about how to enable new AWS Regions on our documentation page, Specifying which AWS Regions your account can use.
Conclusion
In this blog post, I demonstrated how you can query the CloudFormation registry to compare resource availability between two regions. I also showed how you can evaluate existing CloudFormation stacks to determine if they are compatible in another region. With this solution, you can make informed decisions regarding your regional expansion based on the current service and feature offerings within a region. While this is an effective solution to compare regional availability, please consider these key points:
This is a point in time snapshot of a region’s service offerings and service teams are regularly adding services and features following a new region launch. I recommend you share your interest for local region delivery and/or request service roadmap information by contacting your AWS sales representative.
A feature may not yet have CloudFormation support within the region which means it won’t display in the registry, even though the feature may be available via Console or API within the region.
This solution will not provide details on the properties available within a resource type.
The AWS Cloud Development Kit (AWS CDK) is a popular open source toolkit that allows developers to create their cloud infrastructure using high level programming languages. AWS CDK comes bundled with a construct called CDK Pipelines that makes it easy to set up continuous integration, delivery, and deployment with AWS CodePipeline. The CDK Pipelines construct does all the heavy lifting, such as setting up appropriate AWS IAM roles for deployment across regions and accounts, Amazon Simple Storage Service (Amazon S3) buckets to store build artifacts, and an AWS CodeBuild project to build, test, and deploy the app. The pipeline deploys a given CDK application as one or more AWS CloudFormation stacks.
With CloudFormation stacks, there is the possibility that someone can manually change the configuration of stack resources outside the purview of CloudFormation and the pipeline that deploys the stack. This causes the deployed resources to be inconsistent with the intent in the application, which is referred to as “drift”, a situation that can make the application’s behavior unpredictable. For example, when troubleshooting an application, if the application has drifted in production, it is difficult to reproduce the same behavior in a development environment. In other cases, it may introduce security vulnerabilities in the application. For example, an AWS EC2 SecurityGroup that was originally deployed to allow ingress traffic from a specific IP address might potentially be opened up to allow traffic from all IP addresses.
CloudFormation offers a drift detection feature for stacks and stack resources to detect configuration changes that are made outside of CloudFormation. The stack/resource is considered as drifted if its configuration does not match the expected configuration defined in the CloudFormation template and by extension the CDK code that synthesized it.
In this blog post you will see how CloudFormation drift detection can be integrated as a pre-deployment validation step in CDK Pipelines using an event driven approach.
Amazon EventBridge is a serverless AWS service that offers an agile mechanism for the developers to spin up loosely coupled, event driven applications at scale. EventBridge supports routing of events between services via an event bus. EventBridge out of the box supports a default event bus for each account which receives events from AWS services. Last year, CloudFormation added a new feature that enables event notifications for changes made to CloudFormation-based stacks and resources. These notifications are accessible through Amazon EventBridge, allowing users to monitor and react to changes in their CloudFormation infrastructure using event-driven workflows. Our solution leverages the drift detection events that are now supported by EventBridge. The following architecture diagram depicts the flow of events involved in successfully performing drift detection in CDK Pipelines.
Architecture diagram
The user starts the pipeline by checking code into an AWS CodeCommit repo, which acts as the pipeline source. We have configured drift detection in the pipeline as a custom step backed by a lambda function. When the drift detection step invokes the provider lambda function, it first starts the drift detection on the CloudFormation stack Demo Stack and then saves the drift_detection_id along with pipeline_job_id in a DynamoDB table. In the meantime, the pipeline waits for a response on the status of drift detection.
The EventBridge rules are set up to capture the drift detection state change events for Demo Stack that are received by the default event bus. The callback lambda is registered as the intended target for the rules. When drift detection completes, it triggers the EventBridge rule which in turn invokes the callback lambda function with stack status as either DRIFTED or IN SYNC. The callback lambda function pulls the pipeline_job_id from DynamoDB and sends the appropriate status back to the pipeline, thus propelling the pipeline out of the wait state. If the stack is in the IN SYNC status, the callback lambda sends a success status and the pipeline continues with the deployment. If the stack is in the DRIFTED status, callback lambda sends failure status back to the pipeline and the pipeline run ends up in failure.
Solution Deep Dive
The solution deploys two stacks as shown in the above architecture diagram
CDK Pipelines stack
Pre-requisite stack
The CDK Pipelines stack defines a pipeline with a CodeCommit source and drift detection step integrated into it. The pre-requisite stack deploys following resources that are required by the CDK Pipelines stack.
A Lambda function that implements drift detection step
A DynamoDB table that holds drift_detection_id and pipeline_job_id
An Event bridge rule to capture “CloudFormation Drift Detection Status Change” event
A callback lambda function that evaluates status of drift detection and sends status back to the pipeline by looking up the data captured in DynamoDB.
The pre-requisites stack is deployed first, followed by the CDK Pipelines stack.
Defining drift detection step
CDK Pipelines offers a mechanism to define your own step that requires custom implementation. A step corresponds to a custom action in CodePipeline such as invoke lambda function. It can exist as a pre or post deployment action in a given stage of the pipeline. For example, your organization’s policies may require its CI/CD pipelines to run a security vulnerability scan as a prerequisite before deployment. You can build this as a custom step in your CDK Pipelines. In this post, you will use the same mechanism for adding the drift detection step in the pipeline.
You start by defining a class called DriftDetectionStep that extends Step and implements ICodePipelineActionFactory as shown in the following code snippet. The constructor accepts 3 parameters stackName, account, region as inputs. When the pipeline runs the step, it invokes the drift detection lambda function with these parameters wrapped inside userParameters variable. The function produceAction() adds the action to invoke drift detection lambda function to the pipeline stage.
Please note that the solution uses an SSM parameter to inject the lambda function ARN into the pipeline stack. So, we deploy the provider lambda function as part of pre-requisites stack before the pipeline stack and publish its ARN to the SSM parameter. The CDK code to deploy pre-requisites stack can be found here.
export class DriftDetectionStep
    extends Step
    implements pipelines.ICodePipelineActionFactory
{
    constructor(
        private readonly stackName: string,
        private readonly account: string,
        private readonly region: string
    ) {
        super(`DriftDetectionStep-${stackName}`);
    }

    public produceAction(
        stage: codepipeline.IStage,
        options: ProduceActionOptions
    ): CodePipelineActionFactoryResult {
        // Define the configuraton for the action that is added to the pipeline.
        stage.addAction(
            new cpactions.LambdaInvokeAction({
                actionName: options.actionName,
                runOrder: options.runOrder,
                lambda: lambda.Function.fromFunctionArn(
                    options.scope,
                    `InitiateDriftDetectLambda-${this.stackName}`,
                    ssm.StringParameter.valueForStringParameter(
                        options.scope,
                        SSM_PARAM_DRIFT_DETECT_LAMBDA_ARN
                    )
                ),
                // These are the parameters passed to the drift detection step implementaton provider lambda
                userParameters: {
                    stackName: this.stackName,
                    account: this.account,
                    region: this.region,
                },
            })
        );
        return {
            runOrdersConsumed: 1,
        };
    }
}
Configuring drift detection step in CDK Pipelines
Here you will see how to integrate the previously defined drift detection step into CDK Pipelines. The pipeline has a stage called DemoStage as shown in the following code snippet. During the construction of DemoStage, we declare drift detection as the pre-deployment step. This makes sure that the pipeline always does the drift detection check prior to deployment.
Please note that for every stack defined in the stage; we add a dedicated step to perform drift detection by instantiating the class DriftDetectionStep detailed in the prior section. Thus, this solution scales with the number of stacks defined per stage.
Here you will go through the deployment steps for the solution and see drift detection in action.
Deploy the pre-requisites stack
Clone the repo from the GitHub location here. Navigate to the cloned folder and run script script-deploy.sh You can find detailed instructions in README.md
Deploy the CDK Pipelines stack
Clone the repo from the GitHub location here. Navigate to the cloned folder and run script script-deploy.sh. This deploys a pipeline with an empty CodeCommit repo as the source. The pipeline run ends up in failure, as shown below, because of the empty CodeCommit repo.
Next, check in the code from the cloned repo into the CodeCommit source repo. You can find detailed instructions on that in README.md This triggers the pipeline and pipeline finishes successfully, as shown below.
The pipeline deploys two stacks DemoStackA and DemoStackB. Each of these stacks creates an S3 bucket.
Demonstrate drift detection
Locate the S3 bucket created by DemoStackA under resources, navigate to the S3 bucket and modify the tag aws-cdk:auto-delete-objects from true to false as shown below
Now, go to the pipeline and trigger a new execution by clicking on Release Change
The pipeline run will now end in failure at the pre-deployment drift detection step.
Cleanup
Please follow the steps below to clean up all the stacks.
Navigate to S3 console and empty the buckets created by stacks DemoStackA and DemoStackB.
Navigate to the CloudFormation console and delete stacks DemoStackA and DemoStackB, since deleting CDK Pipelines stack does not delete the application stacks that the pipeline deploys.
Delete the CDK Pipelines stack cdk-drift-detect-demo-pipeline
Delete the pre-requisites stack cdk-drift-detect-demo-drift-detection-prereq
Conclusion
In this post, I showed how to add a custom implementation step in CDK Pipelines. I also used that mechanism to integrate a drift detection check as a pre-deployment step. This allows us to validate the integrity of a CloudFormation Stack before its deployment. Since the validation is integrated into the pipeline, it is easier to manage the solution in one place as part of the overarching pipeline. Give the solution a try, and then see if you can incorporate it into your organization’s delivery pipelines.
About the author:
Damodar Shenvi Wagle is a Senior Cloud Application Architect at AWS Professional Services. His areas of expertise include architecting serverless solutions, CI/CD, and automation.
Load testing is a foundational pillar of building resilient applications. Today, load testing practices across many organizations are often based on desktop tools, where someone must manually run the performance tests and validate the results before a software release can be promoted to production. This leads to increased time to market for new features and products. Load testing applications in automated CI/CD pipelines provides the following benefits:
Early and automated feedback on performance thresholds based on clearly defined benchmarks.
Consistent and reliable load testing process for every feature release.
Reduced overall time to market due to eliminated manual load testing effort.
Improved overall resiliency of the production environment.
The ability to rapidly identify and document bottlenecks and scaling limits of the production environment.
The AWS Cloud Development Kit (AWS CDK) is an open-source software development framework to define cloud infrastructure in code and provision it through AWS CloudFormation. AWS CDK Pipelines is a construct library module for continuous delivery of AWS CDK applications, powered by AWS CodePipeline. AWS CDK Pipelines can automatically build, test, and deploy the new version of your CDK app whenever the new source code is checked in.
Distributed Load Testing is an AWS Solution that automates software applications testing at scale to help you identify potential performance issues before their release. It creates and simulates thousands of users generating transactional records at a constant pace without the need to provision servers or instances.
Prerequisites
To deploy and test this solution, you will need:
AWS Command Line Interface (AWS CLI): This tutorial assumes that you have configured the AWS CLI on your workstation. Alternatively, you can use also use AWS CloudShell.
AWS CDK V2: This tutorial assumes that you have installed AWS CDK V2 on your workstation or in the CloudShell environment.
Solution Overview
In this solution, we create a CI/CD pipeline using AWS CDK Pipelines and use it to deploy a sample RESTful CDK application in two environments; development and production. We load test the application using AWS Distributed Load Testing Solution in the development environment. Based on the load test result, we either fail the pipeline or proceed to production deployment. You may consider running the load test in a dedicated testing environment that mimics the production environment.
For demonstration purposes, we use the following metrics to validate the load test results.
Average Response Time – the average response time, in seconds, for all the requests generated by the test. In this blog post we define the threshold for average response time to 1 second.
Error Count – the total number of errors. In this blog post, we define the threshold for for total number of errors to 1.
For your application, you may consider using additional metrics from the Distributed Load Testing solution documentation to validate your load test.
The AWS Lambda (Lambda) function in the architecture contains a 500 millisecond sleep statement to add latency to the API response.
Typescript code for starting the load test and validating the test results. This code is executed in the ‘Load Test’ step of the ‘Development Deployment’ stage. It starts a load test against the sample restful application endpoint and waits for the test to finish. For demonstration purposes, the load test is started with the following parameters:
Concurrency: 1
Task Count: 1
Ramp up time: 0 secs
Hold for: 30 sec
End point to test: endpoint for the sample RESTful application.
For the purposes of this blog, we deploy the CI/CD pipeline, the RESTful application and the AWS Distributed Load Testing solution into the same AWS account. In your environment, you may consider deploying these stacks into separate AWS accounts based on your security and governance requirements.
To deploy the solution components
Follow the instructions in the the AWS Distributed Load Testing solution Automated Deployment guide to deploy the solution. Note down the value of the CloudFormation output parameter ‘DLTApiEndpoint’. We will need this in the next steps. Proceed to the next step once you are able to login to the User Interface of the solution.
Deploy the CloudFormation stack for the CI/CD pipeline. This step will also commit the AWS CDK code for the sample RESTful application stack and start the application deployment.
cd pipeline && cdk bootstrap && cdk deploy --require-approval never
Follow the below steps to view the load test results:
Open the AWS CodePipeline console.
Click on the pipeline named “blog-pipeline”.
Observe that one of the stages (named ‘LoadTest’) in the CI/CD pipeline (that was provisioned by the CloudFormation stack in the previous step) executes a load test against the application Development environment.
Click on the details of the ‘LoadTest’ step to view the test results. Notice that the load test succeeded.
Change the response time threshold
In this step, we will modify the response time threshold from 1 second to 200 milliseconds in order to introduce a load test failure. Remember from the steps earlier that the Lambda function code has a 500 millisecond sleep statement to add latency to the API response time.
From the AWS Console and then go to CodeCommit. The source for the pipeline is a CodeCommit repository named “blog-repo”.
Click on the “blog-repo” repository, and then browse to the “pipeline” folder. Click on file ‘loadTestEnvVariables.json’ and then ‘Edit’.
Set the response time threshold to 200 milliseconds by changing attribute ‘AVG_RT_THRESHOLD’ value to ‘.2’. Click on the commit button. This will start will start the CI/CD pipeline.
Go to CodePipeline from the AWS console and click on the ‘blog-pipeline’.
Observe the ‘LoadTest’ step in ‘Development-Deploy’ stage will fail in about five minutes, and the pipeline will not proceed to the ‘Production-Deploy’ stage.
Click on the details of the ‘LoadTest’ step to view the test results. Notice that the load test failed.
Log into the Distributed Load Testing Service console. You will see two tests named ‘sampleScenario’. Click on each of them to see the test result details.
Cleanup
Delete the CloudFormation stack that deployed the sample application.
From the AWS Console, go to CloudFormation and delete the stacks ‘Production-Deploy-Application’ and ‘Development-Deploy-Application’.
Delete the CI/CD pipeline.
cd pipeline && cdk destroy
Delete the Distributed Load Testing Service CloudFormation stack.
From CloudFormation console, delete the stack for Distributed Load Testing service that you created earlier.
Conclusion
In the post above, we demonstrated how to automatically load test your applications in a CI/CD pipeline using AWS CDK Pipelines and AWS Distributed Load Testing solution. We defined the performance bench marks for our application as configuration. We then used these benchmarks to automatically validate the application performance prior to production deployment. Based on the load test results, we either proceeded to production deployment or failed the pipeline.
Starting today, you can deploy on your AWS account an end-to-end solution to capture, ingest, store, analyze, and visualize your customers’ clickstreams inside your web and mobile applications (both for Android and iOS). The solution is built on top of standard AWS services.
This new solution Clickstream Analytics on AWS allows you to keep your data in the security and compliance perimeter of your AWS account and customize the processing and analytics as you require, giving you the full flexibility to extract value for your business. For example, many business line owners want to combine clickstream analytics data with business system data to gain more comprehensive insights. Storing clickstream analysis data in your AWS account allows you to cross reference the data with your existing business system, which is complex to implement when you use a third-party analytics solution that creates an artificial data silo.
Why Analyze Your Applications Clickstreams? Organizations today are in search of vetted solutions and architectural guidance to rapidly solve business challenges. Whether you prefer off-the-shelf deployments or customizable architectures, the AWS Solutions Library carries solutions built by AWS and AWS Partners for a broad range of industry and technology use cases.
When I talk with mobile and web application developers or product owners, you often tell me that you want to use a clickstream analysis solution to understand your customers’ behavior inside your application. Click stream analysis solutions help you to identify popular and frequently visited screens, analyze navigation patterns, identify bottlenecks and drop-off points, or perform A/B testing of functionalities such as the pay wall, but you face two challenges to adopt or build a click stream analysis solution.
Either you use a third-party library and analytics solution that sends all your application and customer data to an external provider, which causes security and compliance risks and makes it more difficult to reference your existing business data to enrich the analysis, or you dedicate time and resources to build your own solution based on AWS services, such as Amazon Kinesis (for data ingestion), Amazon EMR (for processing), Amazon Redshift (for storage), and Amazon QuickSight (for visualization). Doing so ensures your application and customer data stay in the security perimeter of your AWS account, which is already approved and vetted by your information and security team. Often, building such a solution is an undifferentiated task that drives resources and budget away from developing the core business of your application.
Introducing Clickstream Analytics on AWS The new solution Clickstream Analytics on AWS provides you with a backend for data ingestion, processing, and visualization of click stream data. It’s shipped as an AWS CloudFormation template that you can easily deploy into the AWS account of your choice.
In addition to the backend component, the solution provides you with purpose-built Java and Swift SDKs to integrate into your mobile applications (for both Android and iOS). The SDKs automatically collects data and provide developers with an easy-to-use API to collect application-specific data. They manage the low-level tasks of buffering the data locally, sending them to the backend, managing the retries in case of communication errors, and more.
The following diagram shows you the high-level architecture of the solution.
The solution comes with an easy-to-use console to configure your solution. For example, it allows you to choose between three AWS services to ingest the application clickstream data: Amazon Managed Streaming for Apache Kafka, Amazon Kinesis Data Streams, or Amazon Simple Storage Service (Amazon S3). You can create multiple data pipelines for multiple applications or teams, each using a different configuration. This allows you to adjust the backend to the application user base and requirements.
You can use plugins to transform the data during the processing phase. The solution comes with two plugins preinstalled: User-Agent enrichment and IP address enrichment to add additional data that’s related to the User-Agent and the geolocation of the IP address used by the client applications.
By default, it provides a Amazon Redshift Serverless cluster to minimize the costs, but you can select a provisionedAmazon Redshift configuration to meet your performance and budget requirements.
Finally, the solution provides you with a set of pre-assembled visualization dashboards to report on user acquisition, user activity, and user engagement. The dashboard consumes the data available in Amazon Redshift. You’re free to develop other analytics and other dashboards using the tools and services of your choice.
Let’s See It in Action The best way to learn how to deploy and to configure Clickstream Analytics on AWS is to follow the tutorial steps provided by the Clickstream Analytics on AWS workshop.
The workshop goes into great detail about each step. Here are the main steps I did to deploy the solution:
1. I create the control plane (the management console) of the solution using this CloudFormation template. The output of the template contains the URL to the management console. I later receive an email with a temporary password for the initial connection.
2. On the Clickstream Analytics console, I create my first project and define various network parameters such as the VPC, subnets, and security groups. I also select the service to use for data ingestion and my choice of configuration for Amazon Redshift.
3. When I enter all configuration data, the console creates the data plane for my application.
AWS services and solutions are usually built around a control plane and one or multiple data planes. In the context of Clickstream Analytics, the control plane is the console that I use to define my data acquisition and analysis project. The data plane is the infrastructure to receive, analyze, and visualize my application data. Now that I define my project, the console generates and launches another CloudFormation template to create and manage the data plane.
4. The Clickstream Analytics console generates a JSON configuration file to include into my application and it shares the Java or Swift code to include into my Android or iOS application. The console provides instructions to add the clickstream analysis as a dependency to my application. I also update my application code to insert the code suggested and start to deploy.
5. After my customers start to use the mobile app, I access the Clickstream Analytics dashboard to visualize the data collected.
The Dashboards Clickstream Analytics dashboards are designed to provide a holistic view of the user lifecycle: the acquisition, the engagement, the activity, and the retention. In addition, it adds visibility into user devices and geographies. The solution automatically generates visualizations in these six categories: Acquisition, Engagement, Activity, Retention, Devices, and Navigation path. Here are a couple of examples.
The Acquisition dashboard reports the total number of users, the registered number of users (the ones that signed in), and the number of users by traffic source. It also computes the new users and registered users’ trends.
The Engagement dashboard reports the user engagement level (the number of user sessions versus the time users spent on my application). Specifically, I have access to the number of engaged sessions (sessions that last more than 10 seconds or have at least two screen views), the engagement rate (the percentage of engaged sessions from the total number of sessions), and the average engagement time.
The Activity dashboard shows the event and actions taken by my customers in my application. It reports data, such as the number of events and number of views (or screens) shown, with the top events and views shown for a given amount of time.
The Retention tab shows user retention over time: the user stickiness for your daily, weekly, and monthly active users. It also shows the rate of returning users versus new users.
The Device tab shows data about your customer’s devices: operating systems, versions, screen sizes, and language.
And finally, the Path explorer dashboard shows your customers’ navigation path into the screens of your applications.
As I mentioned earlier, all the data are available in Amazon Redshift, so you’re free to build other analytics and dashboards.
Pricing and Availability The Clickstream Analytics solution is available free of charge. You pay for the AWS services provisioned for you, including Kinesis or Amazon Redshift. Cost estimates depend on the configuration that you select. For example, the size of the Kinesis and Amazon Redshift cluster you select for your data ingestion and analytics needs, or the volume of data your applications send to the pipeline both affect the monthly cost of the solution.
To learn how to get started with this solution, take the Clickstream Analytics workshop today and stop sharing your customer and application clickstream data with third-party solutions.
These critical applications require increased levels of availability to meet strict business Service Level Agreements (SLAs), even in extreme scenarios such as when EC2 functionality is impaired (see Advanced Multi-AZ Resilience Patterns for examples). Following AWS best practices such as architecting for flexibility will help here, but for some more rigid designs there can still be challenges around EC2 instance availability.
In this post, I detail an approach for Reserving Capacity for this type of scenario to mitigate the risk of the instance type(s) that your application needs being unavailable, including code for building it and ways of testing it.
Baseline: Multi-AZ application with restrictive instance needs
To focus on the problem of Capacity Reservation, our reference architecture is a simple horizontally scalable monolith. This consists of a single executable running across multiple instances as a cluster in an Auto Scaling group across three AZs for High Availability.
The application in this example is both business critical and memory intensive. It needs six r6i.4xlarge instances to meet the required specifications. R6i has been chosen to meet the required memory to vCPU requirements.
The third-party application we need to run, has a significant license cost, so we want to optimize our workload to make sure we run only the minimally required number of instances for the shortest amount of time.
The application should be resilient to issues in a single AZ. In the case of multi-AZ impact, it should failover to Disaster Recovery (DR) in an alternate Region, where service level objectives are instituted to return operations to defined parameters. But this is outside the scope for this post.
The problem: capacity during AZ failover
In this solution, the Auto Scaling Group automatically balances its instances across the selected AZs, providing a layer of resilience in the event of a disruption in a single AZ. However, this hinges on those instances being available for use in the Amazon EC2 capacity pools. The criticality of our application comes with SLAs which dictate that even the very low likelihood of instance types being unavailable in AWS must be mitigated.
The solution: Reserving Capacity
There are 2 main ways of Reserving Capacity for this scenario: (a) Running extra capacity 24/7, (b) On Demand Capacity Reservations (ODCRs).
In the past, another recommendation would have been to utilize Zonal Reserved Instances (Non Zonal will not Reserve Capacity). But although Zonal Reserved Instances do provide similar functionality as On Demand Capacity Reservations combined with Savings Plans, they do so in a less flexible way. Therefore, the recommendation from AWS is now to instead use On Demand Capacity Reservations in combination with Savings Plans for scenarios where Capacity Reservation is required.
The TCO impact of the licensing situation rules out the first of the two valid options. Merely keeping the spare capacity up and running all the time also doesn’t cover the scenario in which an instance needs to be stopped and started, for example for maintenance or patching. Without Capacity Reservation, there is a theoretical possibility that that instance type would not be available to start up again.
This leads us to the second option: On Demand Capacity Reservations.
How much capacity to reserve?
Our failure scenario is when functionality in one AZ is impaired and the Auto Scaling Group must shift its instances to the remaining AZs while maintaining the total number of instances. With a minimum requirement of six instances, this means that we need 6/2 = 3 instances worth of Reserved Capacity in each AZ (as we can’t know in advance which one will be affected).
Spinning up the solution
If you want to get hands-on experience with On Demand Capacity Reservations, refer to this CloudFormation template and its accompanying README file for details on how to spin up the solution that we’re using. The README also contains more information about the Stack architecture. Upon successful creation, you have the following architecture running in your account.
Note that the default instance type for the AWS CloudFormation stack has been downgraded to t2.micro to keep our experiment within the AWS Free Tier.
Testing the solution
Now we have a fully functioning solution with Reserved Capacity dedicated to this specific Auto Scaling Group. However, we haven’t tested it yet.
To interact with the resources created by CloudFormation, we need some names and IDs that have been collected in the “Outputs” section of the stack. These can be accessed from the console in a tab under the Stack that you have created.
We set these as variables for easy access later (replace the values with the values from your stack):
How does the solution react to scaling out the Auto Scaling Group beyond the Capacity Reservation?
First, let’s look at what happens if the Auto Scaling Group wants to Scale Out. Our requirements state that we should have a minimum of six instances running at any one time. But the solution should still adapt to increased load. Before knowing anything about how this works in AWS, imagine two scenarios:
The Auto Scaling Group can scale out to a total of nine instances, as that’s how many On Demand Capacity Reservations we have. But it can’t go beyond that even if there is On Demand capacity available.
The Auto Scaling Group can scale just as much as it could when On Demand Capacity Reservations weren’t used, and it continues to launch unreserved instances when the On Demand Capacity Reservations run out (assuming that capacity is in fact available, which is why we have the On Demand Capacity Reservations in the first place).
The instances section of the Amazon EC2 Management Console can be used to show our existing Capacity Reservations, as created by the CloudFormation stack.
As expected, this shows that we are currently using six out of our nine On Demand Capacity Reservations, with two in each AZ.
Now let’s scale out our Auto Scaling Group to 12, thus using up all On Demand Capacity Reservations in each AZ, as well as requesting one extra Instance per AZ.
The Auto Scaling Group now has the desired Capacity of 12:
And in the Capacity Reservation screen we can see that all our On Demand Capacity Reservations have been used up:
In the Auto Scaling Group we see that – as expected – we weren’t restricted to nine instances. Instead, the Auto Scaling Group fell back on launching unreserved instances when our On Demand Capacity Reservations ran out:
How does the solution react to adding a matching instance outside the Auto Scaling Group?
But what if someone else/another process in the account starts an EC2 instance of the same type for which we have the On Demand Capacity Reservations? Won’t they get that Reservation, and our Auto Scaling Group will be left short of its three instances per AZ, which would mean that we won’t have enough reservations for our minimum of six instances in case there are issues with an AZ?
This all comes down to the type of On Demand Capacity Reservation that we have created, or the “Eligibility”. Looking at our Capacity Reservations, we can see that they are all of the “targeted” type. This means that they are only used if explicitly referenced, like we’re doing in our Target Group for the Auto Scaling Group.
It’s time to prove that. First, we scale in our Auto Scaling Group so that only six instances are used, resulting in there being one unused capacity reservation in each AZ. Then, we try to add an EC2 instance manually, outside the target group.
We still have the three unutilized On Demand Capacity Reservations, as expected, proving that the On Demand Capacity Reservations with the “targeted” eligibility only get used when explicitly referenced:
How does the solution react to an AZ being removed?
Now we’re comfortable that the Auto Scaling Group can grow beyond the On Demand Capacity Reservations if needed, as long as there is capacity, and that other EC2 instances in our account won’t use the On Demand Capacity Reservations specifically purchased for the Auto Scaling Group. It’s time for the big test. How does it all behave when an AZ becomes unavailable?
For our purposes, we can simulate this scenario by changing the Auto Scaling Group to be across two AZs instead of the original three.
First, we scale out to seven instances so that we can see the impact of overflow outside the On Demand Capacity Reservations when we subsequently remove one AZ:
Give it some time, and we see that the Auto Scaling Group is now spread across two AZs, On Demand Capacity Reservations cover the minimum six instances as per our requirements, and the rest is handled by instances without Capacity Reservation:
Cleanup
It’s time to clean up, as those Instances and On Demand Capacity Reservations come at a cost!
Using a combination of Auto Scaling Groups, Resource Groups, and On Demand Capacity Reservations (ODCRs), we have built a solution that provides High Availability backed by reserved capacity, for those types of workloads where the requirements for availability in the case of an AZ becoming temporarily unavailable outweigh the increased cost of reserving capacity, and where the best practices for architecting for flexibility cannot be followed due to limitations on applicable architectures.
We have tested the solution and confirmed that the Auto Scaling Group falls back on using unreserved capacity when the On Demand Capacity Reservations are exhausted. Moreover, we confirmed that targeted On Demand Capacity Reservations won’t risk getting accidentally used by other solutions in our account.
Now it’s time for you to try it yourself! Download the IaC template and give it a try! And if you are planning on using On Demand Capacity Reservations, then don’t forget to look into Savings Plans, as they significantly reduce the cost of that Reserved Capacity..
AWS CloudFormation is an Infrastructure as Code (IaC) service that allows you to model your cloud resources in template files that can be authored or generated in a variety of languages. You can manage stacks that deploy those resources via the AWS Management Console, the AWS Command Line Interface (AWS CLI), or the API. CloudFormation helps customers to quickly and consistently deploy and manage cloud resources, but like all IaC tools, it faced challenges keeping up with the rapid pace of innovation of AWS services. In this post, we will review the history of the CloudFormation registry, which is the result of a strategy we developed to address scaling and standardization, as well as integration with other leading IaC tools and partner products. We will also give an update on the current state of CloudFormation resource coverage and review the future state, which has a goal of keeping CloudFormation and other IaC tools up to date with the latest AWS services and features.
History
The CloudFormation service was first announced in February of 2011, with sample templates that showed how to deploy common applications like blogs and wikis. At launch, CloudFormation supported 13 out of 15 available AWS services with 48 total resource types. At first, resource coverage was tightly coupled to the core CloudFormation engine, and all development on those resources was done by the CloudFormation team itself. Over the past decade, AWS has grown at a rapid pace, and there are currently 200+ services in total. A challenge over the years has been the coverage gap between what was possible for a customer to achieve using AWS services, and what was possible to define in a CloudFormation template.
It became obvious that we needed a change in strategy to scale resource development in a way that could keep up with the rapid pace of innovation set by hundreds of service teams delivering new features on a daily basis. Over the last decade, our pace of innovation has increased nearly 40-fold, with 80 significant new features launched in 2011 versus more than 3,000 in 2021. Since CloudFormation was a key adoption driver (or blocker) for new AWS services, those teams needed a way to create and manage their own resources. The goal was to enable day one support of new services at the time of launch with complete CloudFormation resource coverage.
In 2016, we launched an internal self-service platform that allowed service teams to control their own resources. This began to solve the scaling problems inherent in the prior model where the core CloudFormation team had to do all the work themselves. The benefits went beyond simply distributing developer effort, as the service teams have deep domain knowledge on their products, which allowed them to create more effective IaC components. However, as we developed resources on this model, we realized that additional design features were needed, such as standardization that could enable automatic support for features like drift detection and resource imports.
We embarked on a new project to address these concerns, with the goal of improving the internal developer experience as well as providing a public registry where customers could use the same programming model to define their own resource types. We realized that it wasn’t enough to simply make the new model available—we had to evangelize it with a training campaign, conduct engineering boot-camps, build better tooling like dashboards and deployment pipeline templates, and produce comprehensive on-boarding documentation. Most importantly, we made CloudFormation support a required item on the feature launch checklist for new services, a requirement that goes beyond documentation and is built into internal release tooling (exceptions to this requirement are rare as training and awareness around the registry have improved over time). This was a prime example of one of the maxims we repeat often at Amazon: good mechanisms are better than good intentions.
In 2019, we made this new functionality available to customers when we announced the CloudFormation registry, a capability that allowed developers to create and manage private resource types. We followed up in 2021 with the public registry where third parties, such as partners in the AWS Partner Network (APN), can publish extensions. The open source resource model that customers and partners use to publish third-party registry extensions is the same model used by AWS service teams to provide CloudFormation support for their features.
Once a service team on-boards their resources to the new resource model and builds the expected Create, Read, Update, Delete, and List (CRUDL) handlers, managed experiences like drift detection and resource import are all supported with no additional development effort. One recent example of day-1 CloudFormation support for a popular new feature was Lambda Function URLs, which offered a built-in HTTPS endpoint for single-function micro-services. We also migrated the Amazon Relational Database Service (Amazon RDS) Database Instance resource (AWS::RDS::DBInstance) to the new resource model in September 2022, and within a month, Amazon RDS delivered support for Amazon Aurora Serverless v2 in CloudFormation. This accelerated delivery is possible because teams can now publish independently by taking advantage of the de-centralized Registry ownership model.
Current State
We are building out future innovations for the CloudFormation service on top of this new standardized resource model so that customers can benefit from a consistent implementation of event handlers. We built AWS Cloud Control API on top of this new resource model. Cloud Control API takes the Create-Read-Update-Delete-List (CRUDL) handlers written for the new resource model and makes them available as a consistent API for provisioning resources. APN partner products such as HashiCorp Terraform, Pulumi, and Red Hat Ansible use Cloud Control API to stay in sync with AWS service launches without recurring development effort.
Figure 1. Cloud Control API Resource Handler Diagram
Besides 3rd party application support, the public registry can also be used by the developer community to create useful extensions on top of AWS services. A common solution to extending the capabilities of CloudFormation resources is to write a custom resource, which generally involves inline AWS Lambda function code that runs in response to CREATE, UPDATE, and DELETE signals during stack operations. Some of those use cases can now be solved by writing a registry extension resource type instead. For more information on custom resources and resource types, and the differences between the two, see Managing resources using AWS CloudFormation Resource Types.
CloudFormation Registry modules, which are building blocks authored in JSON or YAML, give customers a way to replace fragile copy-paste template reuse with template snippets that are published in the registry and consumed as if they were resource types. Best practices can be encapsulated and shared across an organization, which allows infrastructure developers to easily adhere to those best practices using modular components that abstract away the intricate details of resource configuration.
CloudFormation Registry hooks give security and compliance teams a vital tool to validate stack deployments before any resources are created, modified, or deleted. An infrastructure team can activate hooks in an account to ensure that stack deployments cannot avoid or suppress preventative controls implemented in hook handlers. Provisioning tools that are strictly client-side do not have this level of enforcement.
A useful by-product of publishing a resource type to the public registry is that you get automatic support for the AWS Cloud Development Kit (CDK) via an experimental open source repository on GitHub called cdk-cloudformation. In large organizations it is typical to see a mix of CloudFormation deployments using declarative templates and deployments that make use of the CDK in languages like TypeScript and Python. By publishing re-usable resource types to the registry, all of your developers can benefit from higher level abstractions, regardless of the tool they choose to create and deploy their applications. (Note that this project is still considered a developer preview and is subject to change)
If you want to see if a given CloudFormation resource is on the new registry model or not, check if the provisioning type is either Fully Mutable or Immutable by invoking the DescribeType API and inspecting the ProvisioningType response element.
Here is a sample CLI command that gets a description for the AWS::Lambda::Function resource, which is on the new registry model.
The difference between FULLY_MUTABLE and IMMUTABLE is the presence of the Update handler. FULLY_MUTABLE types includes an update handler to process updates to the type during stack update operations. Whereas, IMMUTABLE types do not include an update handler, so the type can’t be updated and must instead be replaced during stack update operations. Legacy resource types will be NON_PROVISIONABLE.
Opportunities for improvement
As we continue to strive towards our ultimate goal of achieving full feature coverage and a complete migration away from the legacy resource model, we are constantly identifying opportunities for improvement. We are currently addressing feature gaps in supported resources, such as tagging support for EC2 VPC Endpoints and boosting coverage for resource types to support drift detection, resource import, and Cloud Control API. We have fully migrated more than 130 resources, and acknowledge that there are many left to go, and the migration has taken longer than we initially anticipated. Our top priority is to maintain the stability of existing stacks—we simply cannot break backwards compatibility in the interest of meeting a deadline, so we are being careful and deliberate. One of the big benefits of a server-side provisioning engine like CloudFormation is operational stability—no matter how long ago you deployed a stack, any future modifications to it will work without needing to worry about upgrading client libraries. We remain committed to streamlining the migration process for service teams and making it as easy and efficient as possible.
The developer experience for creating registry extensions has some rough edges, particularly for languages other than Java, which is the language of choice on AWS service teams for their resource types. It needs to be easier to author schemas, write handler functions, and test the code to make sure it performs as expected. We are devoting more resources to the maintenance of the CLI and plugins for Python, Typescript, and Go. Our response times to issues and pull requests in these and other repositories in the aws-cloudformation GitHub organization have not been as fast as they should be, and we are making improvements. One example is the cloudformation-cli repository, where we have merged more than 30 pull requests since October of 2022.
To keep up with progress on resource coverage, check out the CloudFormation Coverage Roadmap, a GitHub project where we catalog all of the open issues to be resolved. You can submit bug reports and feature requests related to resource coverage in this repository and keep tabs on the status of open requests. One of the steps we took recently to improve responses to feature requests and bugs reported on GitHub is to create a system that converts GitHub issues into tickets in our internal issue tracker. These tickets go directly to the responsible service teams—an example is the Amazon RDS resource provider, which has hundreds of merged pull requests.
We have recently announced a new GitHub repository called community-registry-extensions where we are managing a namespace for public registry extensions. You can submit and discuss new ideas for extensions and contribute to any of the related projects. We handle the testing, validation, and deployment of all resources under the AwsCommunity:: namespace, which can be activated in any AWS account for use in your own templates.
To get started with the CloudFormation registry, visit the user guide, and then dive in to the detailed developer guide for information on how to use the CloudFormation Command Line Interface (CFN-CLI) to write your own resource types, modules, and hooks.
We recently created a new Discord server dedicated to CloudFormation. Please join us to ask questions, discuss best practices, provide feedback, or just hang out! We look forward to seeing you there.
Conclusion
In this post, we hope you gained some insights into the history of the CloudFormation registry, and the design decisions that were made during our evolution towards a standardized, scalable model for resource development that can be shared by AWS service teams, customers, and APN partners. Some of the lessons that we learned along the way might be applicable to complex design initiatives at your own company. We hope to see you on Discord and GitHub as we build out a rich set of registry resources together!
This is a guest blog post co-written with Corey Johnson from Huron.
Having an accurate and up-to-date inventory of all technical assets helps an organization ensure it can keep track of all its resources with metadata information such as their assigned oners, last updated date, used by whom, how frequently and more. It helps engineers, analysts and businesses access the most up-to-date release of the software asset that bring accuracy to the decision-making process. By keeping track of this information, organizations will be able to identify technology gaps, refresh cycles, and expire assets as needed for archival.
In addition, an inventory of all assets is one of the foundational elements of an organization that facilitates the security and compliance team to audit the assets for improving privacy, security posture and mitigate risk to ensure the business operations run smoothly. Organizations may have different ways of maintaining an asset inventory, that may be an Excel spreadsheet or a database with a fully automated system to keep it up-to-date, but with a common objective of keeping it accurate. Even if organizations can follow manual approaches to update the inventory records but it is recommended to build automation, so that it is accurate at any point of time.
The DevOps practices which revolutionized software engineering in the last decade have yet to come to the world of Business Intelligence solutions. Business intelligence tools by their nature use a paradigm of UI driven development with code-first practices being secondary or nonexistent. As the need for applications that can leverage the organizations internal and client data increases, the same DevOps practices (BIOps) can drive and delivery quality insights more reliably
In this post, we walk you through a solution that Huron and manage lifecycle for all Amazon QuickSight resources across the organization by collaborating with AWS Data Lab Resident Architect & AWS Professional Services team.
About Huron
Huron is a global professional services firm that collaborates with clients to put possible into practice by creating sound strategies, optimizing operations, accelerating digital transformation, and empowering businesses and their people to own their future. By embracing diverse perspectives, encouraging new ideas, and challenging the status quo, Huron creates sustainable results for the organizations we serve. To help address its clients’ growing cloud needs, Huron is an AWS Partner.
Use Case Overview
Huron’s Business Intelligence use case represents visualizations as a service, where Huron has core set of visualizations and dashboards available as products for its customers. The products exist in different industry verticals (healthcare, education, commercial) with independent development teams. Huron’s consultants leverage the products to provide insights as part of consulting engagements. The insights from the product help Huron’s consultants accelerate their customer’s transformation. As part of its overall suite of offerings, there are product dashboards that are featured in a software application following a standardized development lifecycle. In addition, these product dashboards may be forked for customer-specific customization to support a consulting engagement while still consuming from Huron’s productized data assets and datasets. In the next stage of the cycle, Huron’s consultants experiment with new data sources and insights that in turn fed back into the product dashboards.
When changes are made to a product analysis, challenges arise when a base reference analysis gets updated because of new feature releases or bug fixes, and all the customer visualizations that are created from it also need to be updated. To maintain the integrity of embedded visualizations, all metadata and lineage must be available to the parent application. This access to the metadata supports the need for updating visuals based on changes as well as automating row and column level security ensuring customer data is properly governed.
In addition, few customers request customizations on top of the base visualizations, for which Huron team needs to create a replica of the base reference and then customize it for the customer. These are maintained by Huron’s in the field consultants rather than the product development team. These customer specific visualizations create operational overhead because they require Huron to keep track of new customer specific visualizations and maintain them for future releases when the product visuals change.
Huron leverages Amazon QuickSight for their Business Intelligence (BI) reporting needs, enabling them to embed visualizations at scale with higher efficiency and lower cost. A large attraction for Huron to adopt QuickSight came from the forward-looking API capabilities that enable and set the foundation for a BIOps culture and technical infrastructure. To address the above requirement, Huron Global Product team decided to build a QuickSight Asset Tracker and QuickSight Asset Deployment Pipeline.
The QuickSight Asset tracker serves as a catalogue of all QuickSight resources (datasets, analysis, templates, dashboards etc.) with its interdependent relationship. It will help;
Create an inventory of all QuickSight resources across all business units
Enable dynamic embedding of visualizations and dashboards based on logged in user
Enable dynamic row and column level security on the dashboards and visualizations based on the logged-in user
Meet compliance and audit requirements of the organization
Maintain the current state of all customer specific QuickSight resources
The solution integrates an AWS CDK based pipeline to deploy QuickSight Assets that:
Supports Infrastructure-as-a-code for QuickSight Asset Deployment and enables rollbacks if required.
Enables separation of development, staging and production environments using QuickSight folders that reduces the burden of multi-account management of QuickSight resources.
Enables a hub-and-spoke model for Data Access in multiple AWS accounts in a data mesh fashion.
The QuickSight Asset Tracker was built as an independent service, which was deployed in a shared AWS service account that integrated Amazon Aurora Serverless PostgreSQL to store metadata information, AWS Lambda as the serverless compute and Amazon API Gateway to provide the REST API layer.
It also integrated AWS CDK and AWS CloudFormation to deploy the product and customer specific QuickSight resources and keep them in consistent and stable state. The metadata of QuickSight resources, created using either AWS console or the AWS CDK based deployment were maintained in Amazon Aurora database through the QuickSight Asset Tracker REST API service.
The CDK based deployment pipeline is triggered via a CI/CD pipeline which performs the following functions:
Takes the ARN of the QuickSight assets (dataset, analysis, etc.)
Describes the asset and dependent resources (if selected)
Creates a copy of the resource in another environment (in this case a QuickSight folder) using CDK
The solution architecture integrated the following AWS services.
Amazon Aurora Serverless integrated as the backend database to store metadata information of all QuickSight resources with customer and product information they are related to.
Amazon QuickSight as the BI service using which visualization and dashboards can be created and embedded into the online applications.
AWS Lambda as the serverless compute service that gets invoked by online applications using Amazon API Gateway service.
Amazon SQS to store customer request messages, so that the AWS CDK based pipeline can read from it for processing.
AWS CodeCommit is integrated to store the AWS CDK deployment scripts and AWS CodeBuild, AWS CloudFormation integrated to deploy the AWS resources using an infrastructure as a code approach.
AWS CloudTrail is integrated to audit user actions and trigger Amazon EventBridge rules when a QuickSight resource is created, updated or deleted, so that the QuickSight Asset Tracker is up-to-date.
Amazon S3 integrated to store metadata information, which is used by AWS CDK based pipeline to deploy the QuickSight resources.
AWS LakeFormation enables cross-account data access in support of the QuickSight Data Mesh
The following provides a high-level view of the solution architecture.
Architecture Walkthrough:
The following provides a detailed walkthrough of the above architecture.
QuickSight Dataset, Template, Analysis, Dashboard and visualization relationships:
Steps 1 to 2 represent QuickSight reference analysis reading data from different data sources that may include Amazon S3, Amazon Athena, Amazon Redshift, Amazon Aurora or any other JDBC based sources.
Step 3 represents QuickSight templates being created from reference analysis when a customer specific visualization needs to be created and step 4.1 to 4.2 represents customer analysis and dashboards being created from the templates.
Steps 7 to 8 represent QuickSight visualizations getting generated from analysis/dashboard and step 6 represents the customer analysis/dashboard/visualizations referring their own customer datasets.
Step 10 represents a new fork being created from the base reference analysis for a specific customer, which will create a new QuickSight template and reference analysis for that customer.
Step 9 represents end users accessing QuickSight visualizations.
Asset Tracker REST API service:
Step 15.2 to 15.4 represents the Asset Tracker service, which is deployed in a shared AWS service account, where Amazon API Gateway provides the REST API layer, which invokes AWS Lambda function to read from or write to backend Aurora database (Aurora Serverless v2 – PostgreSQL engine). The database captures all relationship metadata between QuickSight resources, its owners, assigned customers and products.
Online application – QuickSight asset discovery and creation
Step 15.1 represents the front-end online application reading QuickSight metadata information from the Asset Tracker service to help customers or end users discover visualizations available and be able to dynamically render based on the user login.
Step 11 to 12 represents the online application requesting creation of new QuickSight resources, which pushes requests to Amazon SQS and then AWS Lambda triggers AWS CodeBuild to deploy new QuickSight resources. Step 13.1 and 13.2 represents the CDK based pipeline maintaining the QuickSight resources to keep them in a consistent state. Finally, the AWS CDK stack invokes the Asset Tracker service to update its metadata as represented in step 13.3.
Tracking QuickSight resources created outside of the AWS CDK Stack
Step 14.1 represents users creating QuickSight resources using the AWS Console and step 14.2 represents that activity getting logged into AWS CloudTrail.
Step 14.3 to 14.5 represents triggering EventBridge rule for CloudTrail activities that represents QuickSight resource being created, updated or deleted and then invoke the Asset Tracker REST API to register the QuickSight resource metadata.
Architecture Decisions:
The following are few architecture decisions we took while designing the solution.
Choosing Aurora database for Asset Tracker: We have evaluated Amazon Neptune for the Asset Tracker database as most of the metadata information we capture are primarily maintaining relationship between QuickSight resources. But when we looked at the query patterns, we found the query pattern is always just one level deep to find who is the parent of a specific QuickSight resource and that can be solved with a relational database’s Primary Key / Foreign Key relationship and with simple self-join SQL query. Knowing the query pattern does not require a graph database, we decided to go with Amazon Aurora to keep it simple, so that we can avoid introducing a new database technology and can reduce operational overhead of maintaining it. In future as the use case evolve, we can evaluate the need for a Graph database and plan for integrating it. For Amazon Aurora, we choose Amazon Aurora Serverless as the usage pattern is not consistent to reserve a server capacity and the serverless tech stack will help reduce operational overhead.
Decoupling Asset Tracker as a common REST API service: The Asset Tracker has future scope to be a centralized metadata layer to keep track of all the QuickSight resources across all business units of Huron. So instead of each business unit having its own metadata database, if we build it as a service and deploy it in a shared AWS service account, then we will get benefit from reduced operational overhead, duplicate infrastructure cost and will be able to get a consolidated view of all assets and their integrations. The service provides the ability of applications to consume metadata about the QuickSight assets and then apply their own mapping of security policies to the assets based on their own application data and access control policies.
Central QuickSight account with subfolder for environments: The choice was made to use a central account which reduces developer friction of having multiple accounts with multiple identities, end users having to manage multiple accounts and access to resources. QuickSight folders allow for appropriate permissions for separating “environments”. Furthermore, by using folder-based sharing with QuickSight groups, users with appropriate permissions already have access to the latest versions of QuickSight assets without having to share their individual identities.
The solution included an automated Continuous Integration (CI) and Continuous Deployment (CD) pipeline to deploy the resources from development to staging and then finally to production. The following provides a high-level view of the QuickSight CI/CD deployment strategy.
Aurora Database Tables and Reference Analysis update flow
The following are the database tables integrated to capture the QuickSight resource metadata.
QS_Dataset: This captures metadata of all QuickSight datasets that are integrated in the reference analysis or customer analysis. This includes AWS ARN (Amazon Resource Name), data source type, ID and more.
QS_Template: This table captures metadata of all QuickSight templates, from which customer analysis and dashboards will be created. This includes AWS ARN, parent reference analysis ID, name, version number and more.
QS_Folder: This table captures metadata about QuickSight folders which logically groups different visualizations. This includes AWS ARN, name, and description.
QS_Analysis: This table captures metadata of all QuickSight analysis that includes AWS ARN, name, type, dataset IDs, parent template ID, tags, permissions and more.
QS_Dashboard: This table captures metadata information of QuickSight dashboards that includes AWS ARN, parent template ID, name, dataset IDs, tags, permissions and more.
QS_Folder_Asset_Mapping: This table captures folder to QuickSight asset mapping that includes folder ID, Asset ID, and asset type.
As the solution moves to the next phase of implementation, we plan to introduce additional database tables to capture metadata information about QuickSight sheets and asset mapping to customers and products. We will extend the functionality to support visual based embedding to enable truly integrated customer data experiences where embedded visuals mesh with the native content on a web page.
While explaining the use case, we have highlighted it creates a challenge when a base reference analysis gets updated and we need to track the templates that are inherited from it make sure the change is pushed to the linked customer analysis and dashboards. The following example scenarios explains, how the database tables change when a reference analysis is updated.
Example Scenario: When “reference analysis” is updated with a new release
When a base reference analysis is updated because of a new feature release, then a new QuickSight reference analysis and template needs to be created. Then we need to update all customer analysis and dashboard records to point to the new template ID to form the lineage.
The following sequential steps represent the database changes that needs to happen.
Insert a new record to the “Analysis” table to represent the new reference analysis creation.
Insert a new record to the “Template” table with new reference analysis ID as parent, created in step 1.
Retrieve “Analysis” and “Dashboard” table records that points to previous template ID and then update those records with the new template ID, created in step 2.
How will it enable a more robust embedding experience
The QuickSight asset tracker integration with Huron’s products provide users with a personalized, secure and modern analytics experience. When user’s login through Huron’s online application, it will use logged in user’s information to dynamically identify the products they are mapped to and then render the QuickSight visualizations & dashboards that the user is entitled to see. This will improve user experience, enable granular permission management and will also increase performance.
How AWS collaborated with Huron to help build the solution
AWS team collaborated with Huron team to design and implement the solution. AWS Data Lab Resident Architect collaborated with Huron’s lead architect for initial architecture design that compared different options for integration and deriving tradeoffs between them, before finalizing the final architecture. Then with the help of AWS Professional service engineer, we could build the base solution that can be extended by Huron team to roll it out to all business units and integrate additional reporting features on top of it.
The AWS Data Lab Resident Architect program provides AWS customers with guidance in refining and executing their data strategy and solutions roadmap. Resident Architects are dedicated to customers for 6 months, with opportunities for extension, and help customers (Chief Data Officers, VPs of Data Architecture, and Builders) make informed choices and tradeoffs about accelerating their data and analytics workloads and implementation.
The AWS Professional Services organization is a global team of experts that can help customers realize their desired business outcomes when using the AWS Cloud. The Professional Services team work together with customer’s team and their chosen member of the AWS Partner Network (APN) to execute their enterprise cloud computing initiatives.
Next Steps
Huron has rolled out the solution for one business unit and as a next step we plan to roll it out to all business units, so that the asset tracker service is populated with assets available across all business units of the organization to provide consolidated view.
In addition, Huron will be building a reporting layer on top of the Amazon Aurora asset tracker database, so that the leadership has a way to discover assets by business unit, by owner, created between specific date range or the reports that are not updated since a while.
Once the asset tracker is populated with all QuickSight assets, it will be integrated into the front-end online application that can help end users discover existing assets and request creation of new assets.
Newer QuickSight API’s such as assets-as-a-bundle and assets-as-code further accelerate the capabilities of the service by improving the development velocity and reliability of making changes.
Conclusion
This blog explained how Huron built an Asset Tracker to keep track of all QuickSight resources across the organization. This solution may provide a reference to other organizations who would like to build an inventory of visualization reports, ML models or other technical assets. This solution leveraged Amazon Aurora as the primary database, but if an organization would also like to build a detailed lineage of all the assets to understand how they are interrelated then they can consider integrating Amazon Neptune as an alternate database too.
If you have a similar use case and would like to collaborate with AWS Data Analytics Specialist Architects to brainstorm on the architecture, rapidly prototype it and implement a production ready solution then connect with your AWS Account Manager or AWS Solution Architect to start an engagement with AWS Data Lab team.
About the Authors
Corey Johnson is the Lead Data Architect at Huron, where he leads its data architecture for their Global Products Data and Analytics initiatives.
Sakti Mishra is a Principal Data Analytics Architect at AWS, where he helps customers modernize their data architecture, help define end to end data strategy including data security, accessibility, governance, and more. He is also the author of the book Simplify Big Data Analytics with Amazon EMR. Outside of work, Sakti enjoys learning new technologies, watching movies, and visiting places with family.
For the permissions already in place, one of IAM Access Analyzer’s capabilities is that it helps you identify resources in your AWS Organizations organization and AWS accounts that are shared with an external entity.
For each external entity that has access to a resource in your account, IAM Access Analyzer generates a finding. Findings display information about the resource and the policy statement that generated the finding, with details such as the list of actions in the policy granting access, level of access, and conditions that allow the access. You can review the findings to determine if the access is intended or unintended.
As your use of AWS services grows and the number of accounts in your organization increases, the number of findings that you have might also increase. To help reduce noise and allow you to focus on unintended access findings, you can filter findings and create archive rules for intended access.
This blog post provides step-by-step guidance on how to get started with IAM Access Analyzer findings by using different filtering techniques that can help you filter approved use cases that result in access findings. For example, you might see a finding generated for an S3 bucket that hosts images for your website and thus allows public access, as approved by your organization, apply a filter so that you can concentrate on unintended access. IAM Access Analyzer offers a wide range of filters; for a complete list, see the IAM documentation.
In this post, we also share example archive rules for approved use cases that result in access findings. Archive rules automatically archive new findings that meet the criteria you define when you create the rule. You can also apply archive rules retroactively to archive existing findings that meet the archive rule criteria. Finally, we have included an example implementation of archive rules using an AWS CloudFormation template.
IAM Access Analyzer findings overview
To get started, create an analyzer for your entire organization or your account. The organization or account that you choose is known as the zone of trust for the analyzer. The zone of trust determines the type of access that IAM Access Analyzer considers to be trusted. IAM Access Analyzer continuously monitors to identify resource policies, access control lists, and other access controls that grant public or cross-account access from outside the zone of trust, and generates findings. For this blog post, we’ll demonstrate an organization as the zone of trust, showcasing findings from a large-scale, multi-account AWS deployment.
Prerequisites
This blog post assumes that you have the following in place:
IAM Access Analyzer is enabled in your organization or account in the AWS Regions where you operate. For more details on how to enable IAM Access Analyzer, see Enabling IAM Access Analyzer.
Access to the AWS Organizations management account or to a member account in the organization with delegated administrator access for creating and updating IAM Access Analyzer resources.
How to filter the findings
To start filtering your findings and create archive rules, you should complete the following steps:
Review public access findings
Filter by removing permissions errors
Filter for known identity providers
Filter cross-account access from trusted external accounts
We’ll walk you through each step.
1. Review public access findings
Some AWS resources allow public access on the resource by means of a resource-based policy—for example, an Amazon Simple Storage Service (Amazon S3) bucket policy that has the “Principal:*” permission added to its bucket policy. For resources such as Amazon Elastic Block Store (Amazon EBS) snapshots, you can share these by using a flag on the resource permission. IAM Access Analyzer looks for such sharing and reports it in the findings.
From the global report, you can generate a list of resources that allow public access by using the Public access: true query in the IAM console.
If the access is intended, you can archive the findings by creating an archive rule using the AWS Management Console, AWS CLI, or API. When you archive a security finding, IAM Access Analyzer removes it from the Active findings list and changes its status to Archived. For instructions on how to automatically archive expected findings, see How to automatically archive expected IAM Access Analyzer findings.
Example: Known S3 bucket that hosts public website images
If you have resources for which public access is expected, such as an S3 bucket that hosts images for your website, you can add an archive rule with Resource criteria equal to the bucket name, as shown in Figure 1.
Figure 1: Create IAM Access Analyzer archive rule using the console
Is the public access unintended?
If the finding results from policies that were misconfigured to allow unintended public access, you can constrain the access by using AWS global condition context keys or a specific IAM principal ARN. The findings show the account and resource that contain the policy.
For example, if the finding shows a misconfigured S3 bucket, the following policy shows how you can modify the S3 bucket policy to only allow IAM principals from your organization to access the bucket by using the PrincipalOrgID condition key. Replace <DOC-EXAMPLE-BUCKET> with the name of your S3 bucket, and <ORGANIZATION_ID> with your organization ID.
Before you further investigate the IAM Access Analyzer findings, you should make sure that IAM Access Analyzer has enough permissions to access the resources in your accounts to be able to provide the analysis.
IAM Access Analyzer uses an AWS service-linked role to call other AWS services on your behalf. When IAM Access Analyzer analyzes a resource, it reads resource metadata, such as a resource-based policy, access control lists, and other access controls that grant public or cross-account access. If the policies don’t allow an IAM Access Analyzer role to read the resource metadata, it generates an Access Denied error finding, as shown in Figure 2.
Figure 2: IAM Access Analyzer access denied error example
To view these error findings from the IAM Access Analyzer console, filter the findings by using the Error: Access Denied property.
Resolution
To resolve the access issue, make sure that the IAM Access Analyzer service-linked role is not denied access. Review the resource-based policy attached to the resource that IAM Access Analyzer isn’t able to access. For a list of services that support resource-based policies, see the IAM documentation.
For example, if the analyzer can’t access an AWS Key Management Service (AWS KMS) key because of an explicit deny, add an exception for the IAM Access Analyzer service-linked role to the policy statement, similar to the following. Make sure that you change the <ACCOUNT_ID> to your account id.
With SAML 2.0 or Open ID Connect (OIDC)—which are open federation standards that many identity providers (IdPs) use—users can log in to the console or call the AWS API operations without you having to create an IAM user for everyone in your organization.
To set up federation, you must perform a one-time configuration so that your organization’s IdP and your account trust each other. To configure this trust, you must register AWS as a service provider (SP) with the IdP of your organization and set up metadata and key exchange.
The role or roles that you create in IAM define what the federated users from your organization are allowed to use on AWS. When you create the trust policy for the role, you specify the SAML or OIDC provider as the Principal. To only allow users that match certain attributes to access the role, you can scope the trust policy with a Condition.
Example 1: Federation with Okta
Let’s walk through an example that uses Okta as the IdP. Although access to a trusted IdP is intended, IAM Access Analyzer creates a finding for an IAM role that has trust policy granting access to a SAML provider because the trust policy allows access outside of the known zone of trust for the analyzer. You will see findings created for the IAM role granting access to Okta using the IAM trust policy, as shown in Figure 3.
Figure 3: IAM Access Analyzer identity provider finding example
Resolution
Setting access through SAML providers is a privileged operation, so we recommend that you analyze each finding to decide if an exception is acceptable. If you approve of the SAML-provided access setup, you can implement an archive rule to archive such findings with conditions for federation used in combination with your SAML provider. The filter for the Federated User rule depends on the name that you gave to the SAML IdP in your federation setup. For example, if your SAML IdP name is Okta, the rule should have a filter for arn:aws:iam::<ACCOUNT_ID>:saml-provider/Okta, where <ACCOUNT_ID> is your account number, as shown in Figure 4.
Figure 4: Archive rule example for using an IdP-related finding
Note: To include additional values for a multi-account setup, use the Add another value filter.
Example 2: IAM Identity Center
With AWS IAM Identity Center (successor to AWS Single Sign-On), you can manage sign-in security for your workforce. IAM Identity Center provides a central place to define your permission sets, assign them to your users and groups, and give your users a portal where they can access their assigned accounts.
With IAM Identity Center, you manage access to accounts by creating and assigning permission sets. These are IAM role templates that define (among other things) which policies to include in a role. When you create a permission set in IAM Identity Center and associate it to an account, IAM Identity Center creates a role in that account with a trust policy that allows a federated IdP as a principal — in this case, IAM Identity Center.
IAM Access Analyzer generates a finding for this setup because the allowed access is outside of the known zone of trust for the analyzer, as shown in Figure 5.
Figure 5: IAM Access Analyzer finding example for IAM Identity Center
To filter this finding, you need to implement an archive rule.
Resolution
You can implement an archive rule with conditions for federation used in combination with IAM Identity Center as the SAML provider. The roles created by IAM Identity Center in member accounts use a reserved path on AWS: arn:aws:iam::<ACCOUNT_ID>:role/aws-reserved/sso.amazonaws.com/. Hence, you can create an archive rule with a filter that contains :saml-provider/AWSSSO in the Federated User name and aws-reserved/sso.amazonaws.com/ in the Resource, as shown in Figure 6.
Figure 6: Archive rule example for IAM Identity Center generated findings
4. Filter cross-account access findings from trusted external accounts
We recommend that you identify and document accounts and principals that should be allowed access outside of the zone of trust for IAM Access Analyzer.
When a resource-based policy attached to a resource allows cross-account access from outside the zone of trust, IAM Access Analyzer generates cross-account access findings.
Is the cross-account access intended?
When you review cross-account access findings, you need to determine whether the access is intended or not. For example, you might have access provided to your auditor’s account or a partner account for visibility and monitoring of your AWS applications.
For trusted external accounts, you can create an archive rule that includes the AWS account in the criteria for the rule. Figure 7 shows an example of how to create the archive rule for a trusted external account (EXTERNAL_ACCOUNT_ID). In your own rule, replace EXTERNAL_ACCOUNT_ID with the trusted account id.
Figure 7: Archive rule example for trusted account findings
Is the cross-account access unintended?
After you have archived the intended access findings, you can start analyzing the findings initiated from unintended access. When you confirm that the findings show unintended access, you should take steps to remove the access by altering or deleting the policy or access control that granted access. You can expand the solution outlined in the blog post Automate resolution for IAM Access Analyzer cross-account access findings on IAM roles by adding an explicit deny statement.
You can also use AWS CloudTrail to track API calls that could have changed access configuration on your AWS resources.
Deploy IAM Access Analyzer and archive rules with a CloudFormation template
In this section, we demonstrate a sample CloudFormation template that creates an IAM access analyzer and archive rules for findings that are created for identified intended access to resources.
Important: When you create an archive rule using the AWS console, the existing findings and new findings that match criteria mentioned in the rules will be archived. However, archive rules created through CloudFormation or the AWS CLI will only archive the new findings that meet the criteria defined. You need to perform the access-analyzer:ApplyArchiveRule API after you create the archive rule to archive existing findings as well.
The sample CloudFormation template takes the following values as inputs and creates archive rules for findings that are created for identified intended access to resources shared outside of your zone of trust for the specified analyzer:
Analyzer name
Zone of trust
Known public S3 buckets, if you have any (for example, a bucket that hosts public website images).
Note: We use S3 buckets as an example. You can edit the rule to include resource types that are supported by IAM Access Analyzer, if public access is intended.
Trusted accounts — AWS accounts that don’t belong to your organization, but you trust them to have access to resources in your organization
SAML provider — The SAML provider approved to have access to your resources
Note: If you don’t use federation, you can remove the rule SAMLFederatedUsers.
AWSTemplateFormatVersion: 2010-09-09
Description: >+
  Sample CloudFormation template creates archive rules for findings
  created for resources shared outside of your zone of trust for specified
  analyzer.

Metadata:
  AWS::CloudFormation::Interface:
    ParameterGroups:
      - Label:
          default: Define Configuration
        Parameters:
          - AccessAnalyzerName
          - ZoneOfTrust
          - KnownPublicS3Buckets
          - TrustedAccounts
          - SAMLProvider
Parameters:
  AccessAnalyzerName:
    Description: Provide name of the analyzer you would like to create archive rules for.
    Type: String
  ZoneOfTrust:
    Description: Select the zone of trust of AccessAnalyzer
    AllowedValues:
      - ACCOUNT
      - ORGANIZATION
    Type: String
  KnownPublicS3Buckets:
    Description: List of comma-separated known S3 bucket arns, that should allow
      public access Example -
      arn:aws:s3:::DOC-EXAMPLE-BUCKET,arn:aws:s3:::DOC-EXAMPLE-BUCKET2
    Type: CommaDelimitedList
  TrustedAccounts:
    Description: List of comma-separated account IDs, that do not belong to your
      organization but you trust them to have access to resources in your
      organization. [Example - Your auditor’s AWS account]
    Type: List<Number>
  TrustedFederationPrincipals:
    Description: List of comma-separated trusted federated principals that are able
      to assume roles in your accounts. [Example -
      arn:aws:iam::012345678901:saml-provider/Okta,
      arn:aws:iam::1111222233334444:saml-provider/Okta]
    Type: CommaDelimitedList
Resources:
  AccessAnalyzer:
    Type: AWS::AccessAnalyzer::Analyzer
    Properties:
      AnalyzerName: ${AccessAnalyzerName}-${AWS::Region}
      Type: ZoneOfTrust
      ArchiveRules:
        - RuleName: ArchivePublicS3BucketsAccess
          Filter:
            - Property: resource
              Eq: KnownPublicS3Buckets
        - RuleName: AccountAccessNecessaryForBusinessProcesses
          Filter:
            - Property: principal.AWS
              Eq: TrustedAccounts
            - Property: isPublic
              Eq:
                - "false"
        - RuleName: SAMLFederatedUsers
          Filter:
            - Property: principal.Federated
              Eq: TrustedFederationPrincipals
To download this sample template, download the file IAMAccessAnalyzer.yaml from Amazon S3.
Conclusion
In this blog post, you learned how to start with IAM Access Analyzer findings, filter them based on the level of access given outside of your zone of trust, and create archive rules for intended access findings. By using different filtering techniques to remediate intended access findings, you can concentrate on unintended access.
If you have feedback about this post, submit comments in the Comments section below. If you have questions about this post, contact AWS Support.
Want more AWS Security news? Follow us on Twitter.
The collective thoughts of the interwebz
Manage Consent
To provide the best experiences, we use technologies like cookies to store and/or access device information. Consenting to these technologies will allow us to process data such as browsing behavior or unique IDs on this site. Not consenting or withdrawing consent, may adversely affect certain features and functions.
Functional
Always active
The technical storage or access is strictly necessary for the legitimate purpose of enabling the use of a specific service explicitly requested by the subscriber or user, or for the sole purpose of carrying out the transmission of a communication over an electronic communications network.
Preferences
The technical storage or access is necessary for the legitimate purpose of storing preferences that are not requested by the subscriber or user.
Statistics
The technical storage or access that is used exclusively for statistical purposes.The technical storage or access that is used exclusively for anonymous statistical purposes. Without a subpoena, voluntary compliance on the part of your Internet Service Provider, or additional records from a third party, information stored or retrieved for this purpose alone cannot usually be used to identify you.
Marketing
The technical storage or access is required to create user profiles to send advertising, or to track the user on a website or across several websites for similar marketing purposes.

 Build On Generative AI — Season 3 of your favorite weekly Twitch show about all things generative AI is in full swing! Streaming every Monday, 9:00 US PT, my colleagues Tiffany and Darko discuss different aspects of generative AI and invite guest speakers to demo their work. In today’s episode, guest Martyn Kilbryde showed how to build a JIRA Agent powered by Amazon Bedrock. Check out show notes and the full list of episodes on community.aws.
 AWS Summits — It’s AWS Summit season again! The first one is Paris (April 3), followed by Amsterdam (April 9), Sydney (April 10–11), London (April 24), Berlin (May 15–16), and Seoul (May 16–17). AWS Summits are a series of free online and in-person events that bring the cloud computing community together to connect, collaborate, and learn about AWS.
 AWS re:Inforce — Join us for AWS re:Inforce (June 10–12) in Philadelphia, PA. AWS re:Inforce is a learning conference focused on AWS security solutions, cloud security, compliance, and identity. Connect with the AWS teams that build the security tools and meet AWS customers to learn about their security journeys.


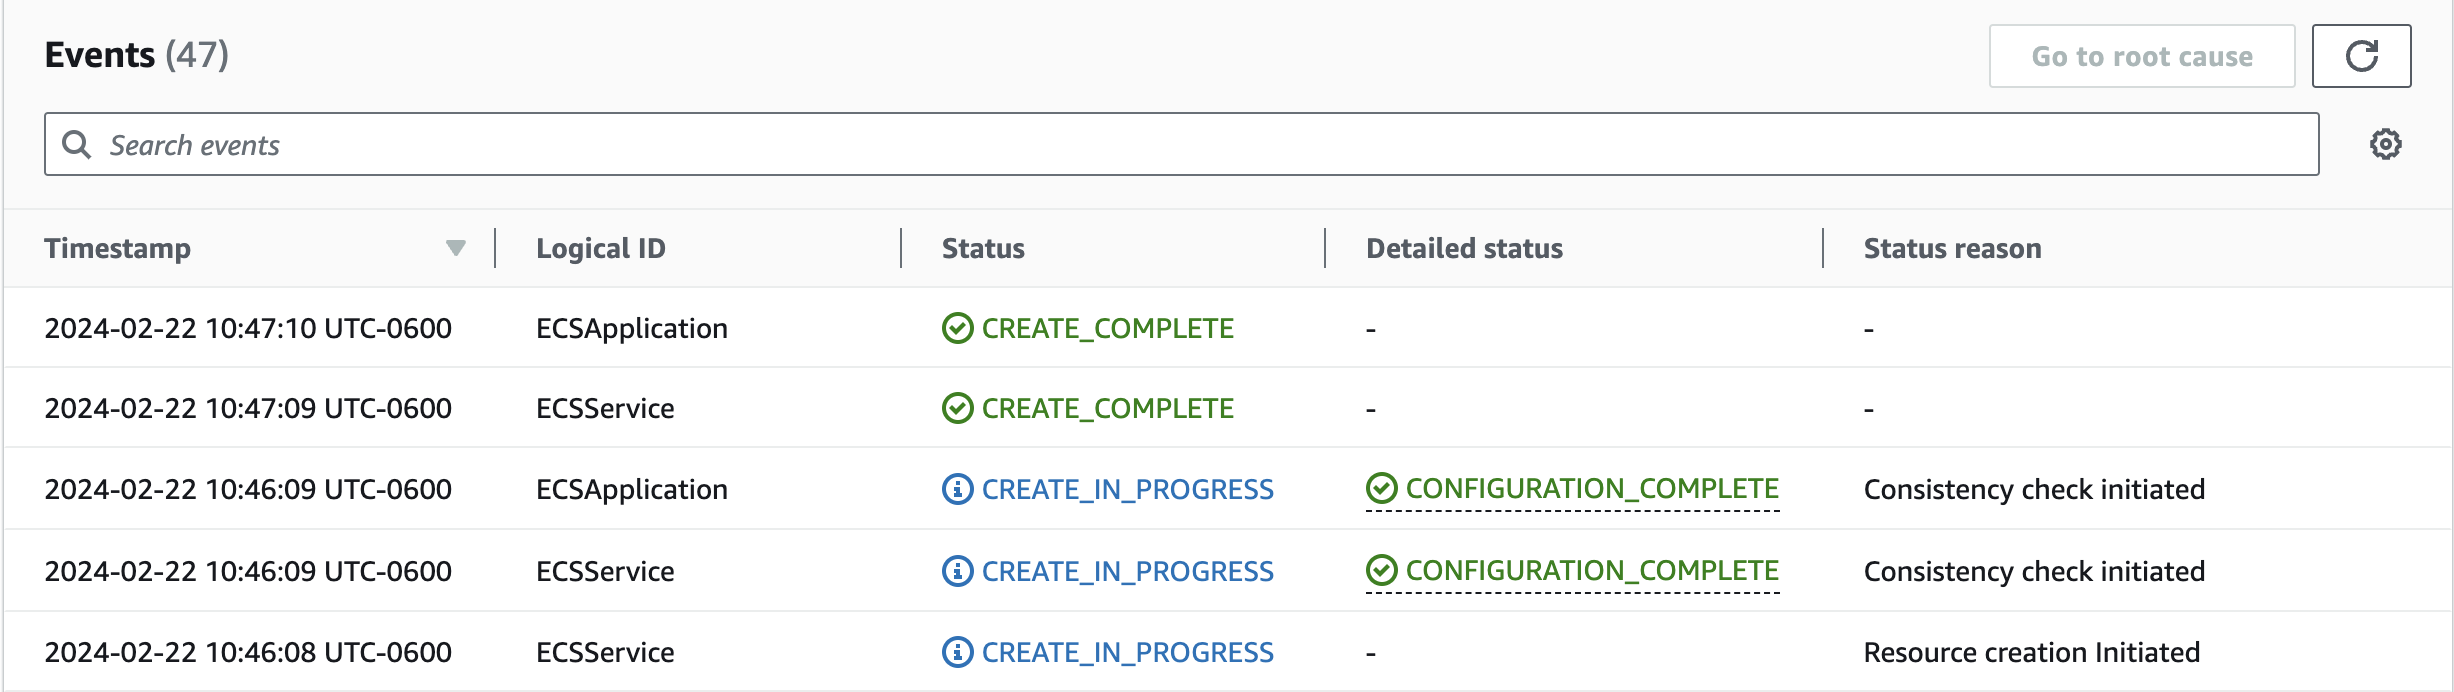

 Happy Lunar New Year! Wishing you a year filled with joy, success, and endless opportunities! May the Year of the Dragon bring uninterrupted connections and limitless growth


![A VPC selected in the scanned resources list]](https://d2908q01vomqb2.cloudfront.net/7719a1c782a1ba91c031a682a0a2f8658209adbf/2024/01/11/add-resources-to-template.png)


 Diagram 4: S3 Bucket creation success with hooks execution


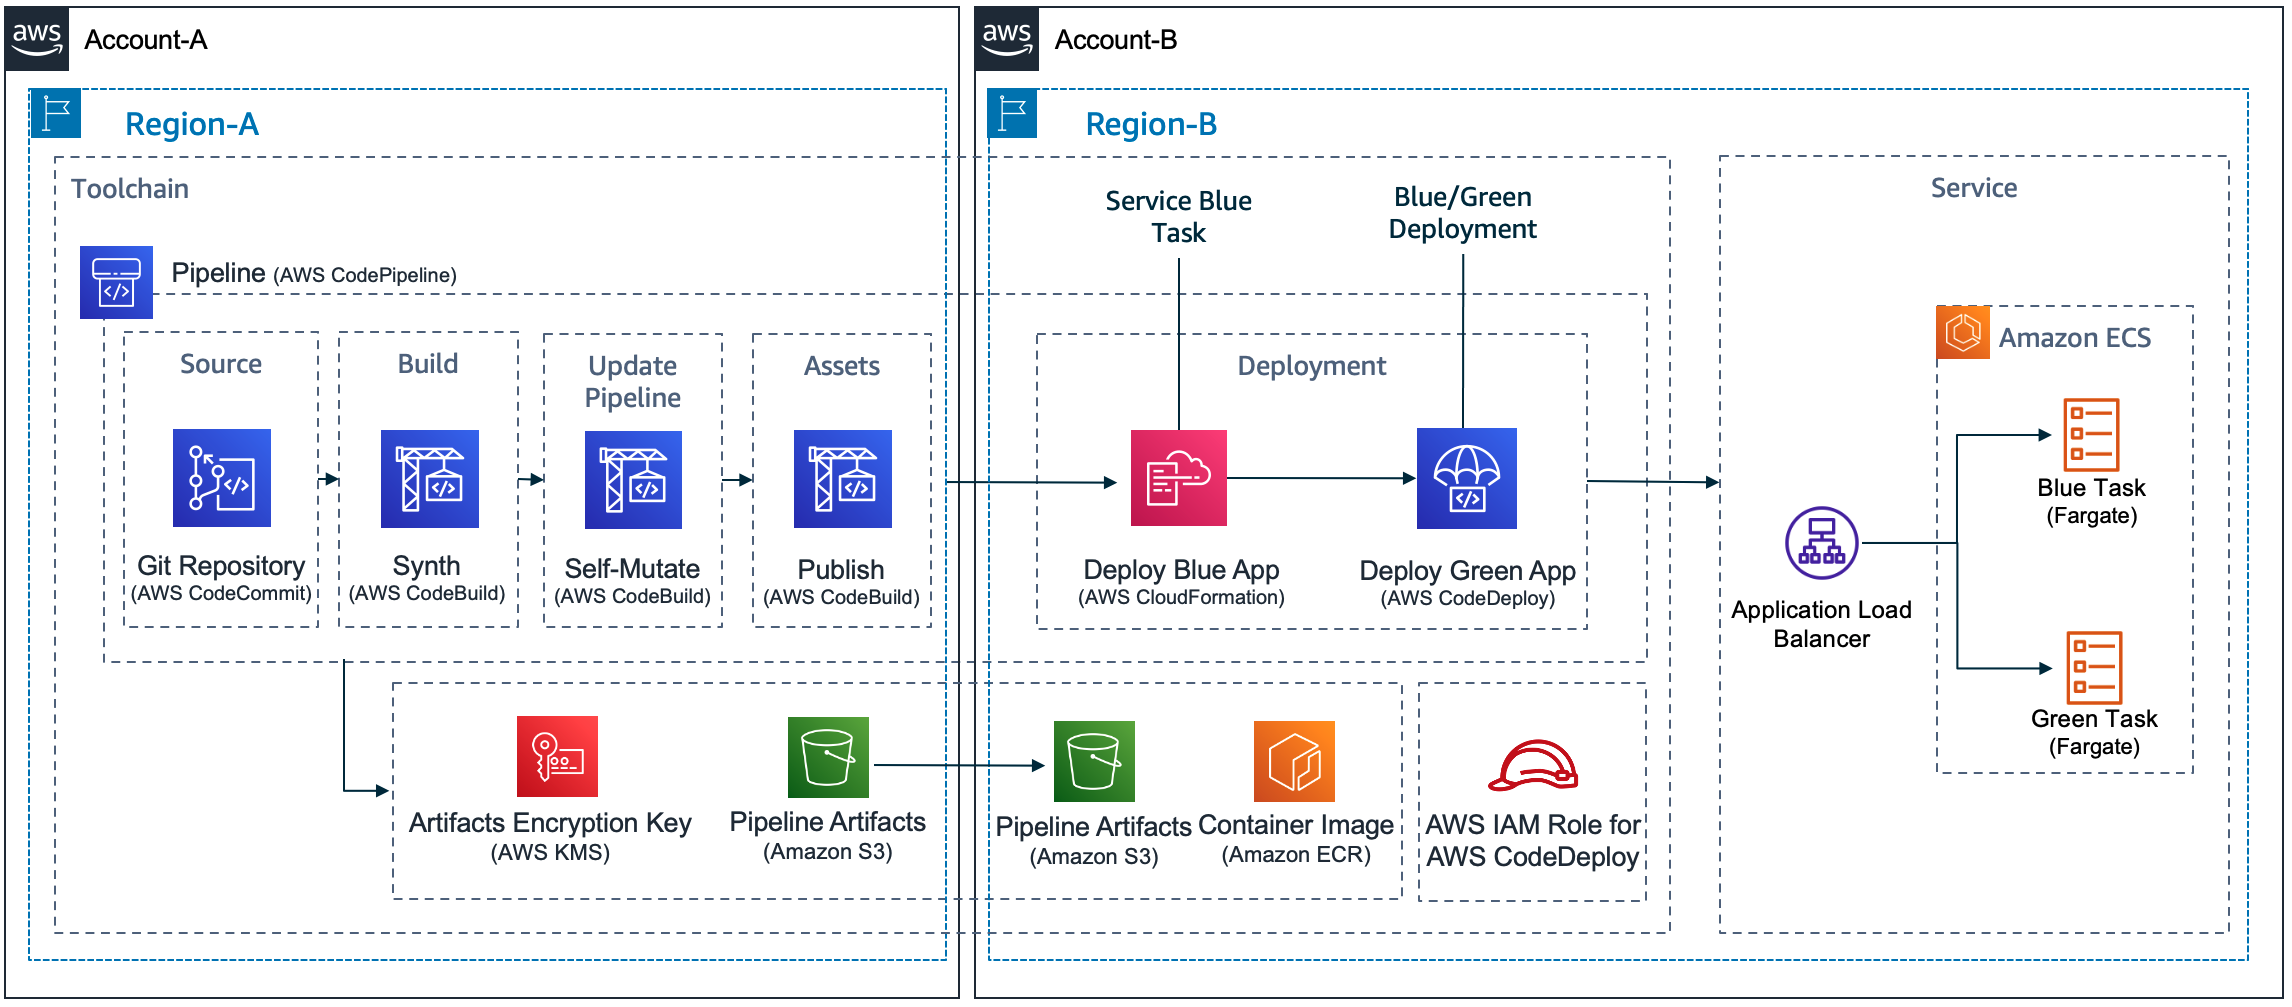
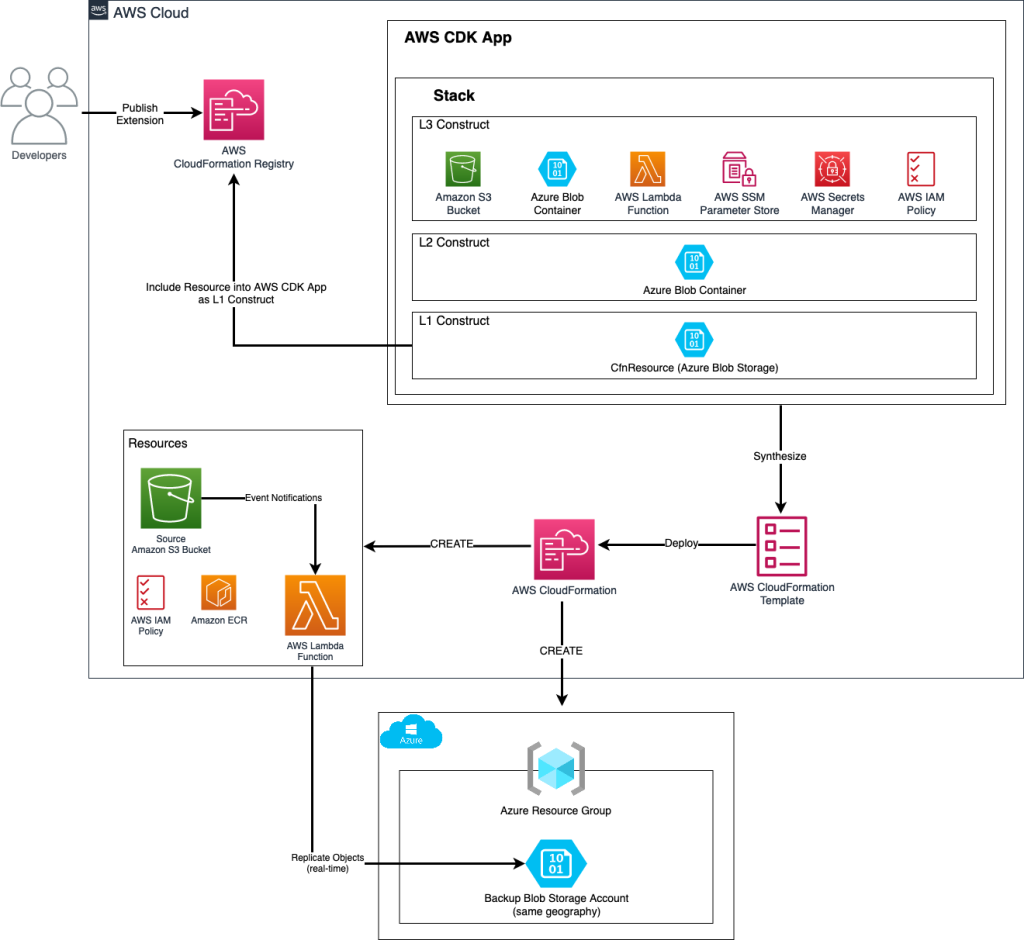
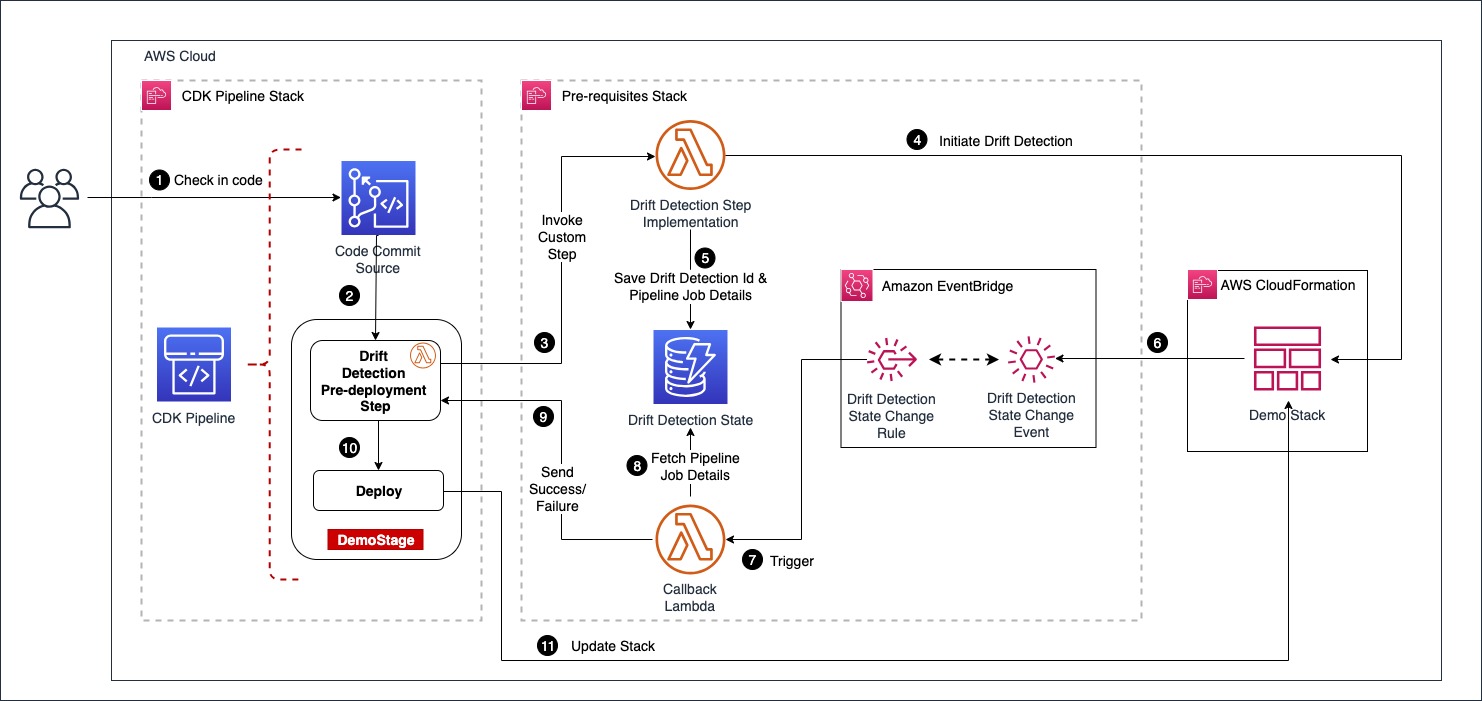


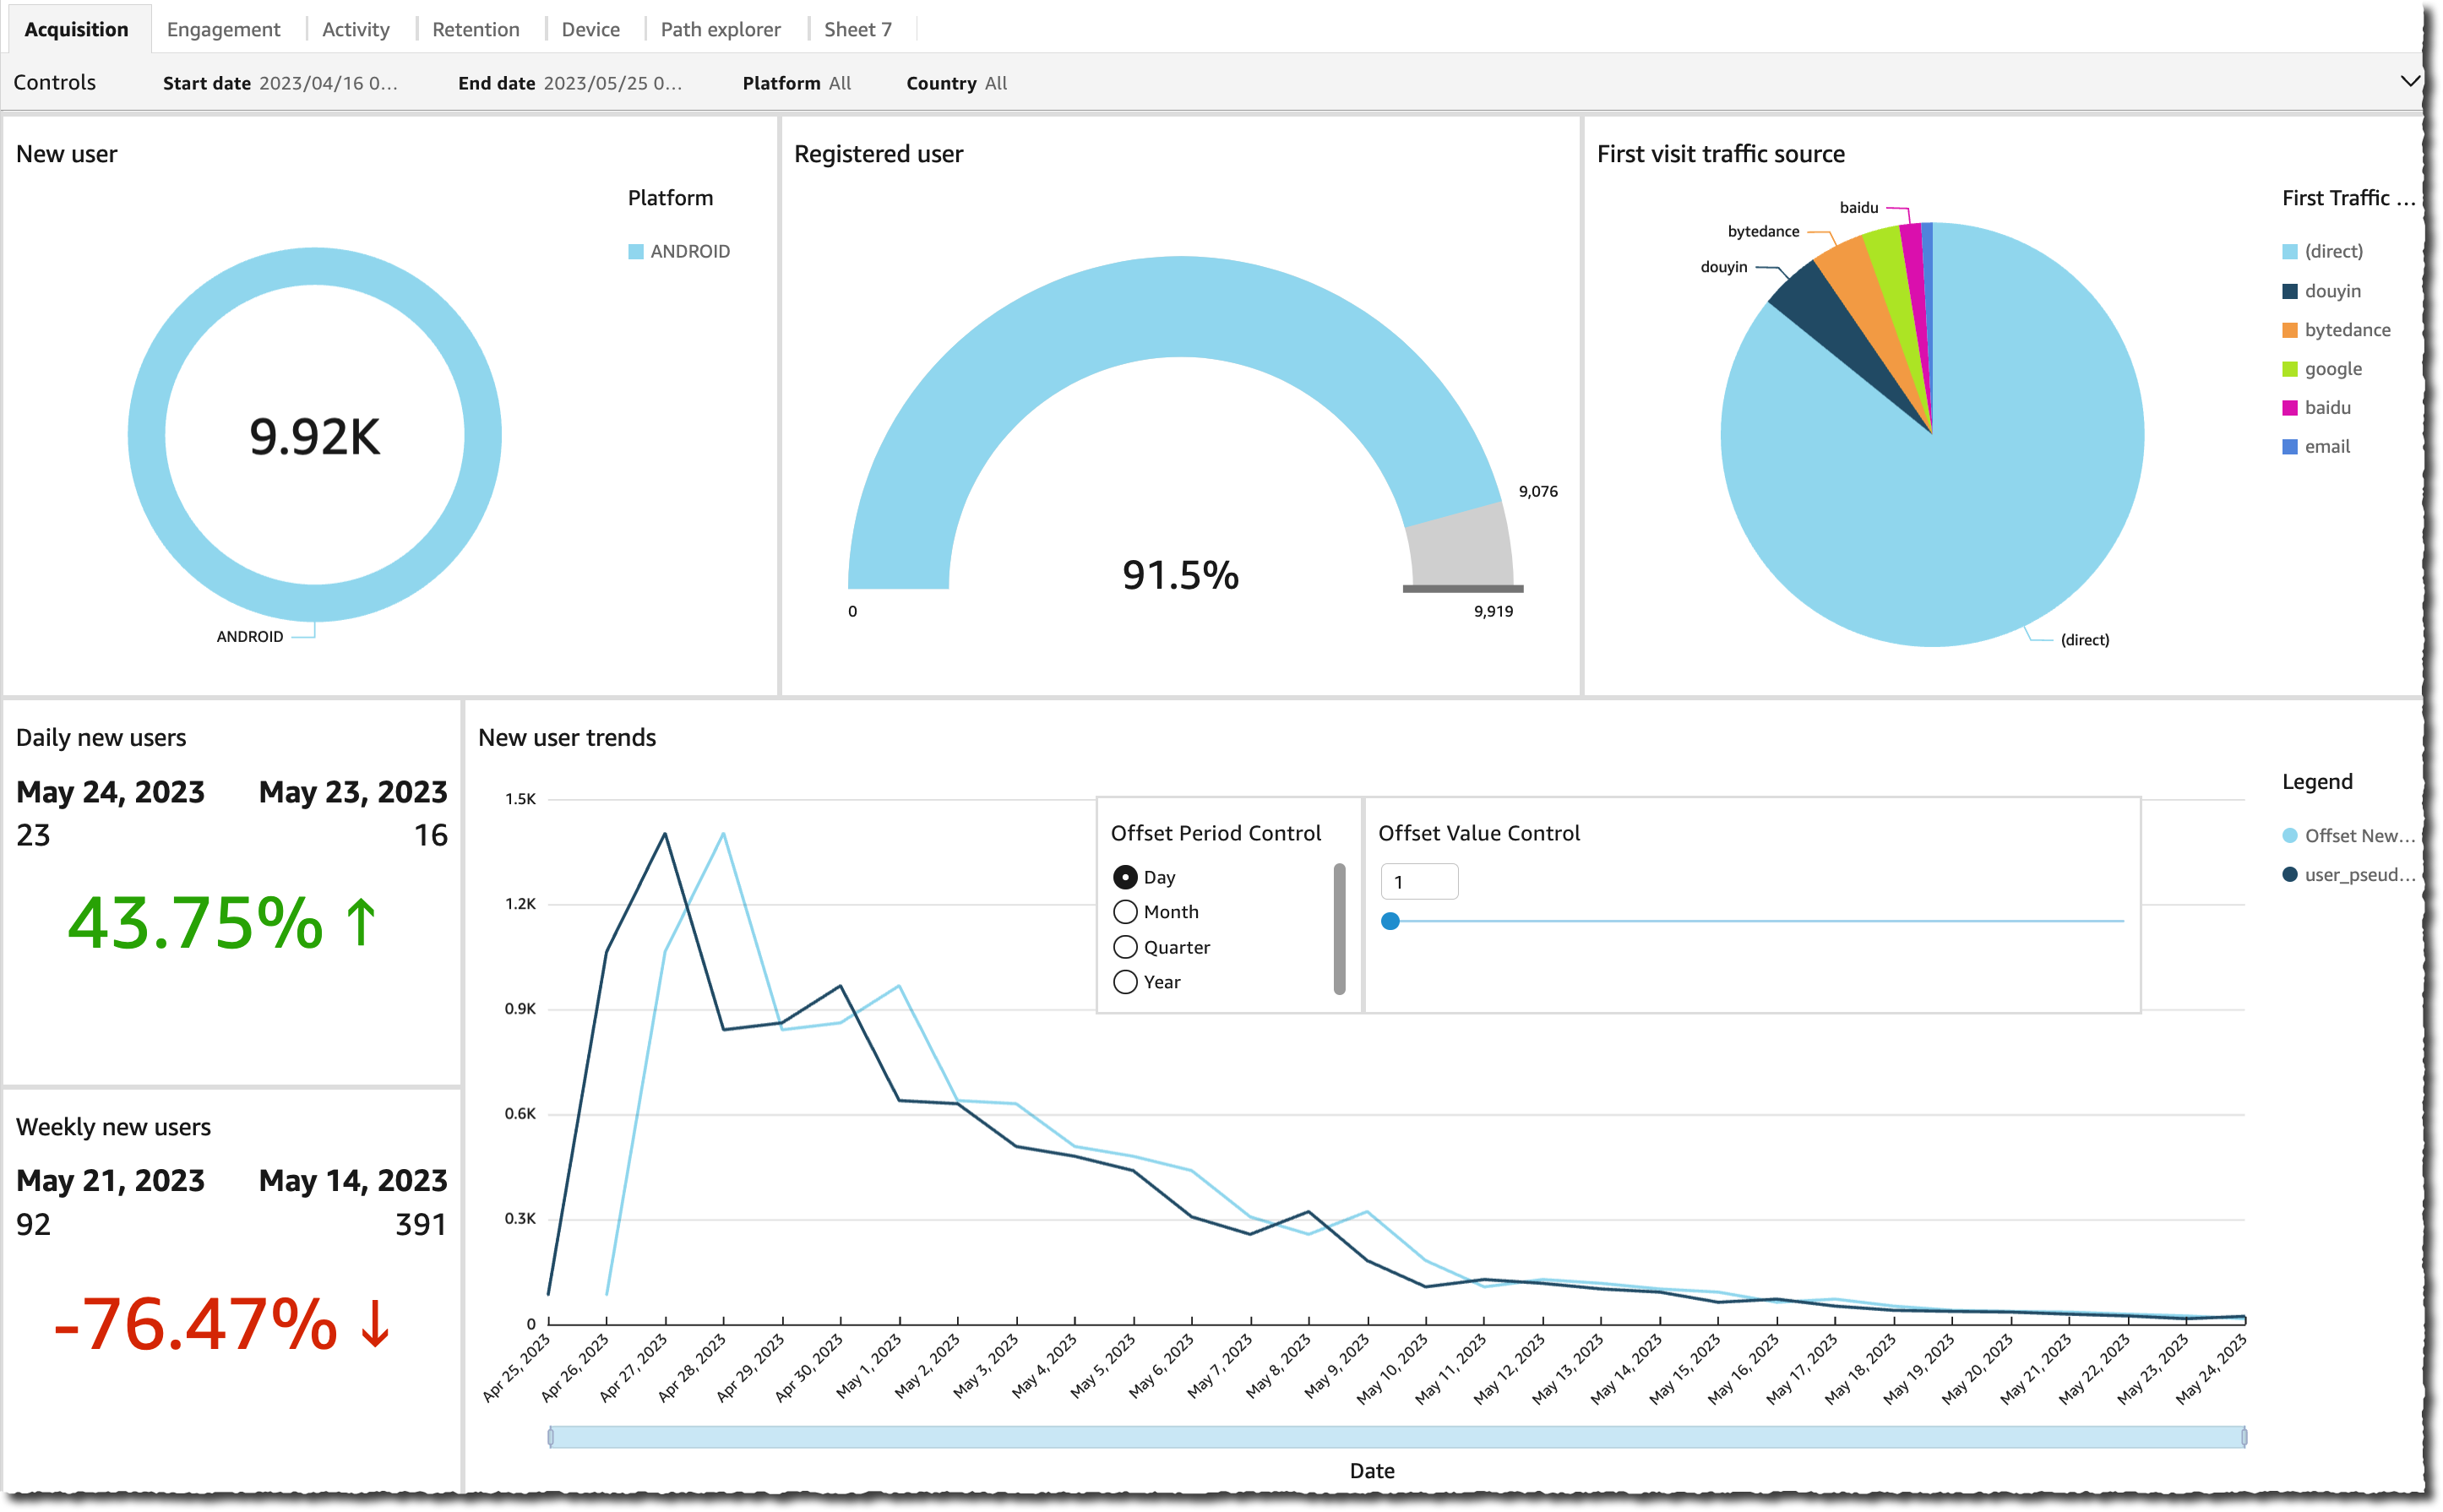


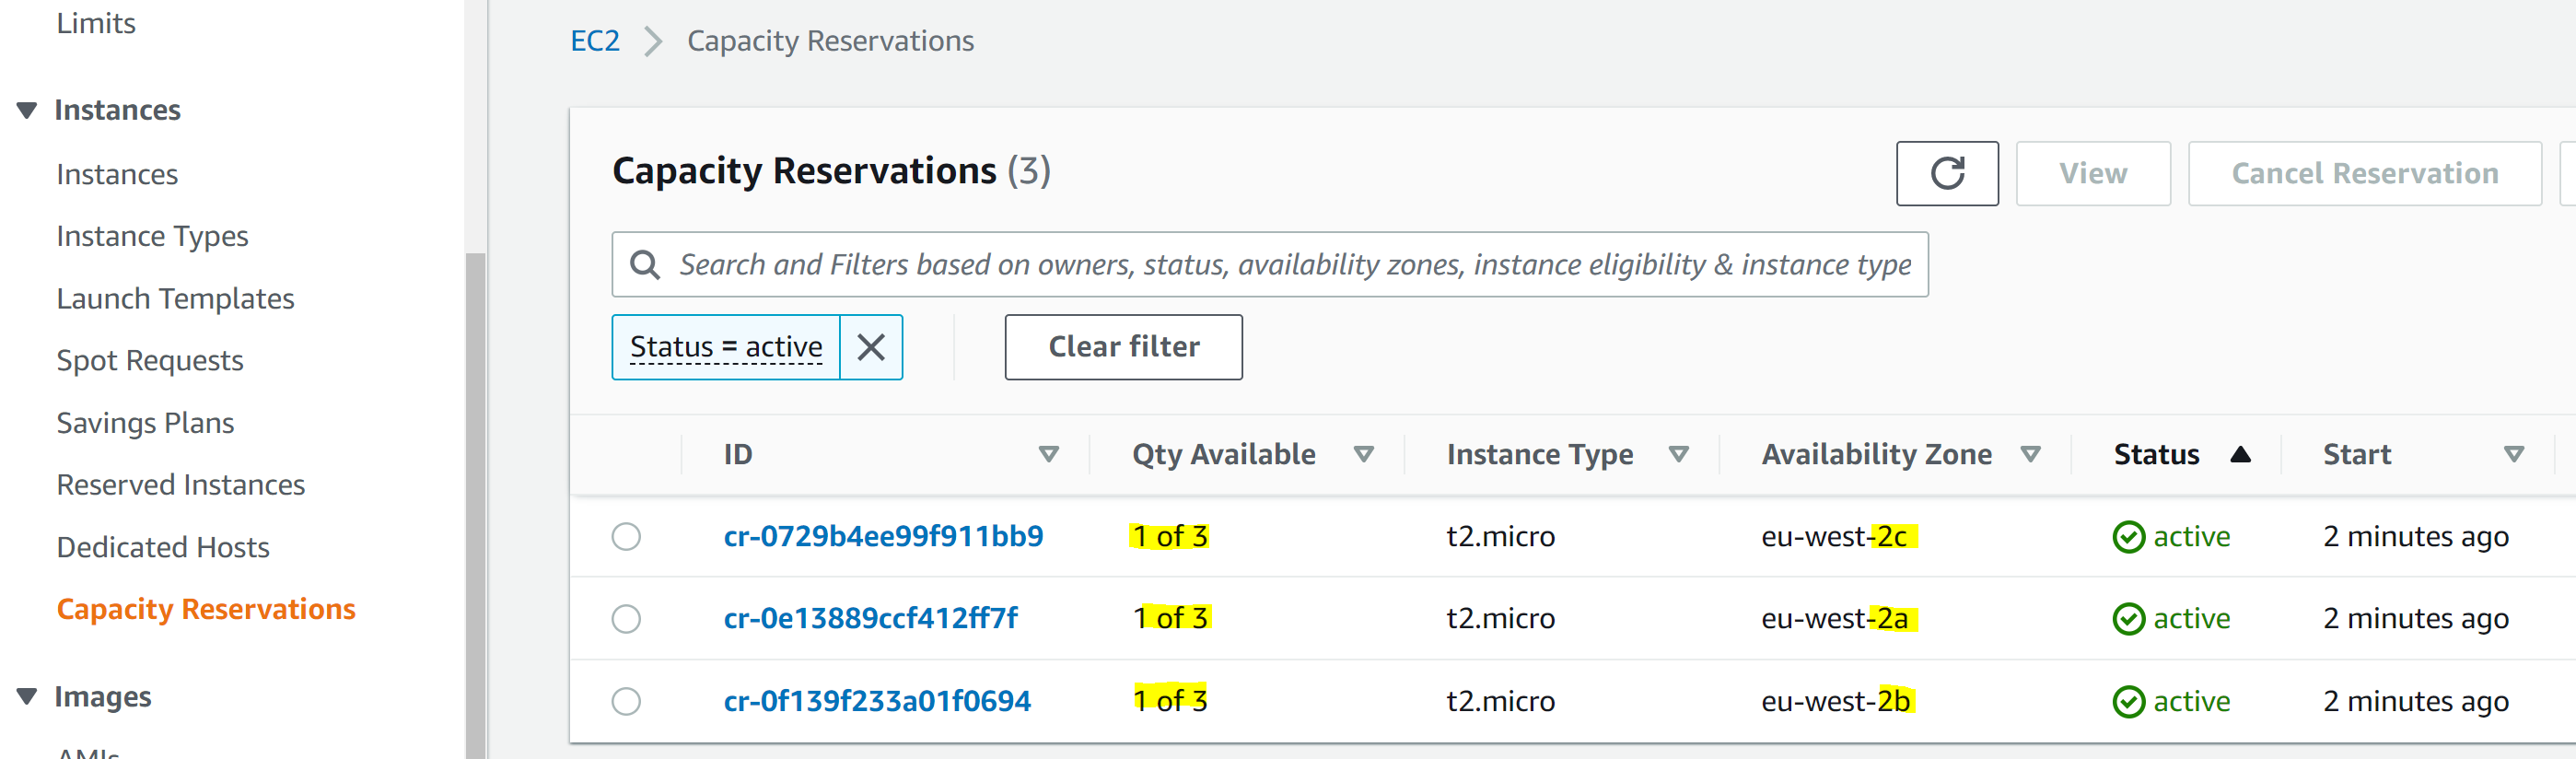

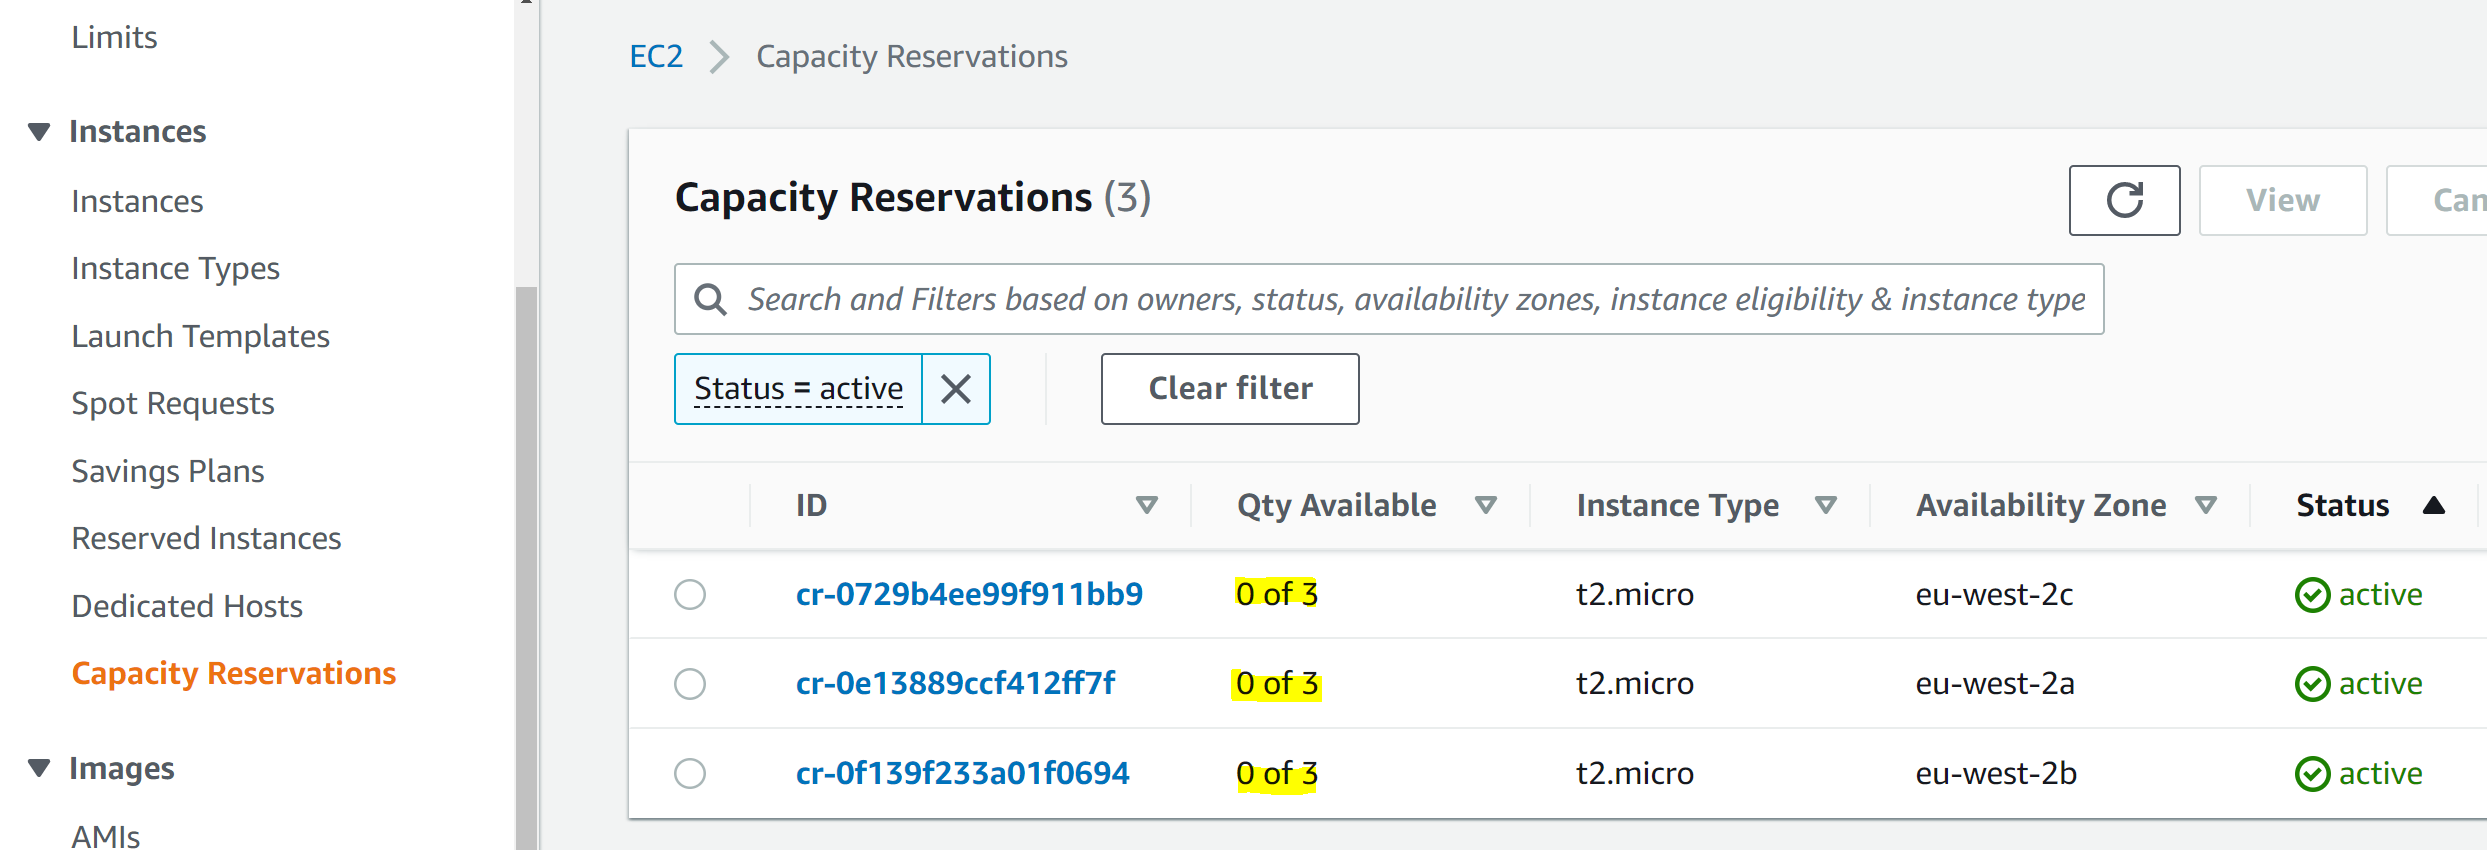


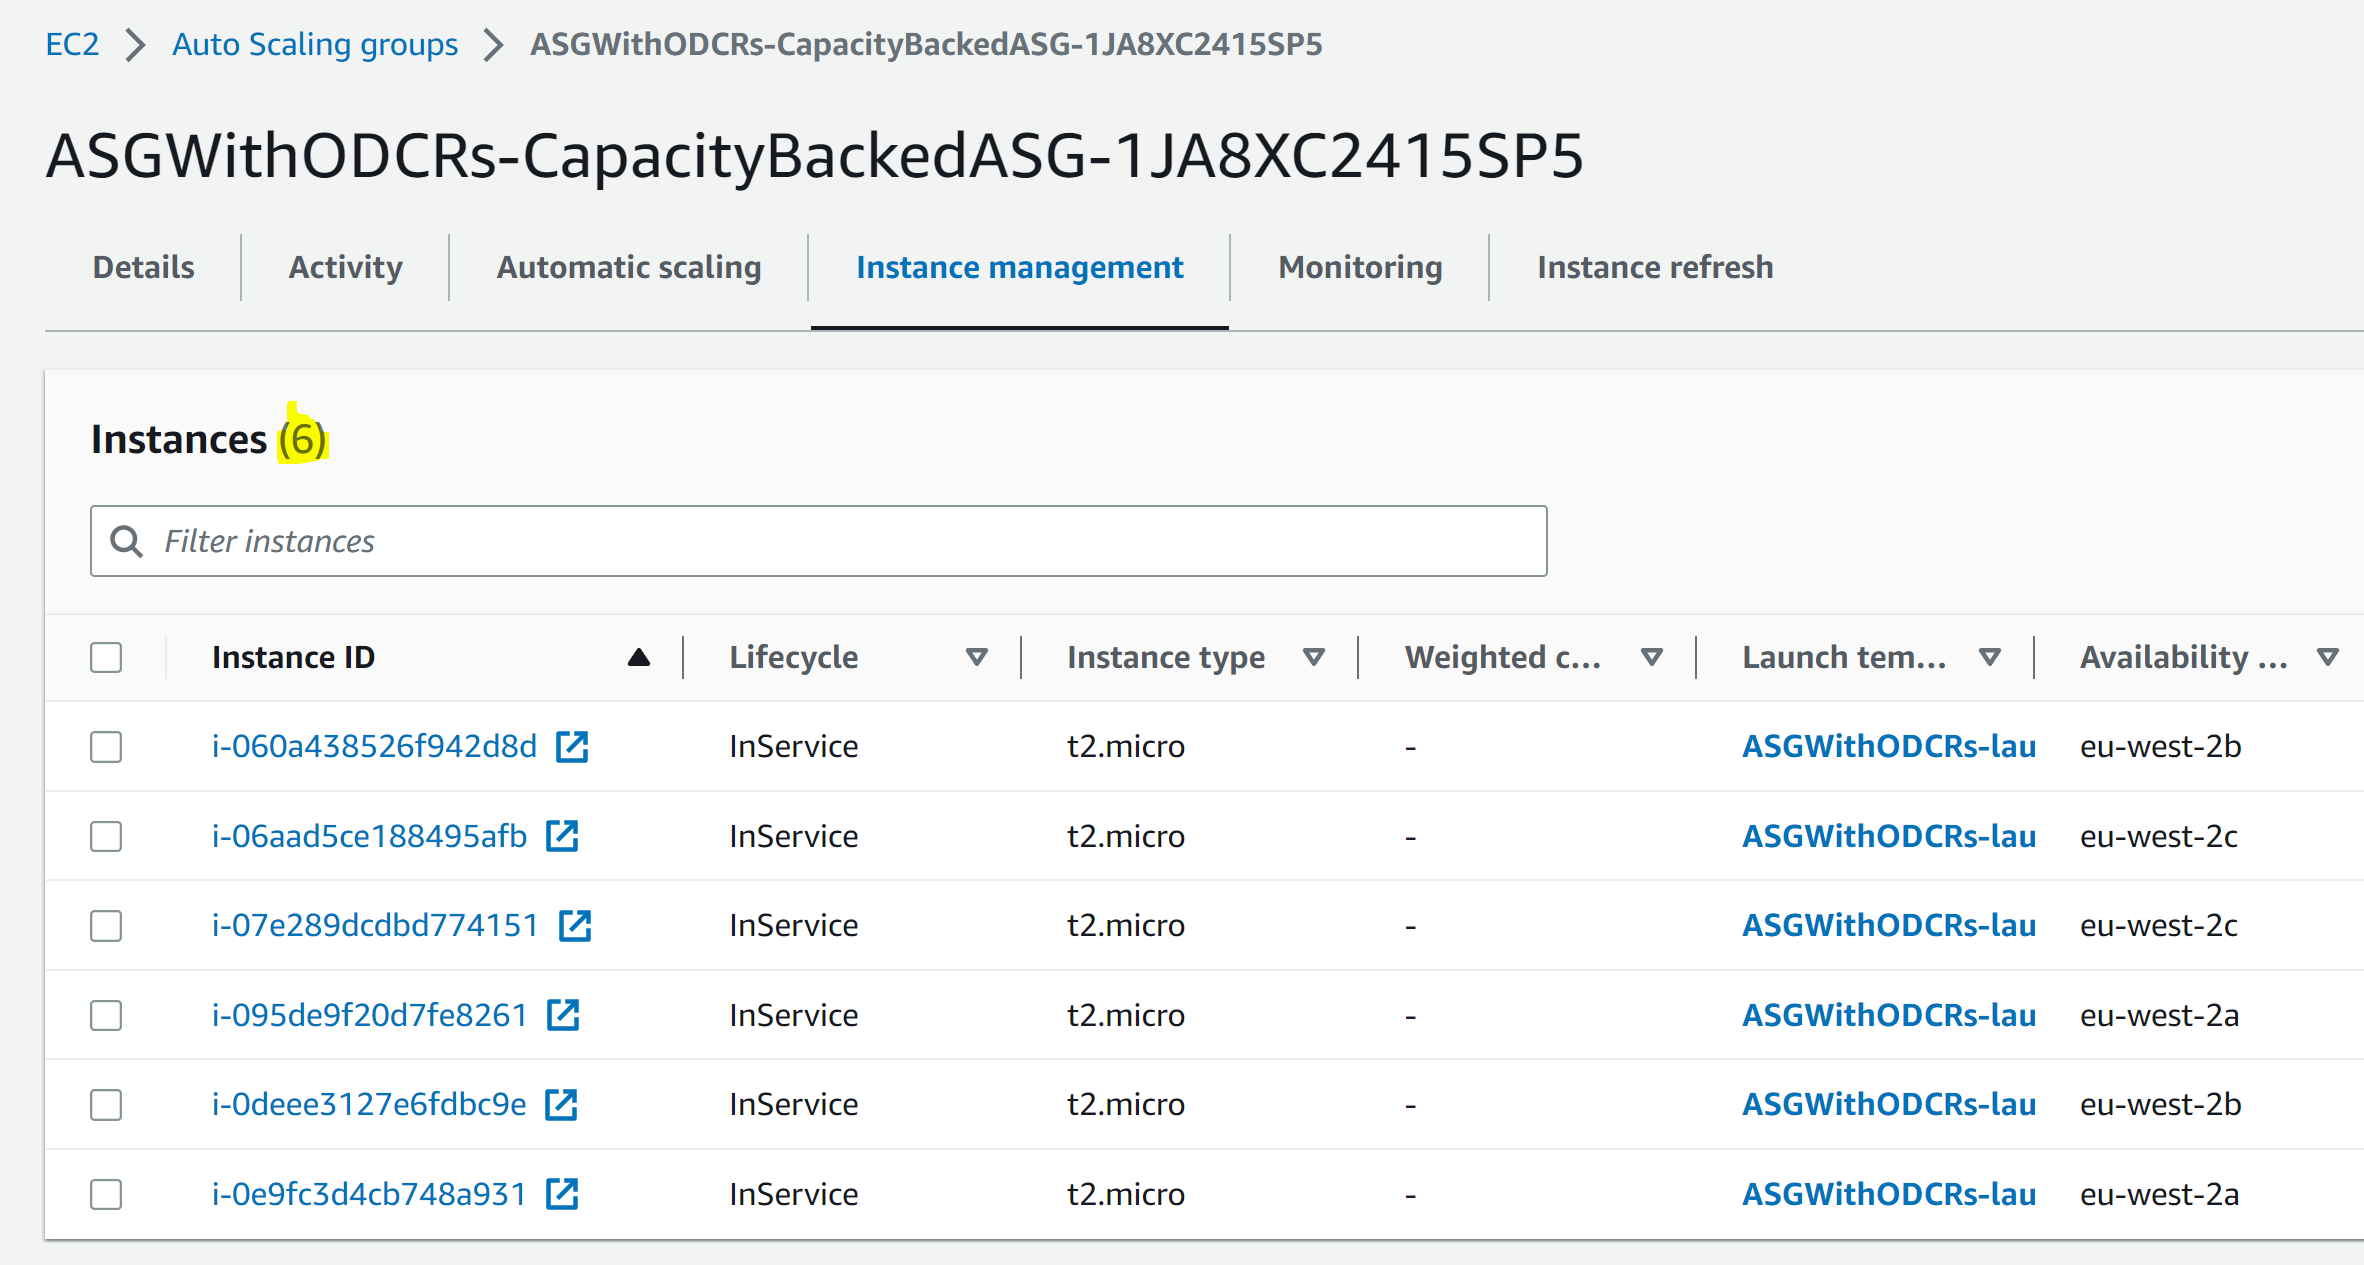


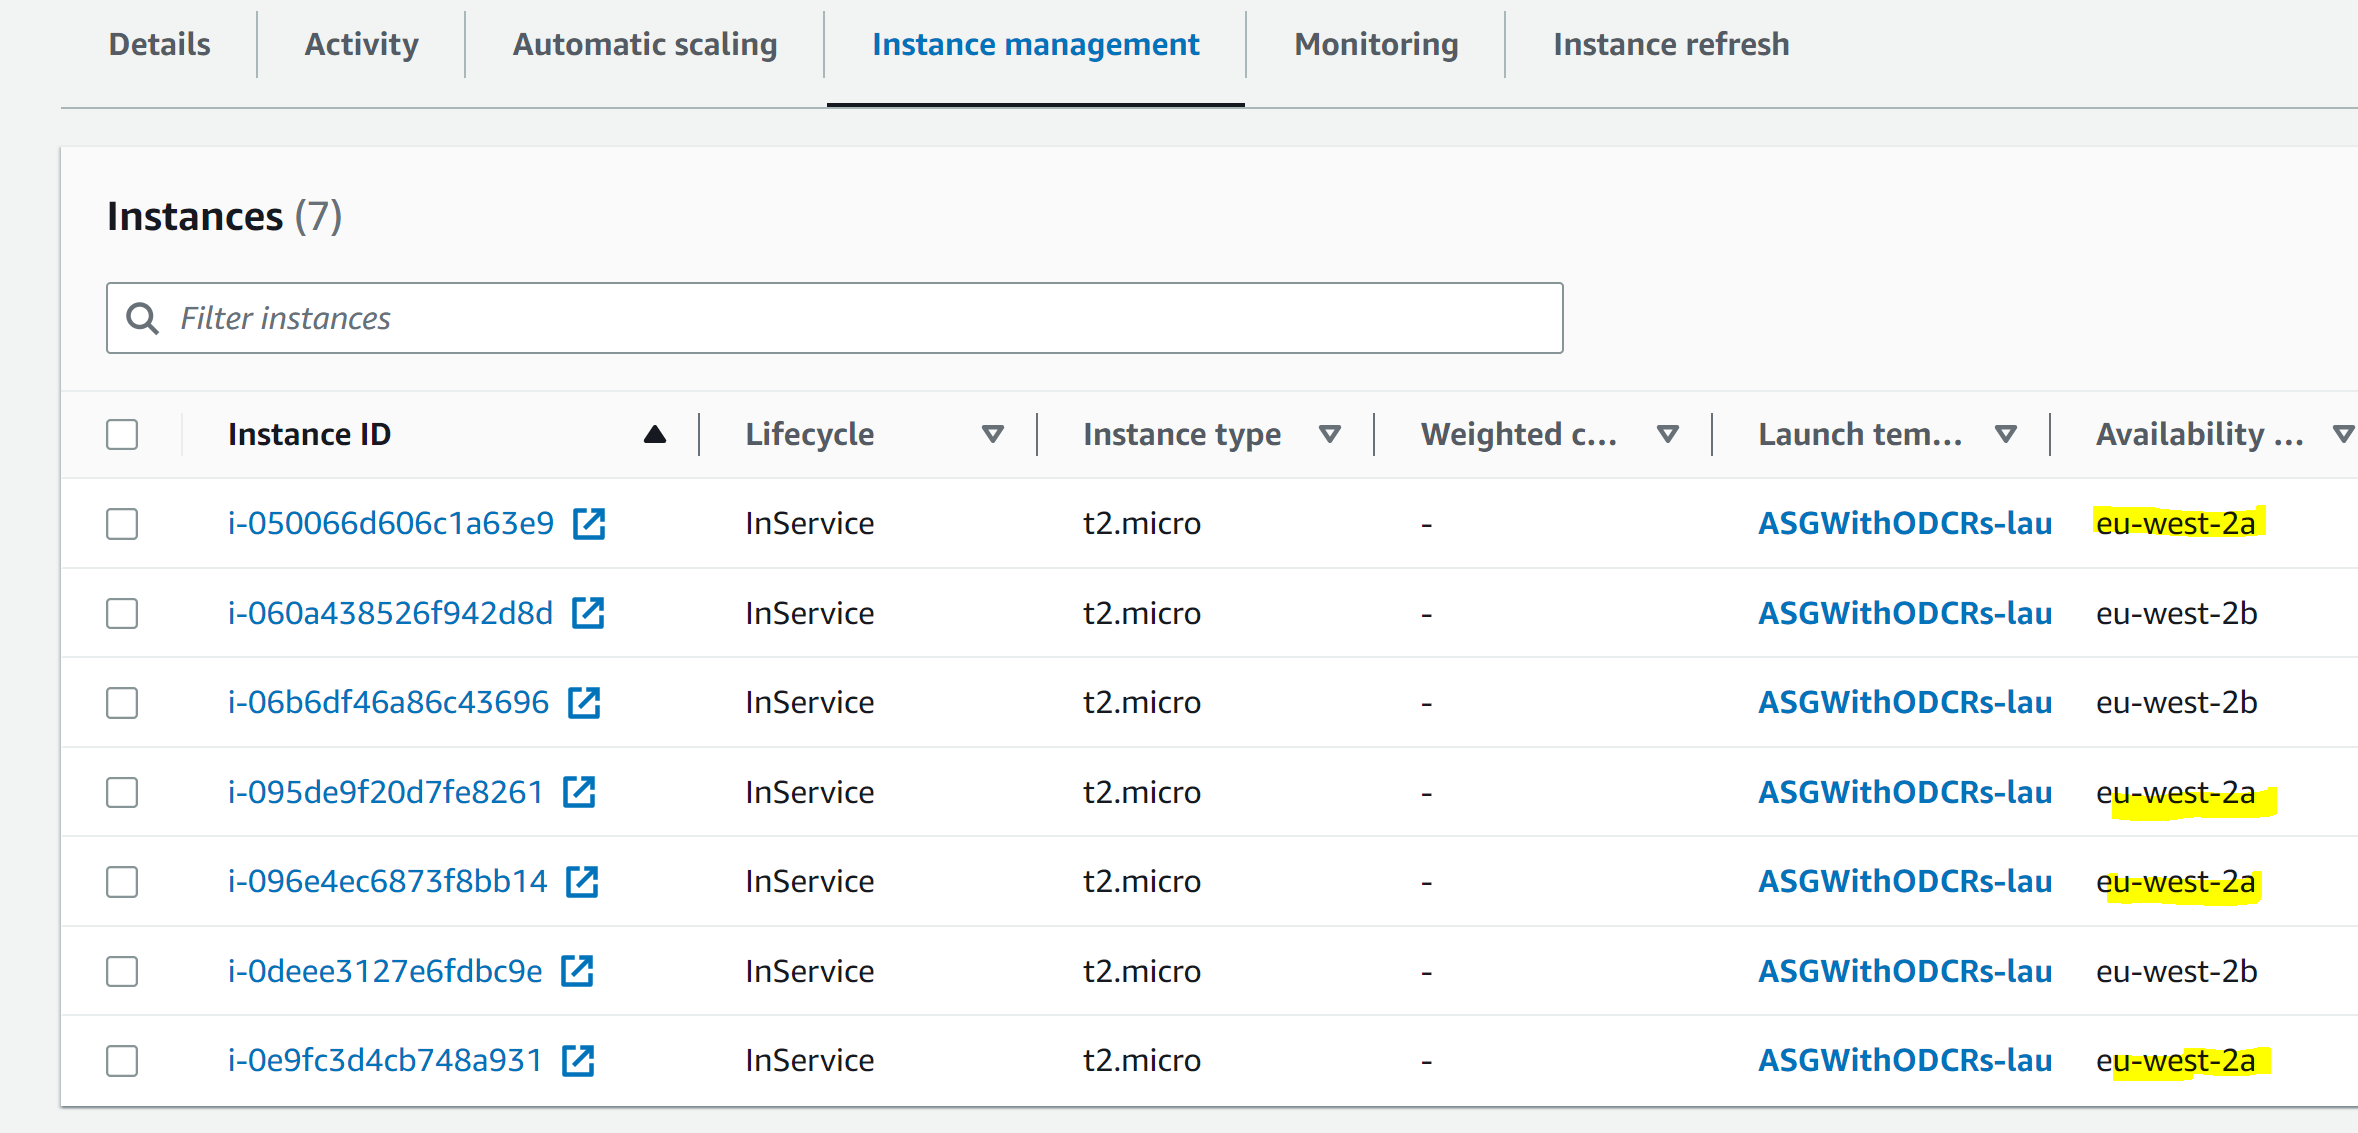

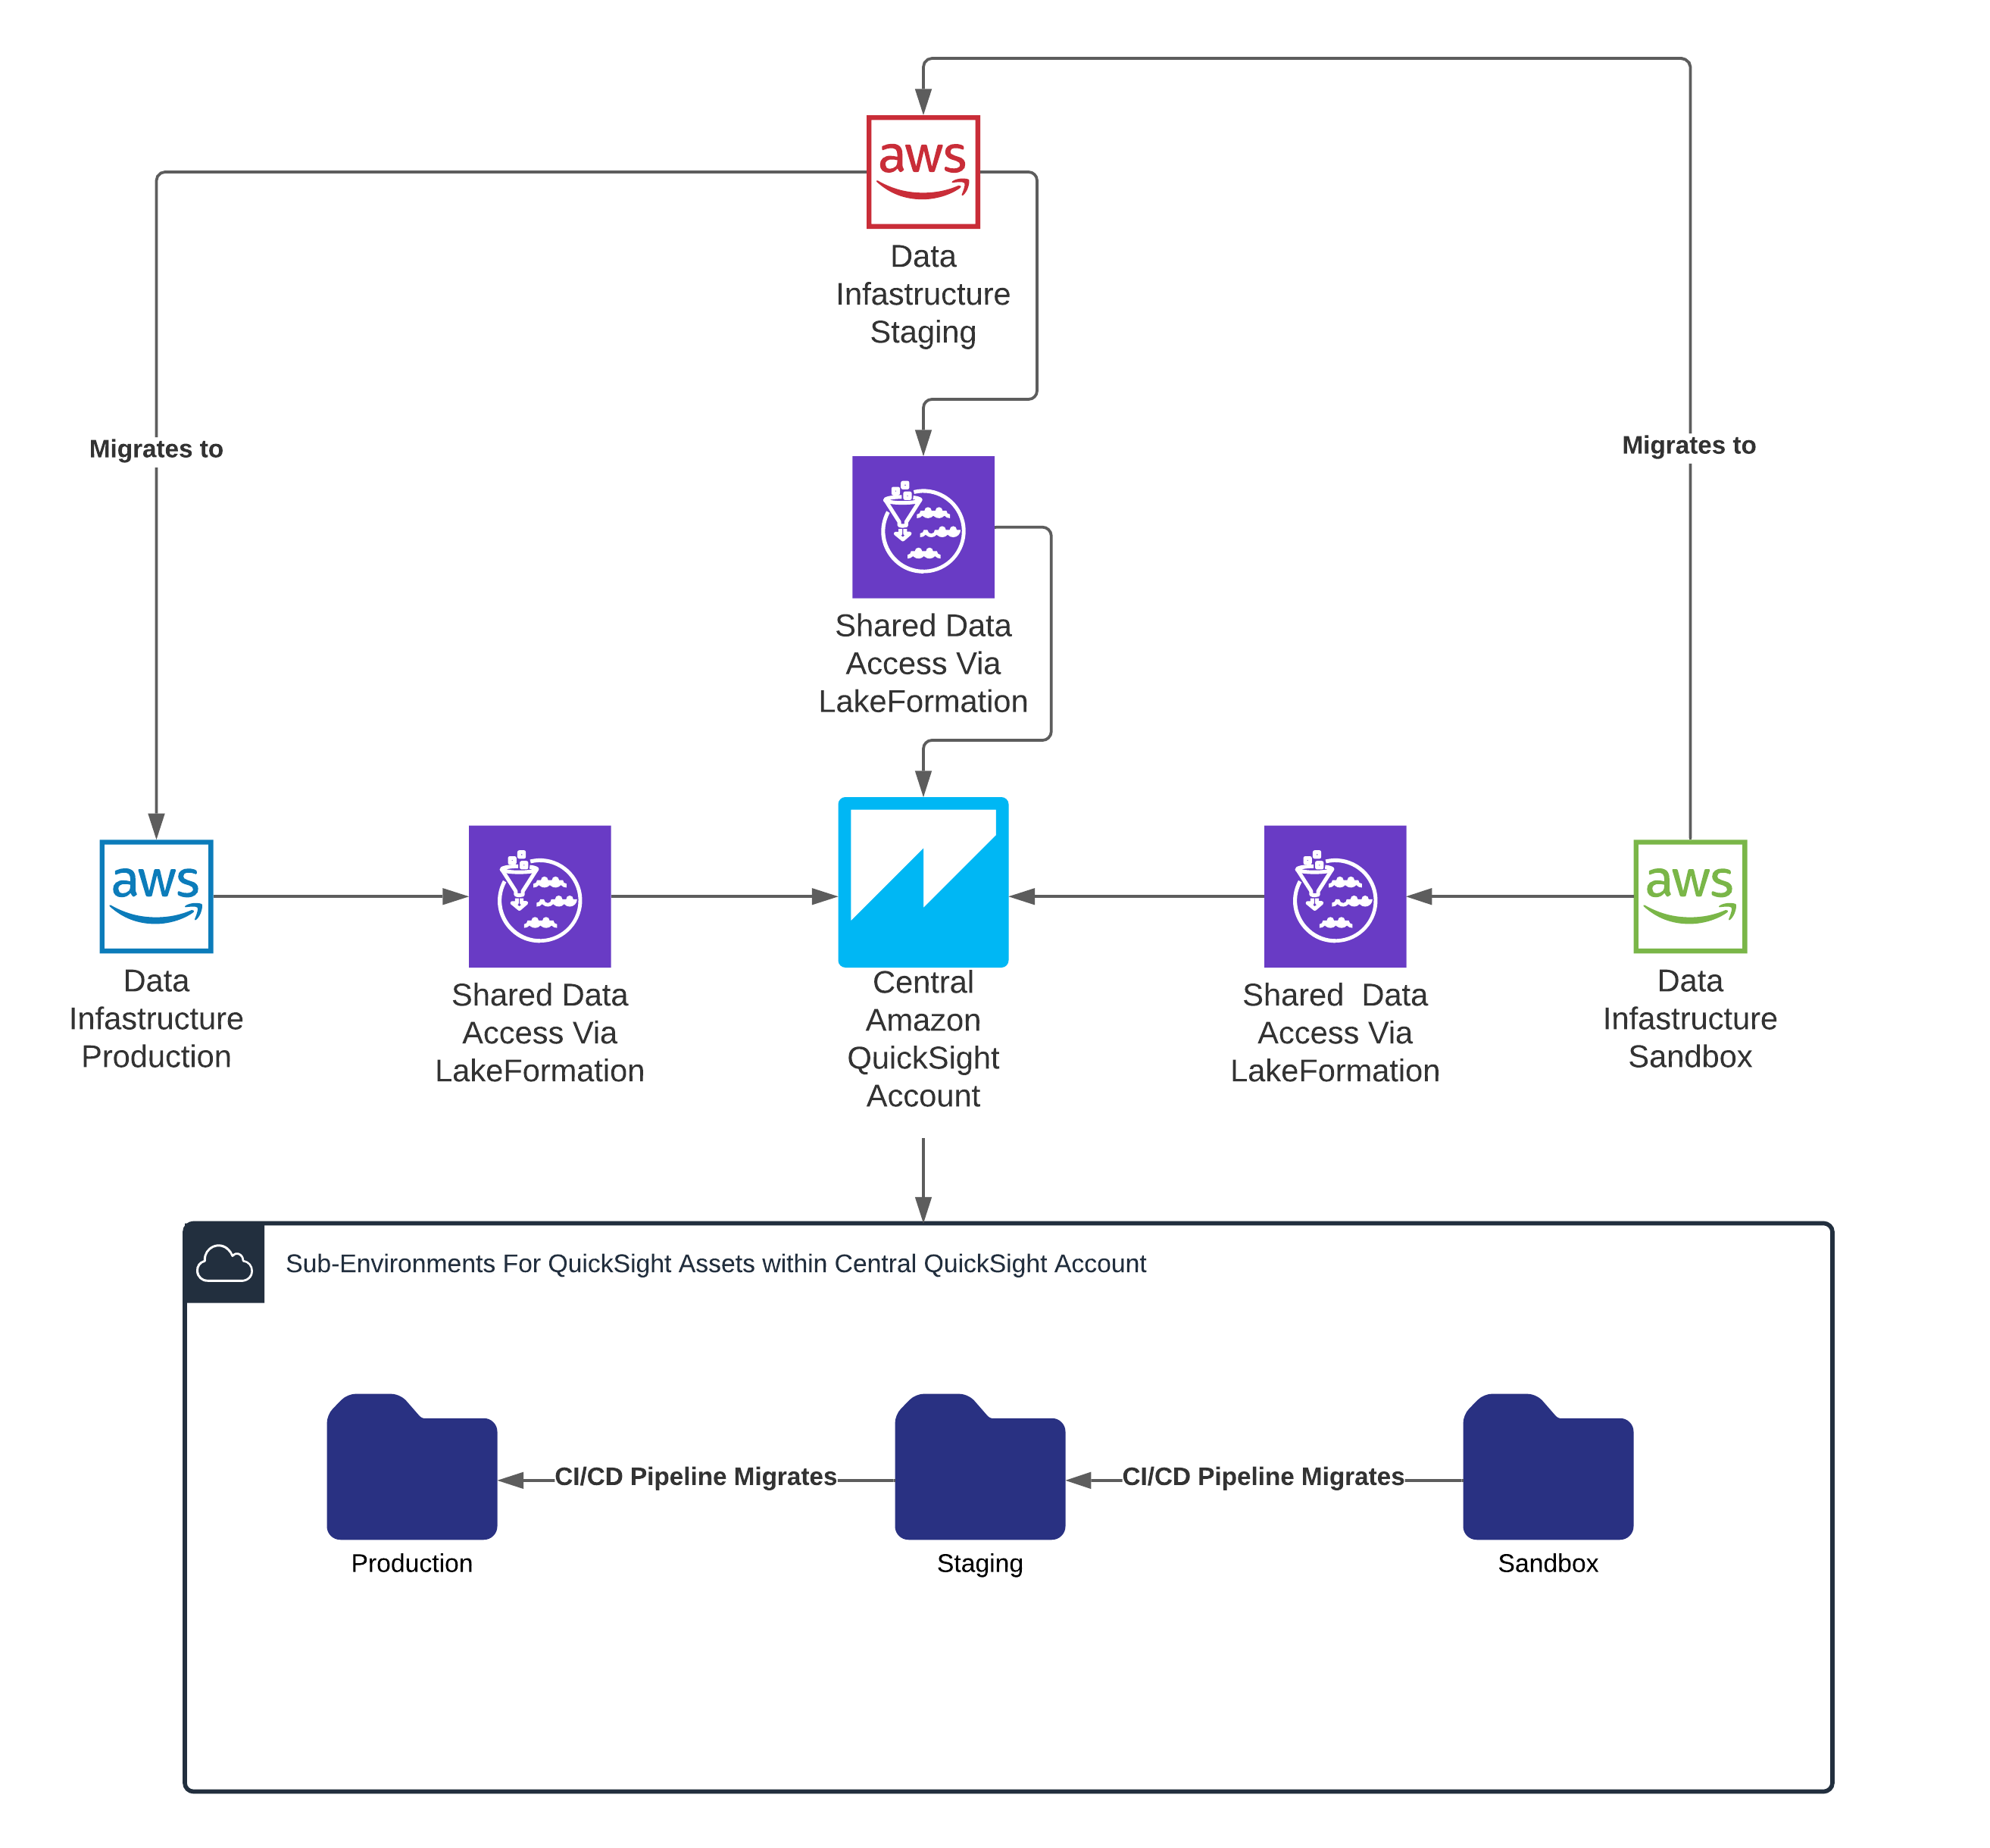
 Corey Johnson is the Lead Data Architect at Huron, where he leads its data architecture for their Global Products Data and Analytics initiatives.
 Sakti Mishra is a Principal Data Analytics Architect at AWS, where he helps customers modernize their data architecture, help define end to end data strategy including data security, accessibility, governance, and more. He is also the author of the book