Post Syndicated from Deependra Shekhawat original https://aws.amazon.com/blogs/architecture/optimizing-data-with-automated-intelligent-document-processing-solutions/
Many organizations struggle to effectively manage and derive insights from the large amount of unstructured data locked in emails, PDFs, images, scanned documents, and more. The variety of formats, document layouts, and text makes it difficult for any standard Optical Character Recognition (OCR) to extract key insights from these data sources.
To help organizations overcome these document management and information extraction challenges, AWS offers connected, pre-trained artificial intelligence (AI) service APIs that help drive business outcomes from these document-based rich data sources.
This blog post describes a cost-effective, scalable automated intelligent document processing solution that leverages a Natural Processing Language (NLP) engine using Amazon Textract and Amazon Comprehend. This solution helps customers take advantage of industry leading machine learning (ML) technology in their document workflows without the need for in-house ML expertise.
Customer document management challenges
Customers across industry verticals experience the following document management challenges:
- Extraction process accuracy varies significantly when applied to diverse sources; specifically handwritten text, images, and scanned documents.
- Existing scripting and rule-based solutions cannot provide customer domain or problem-specific classifiers.
- Traditional document management systems cannot consider feedback from domain experts to improve the learning process.
- The Personally Identifiable Information (PII) data-handling is not robust or customizable, causing data privacy leakage concern.
- Many manual interventions are required to complete the entire process.
Automated intelligent document processing solution
We introduced an automated intelligent document processing implementation to address key document management challenges. At the heart of the solution is a NLP engine that combines:
- Amazon Textract
- Amazon Comprehend
- Amazon SageMaker
- Custom regular expression-based Python parser
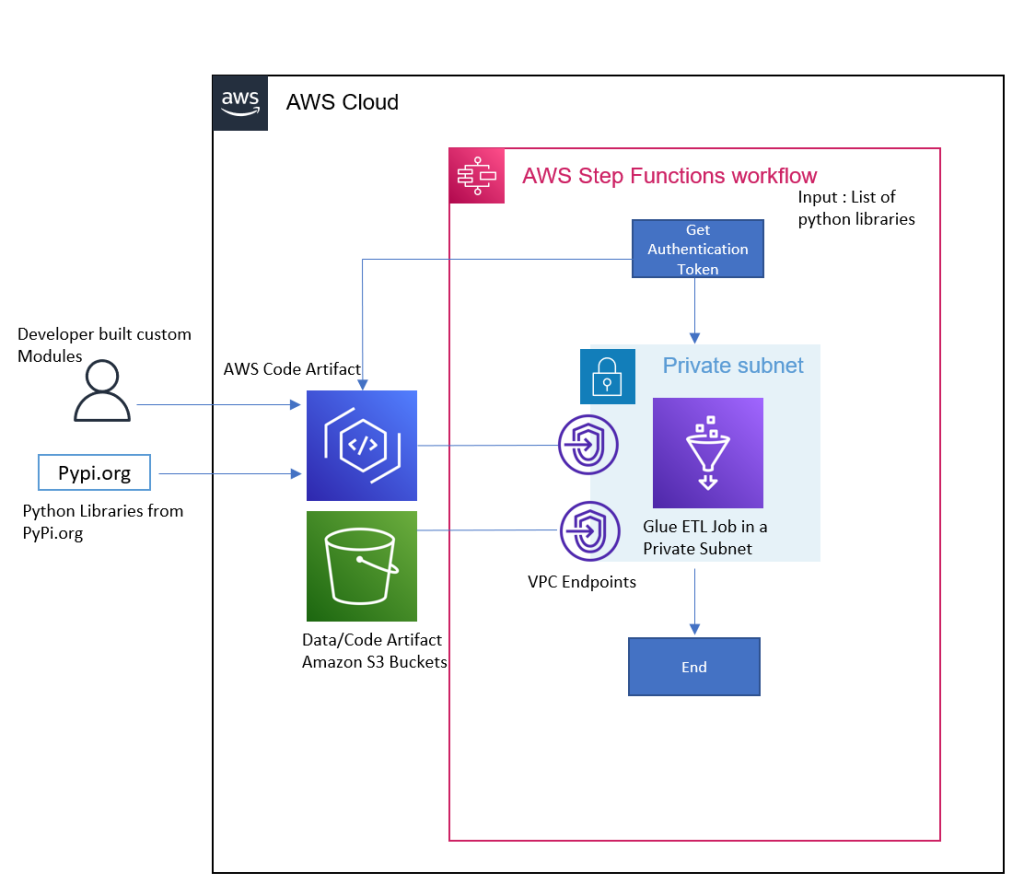
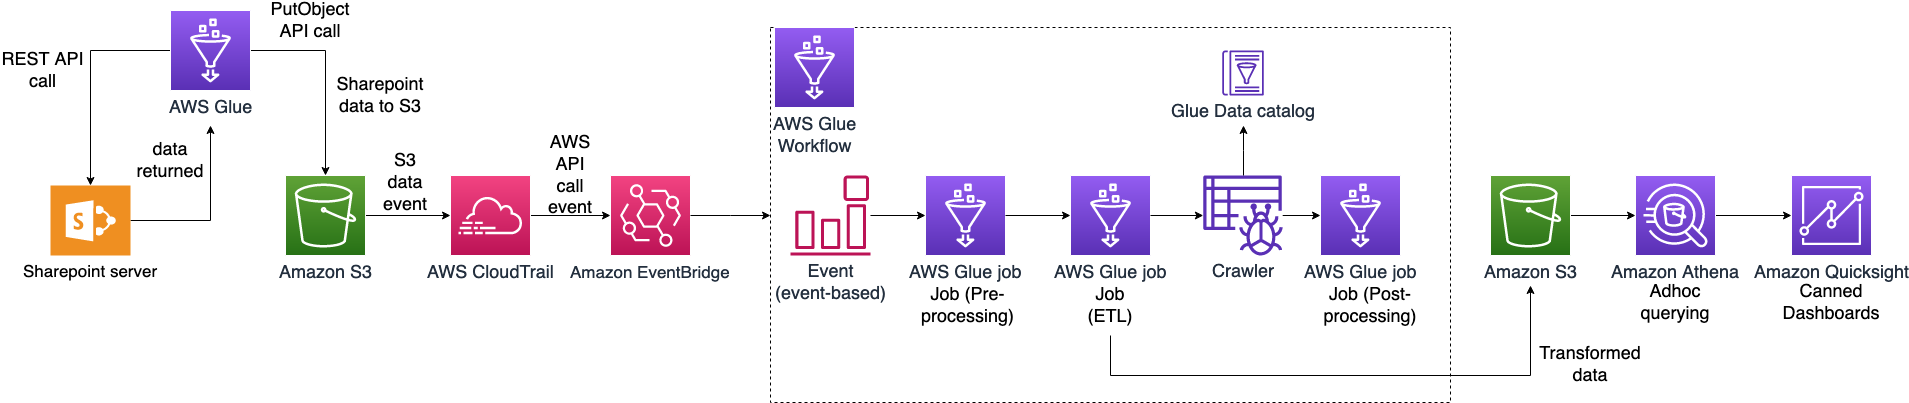
The full solution also leverages other AWS services as described in the following diagram (Figure 1) and steps to develop and operate a cost-effective and scalable architecture for document processing. It effectively extracts text from document types including PDFs, images, scanned documents, Microsoft Excel workbooks, and more.

Figure 1: AI-based intelligent document processing engine
Solution overview
Let’s explore the automated intelligent document processing solution step by step.
- The document upload engine or business users upload the respective files or documents through a custom web application to the designated Amazon Simple Storage Service (Amazon S3) bucket.
- The event-based architecture signals an Amazon S3 push event to invoke the respective AWS Lambda function to start document pre-processing.
- The Lambda function evaluates the document payload, leverages Amazon Simple Queue Service (Amazon SQS) for async processing, prepares document metadata, stores it in Amazon DynamoDB, and calls the NLP engine to perform the information extraction process.
- The NLP engine leverages Amazon Textract for text extraction from a variety of sources and leverages document metadata to optimize the appropriate API calls (for example, form, tabular, or PDF).
- Amazon Textract output is fed into Amazon Comprehend which consumes the extracted text and performs entity parsing, line/paragraph-based sentiment analysis, and document/paragraph classification. For better accuracy, we leverage a custom classifier within Amazon Comprehend.
- Amazon Comprehend also provides key APIs to mask PII data before it is used for any further consumption. The solution offers the ability to configure masking rules for each PII entity per masking requirements.
- To ensure the solution has capability to handle data from Microsoft Excel workbooks, we developed a custom parser using Python running inside an AWS Lambda function. Depending on the document metadata, this function can be invoked.
- Output of Amazon Comprehend is then fed to ML models deployed using Amazon SageMaker depending on additional use cases configured by the customer to complement the overall process with ML-based recommendations, predictions, and personalization.
- Once the NLP engine completes its processing, the job completion notification event signals another AWS Lambda function and updates the status in the respective Amazon SQS queue.
- The Lambda post-processing function parses the resultant content generated by the NLP engine and stores it in the Amazon DynamoDB and Amazon S3 bucket. This step is responsible for the required data augmentation, key entities validation, and default value assignment to create a data structure that could be consumed by the presentation/visualization layer.
- Users get the flexibility to see the extracted information and compare it with the original document extract in the custom user interface (UI). They can provide their feedback on extraction and entity parsing accuracy. From a user access management perspective, Amazon Cognito provides authorization and authentication.
Customer benefits
The automated intelligent document processing solution helps customers:
- Increase overall document management efficiency by 50-60%, leveraging automation and nullifying manual interventions
- Reduce in-house team involvement in administrative activities by up to 70% using integrated and connected processing workflows
- Gain better visibility into key contractual obligations with features such as Document Classification (helps properly route documents to the respective process/team) and Obligation Extraction
- Utilize a UI-based feedback mechanism for in-house domain experts/reviewers to see and validate the extracted information and offer feedback to inform further model training
From a cost-optimization perspective, depending on document type and required information, only the respective Amazon Textract APIs calls are submitted. (For example, it is not worth using form/table-based Textract API calls for a Know Your Customer (KYC) document such as a driver’s license or passport when the AnalyzeID API is the most efficient solution.)
To maximize solution benefits, customers should invest time in building well-defined taxonomies ahead of using the document processing solution to accommodate their own use cases or industry domain-specific requirements. Their taxonomy input highlights only relevant keys and takes respective actions in case the requires keys are not extracted.
Vertical industry use cases
As mentioned, this document processing solution can be used across industry segments. Let’s explore some practical use cases. For example, it can help insurance industry professionals to accelerate claim processing and customer KYC-related processes. By extracting the key entities from the claim documents, mapping them against the customer defined taxonomy, and integrating with Amazon SageMaker models for anomaly detection (anomalous claims), insurance providers can improve claim management and customer satisfaction.
In the healthcare industry, the solution can help with medical records and report processing, key medical entity extraction, and customer data masking.
The document processing solution can help the banking industry by automating check processing and delivering the ability to extract key entities like payer, payee, date, and amount from the checks.
Conclusion
Manual document processing is resource-intensive, time consuming, and costly. Customers need to allocate resources to process large volume documents, lowering business agility. Their employees are performing manual “stare and compare” tasks, potentially reducing worker morale and preventing them from focusing where their efforts are better placed.
Intelligent document processing helps businesses overcome these challenges by automating the classification, extraction, and analysis of data. This expedites decision cycles, allocates resources to high-value tasks, and reduces costs.
Pre-trained APIs of AWS AI services allow for quick classification, extraction, and data analyzation from scores of documents. This solution also has industry specific features that can quickly process specialized industry specific documents. This blog discussed the foundational architecture to helps to accelerate implementation of any specific document processing use case.


 Kachi Odoemene is an Applied Scientist at AWS AI. He builds AI/ML solutions to solve business problems for AWS customers.
 Taylor McNally is a Deep Learning Architect at Amazon Machine Learning Solutions Lab. He helps customers from various industries build solutions leveraging AI/ML on AWS. He enjoys a good cup of coffee, the outdoors, and time with his family and energetic dog.
 Austin Welch is a Data Scientist in the Amazon ML Solutions Lab. He develops custom deep learning models to help AWS public sector customers accelerate their AI and cloud adoption. In his spare time, he enjoys reading, traveling, and jiu-jitsu.