Post Syndicated from Jani Muuriaisniemi original https://aws.amazon.com/blogs/devops/parallel-and-dynamic-saas-deployments-with-cdk-pipelines/
Software as a Service (SaaS) is an increasingly popular business model for independent software vendors (ISVs), including benefits such as a pay-as-you-go pricing model, scalability, and availability.
SaaS services can be built by using numerous architectural models. The silo model provides each tenant with dedicated resources and a shared-nothing architecture. Silo deployments also provide isolation between tenants’ compute resources and their data, and they help eliminate the noisy-neighbor problem. On the other hand, the pool model offers several benefits, such as lower maintenance overhead, simplified management and operations, and cost-saving opportunities, all due to a more efficient utilization of computing resources and capacity. In the bridge model, both silo and pool models are utilized side-by-side. The bridge model is a hybrid model, where parts of the system can be in a silo model, and parts in a pool.
End-customers benefit from SaaS delivery in numerous ways. For example, the service can be available from multiple locations, letting the customer choose what is best for them. The tenant onboarding process is often real-time and frictionless. To realize these benefits for their end-customers, SaaS providers need methods for reliable, fast, and multi-region capable provisioning and software lifecycle management.
This post will describe a deployment system for automating the provision and lifecycle management of workload components in pool or silo deployment models by using AWS Cloud Development Kit (AWS CDK) and CDK Pipelines. We will explore the system’s dynamic and database driven deployment model, as well as its multi-account and multi-region capabilities, and we will provision demo deployments of workload components in both the silo and pool models.
AWS Cloud Development Kit and CDK Pipelines
For this solution, we utilized AWS Cloud Development Kit (AWS CDK) and its CDK Pipelines construct library. AWS CDK is an open-source software development framework for modeling and provisioning cloud application resources by using familiar programming languages. AWS CDK lets you define your infrastructure as code and provision it through AWS CloudFormation.
CDK Pipelines is a high-level construct library with an opinionated implementation of a continuous deployment pipeline for your CDK applications. It is powered by AWS CodePipeline, a fully managed continuous delivery service that helps automate your release pipelines for fast and reliable application as well as infrastructure updates. No servers need to be provisioned or setup, and you only pay for what you use. This solution utilizes the recently released and stable CDK Pipelines modern API.
Business Scenario
As a baseline use case, we have selected the consideration of a fictitious ISV called Unicorn that wants to implement an SaaS business model.
Unicorn operates in several countries, and requires the storing of customer data within the customers’ chosen region. Currently, Unicorn needs two regions in order to satisfy its main customer base: one in EU and one in US. Unicorn expects rapid growth, and it needs a solution that can scale to thousands of tenants. Unicorn plans to have different tenant tiers with different isolation requirements. Their planned deployment model has the majority of tenants in shared pool instances, but they also plan to support dedicated silo instances for the tenants requiring it. The solution must also be easily extendable to new Regions as Unicorn’s business expands.
Unicorn is starting small with just a single development team responsible for currently the only component in their SaaS workload architecture. Following industry best practices, Unicorn has designed its workload architecture so that each component has a clear technical ownership boundary. The chosen solution must grow together with Unicorn, and support multiple independently developed and deployed components in the future.
Solution Overview
Today, many customers utilize AWS CodePipeline to build, test, and deploy their cloud applications. For an SaaS provider such as Unicorn, considering utilizing a single pipeline for managing every deployment presented concerns. At the scale that Unicorn requires, a single pipeline with potentially hundreds of actions runs the risk of becoming throughput limited. Moreover, a single pipeline would offer Unicorn limited control over how changes are released.
Our solution addresses this problem by having a separate dynamically provisioned pipeline for each pool and silo deployment. The solution is designed to manage multiple deployments of Unicorn’s single workload component, thereby aligning with their current needs — and with small changes, including future needs.
CDK Best Practices state that an AWS CDK application maps to a component as defined by the AWS Well-Architected Framework. A component is the code, configuration, and AWS Resources that together deliver against a workload requirement. And this is typically the unit of technical ownership. A component usually includes logical units (e.g., api, database), and can have a continuous deployment pipeline.
Utilizing CDK Pipelines provides a significant benefit: with no additional code, we can deploy cross-account and cross-region just as easily as we would to a single account and region. CDK Pipelines automatically creates and manages the required cross-account encryption keys and cross-region replication buckets. Furthermore, we only need to establish a trust relationship between the accounts during the CDK bootstrapping process.
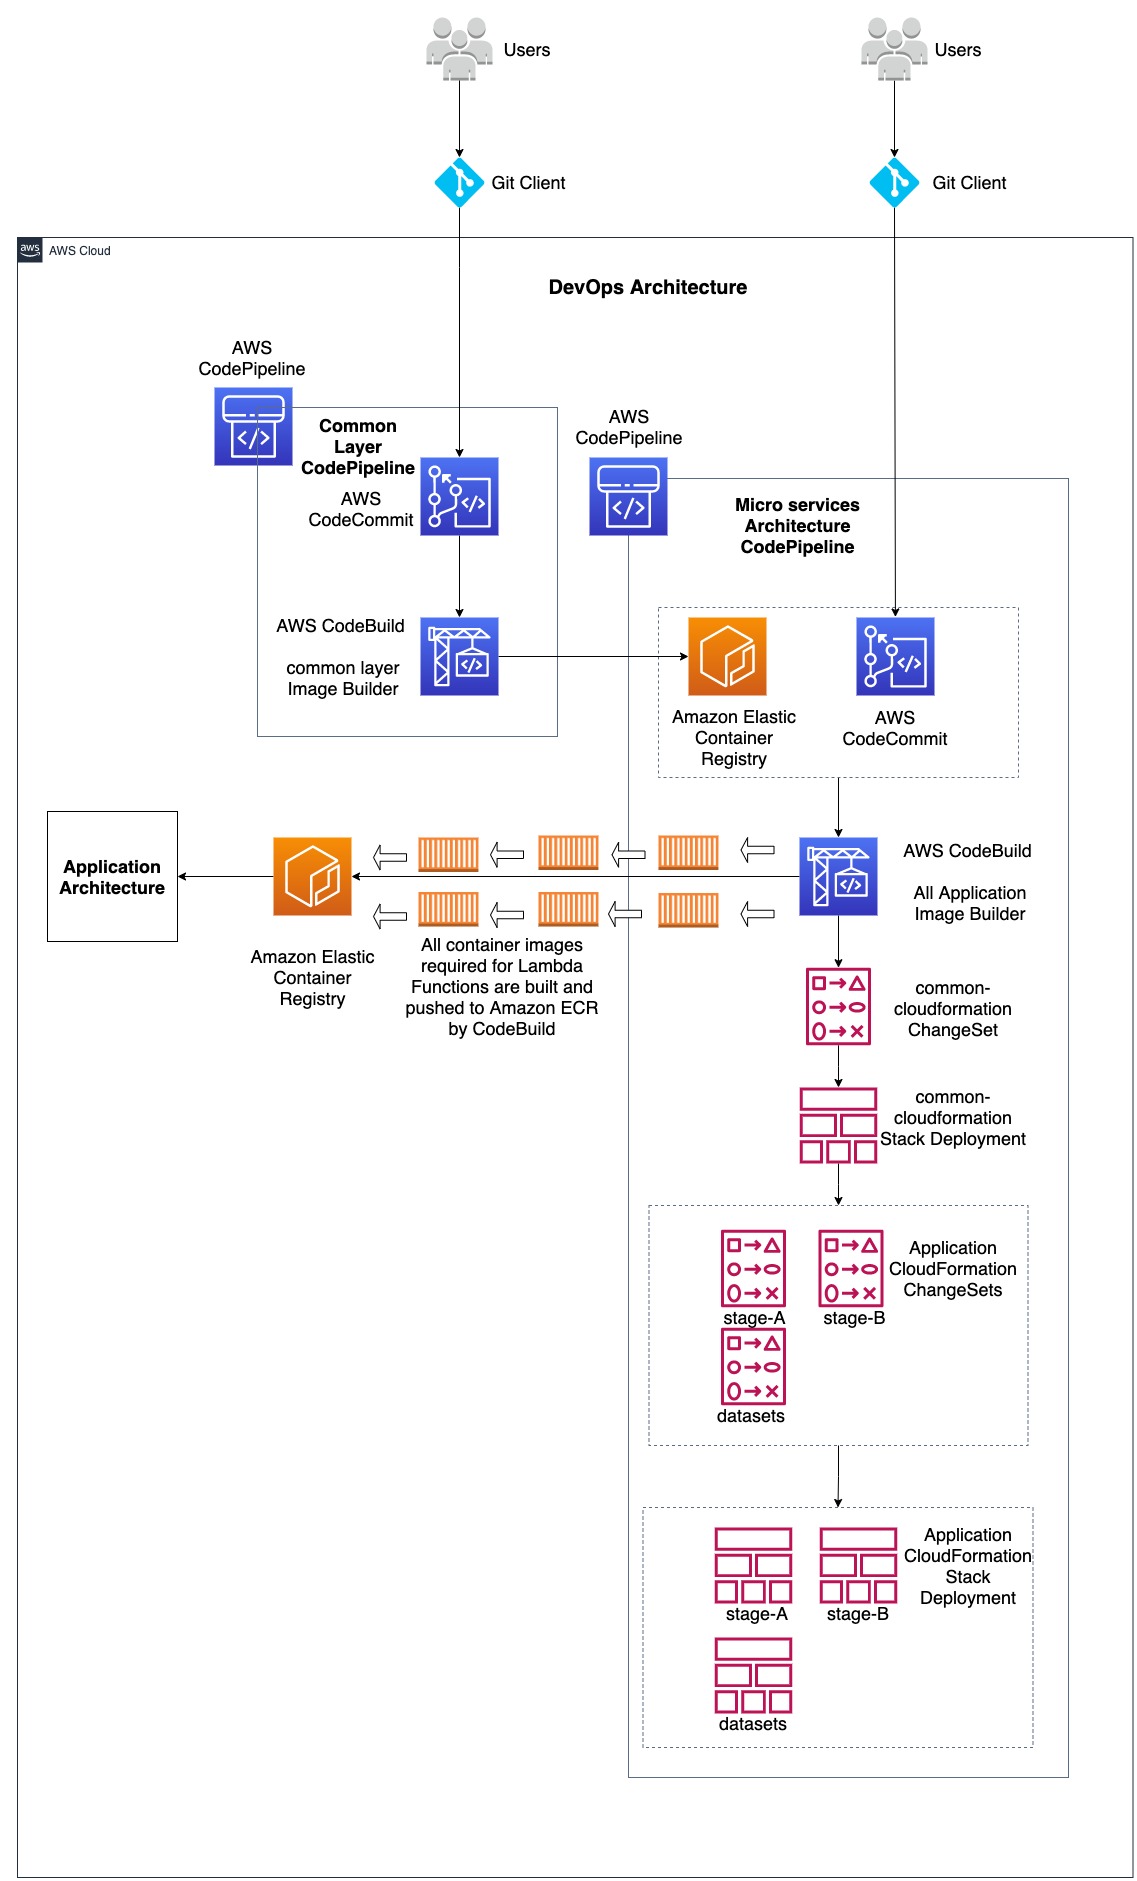
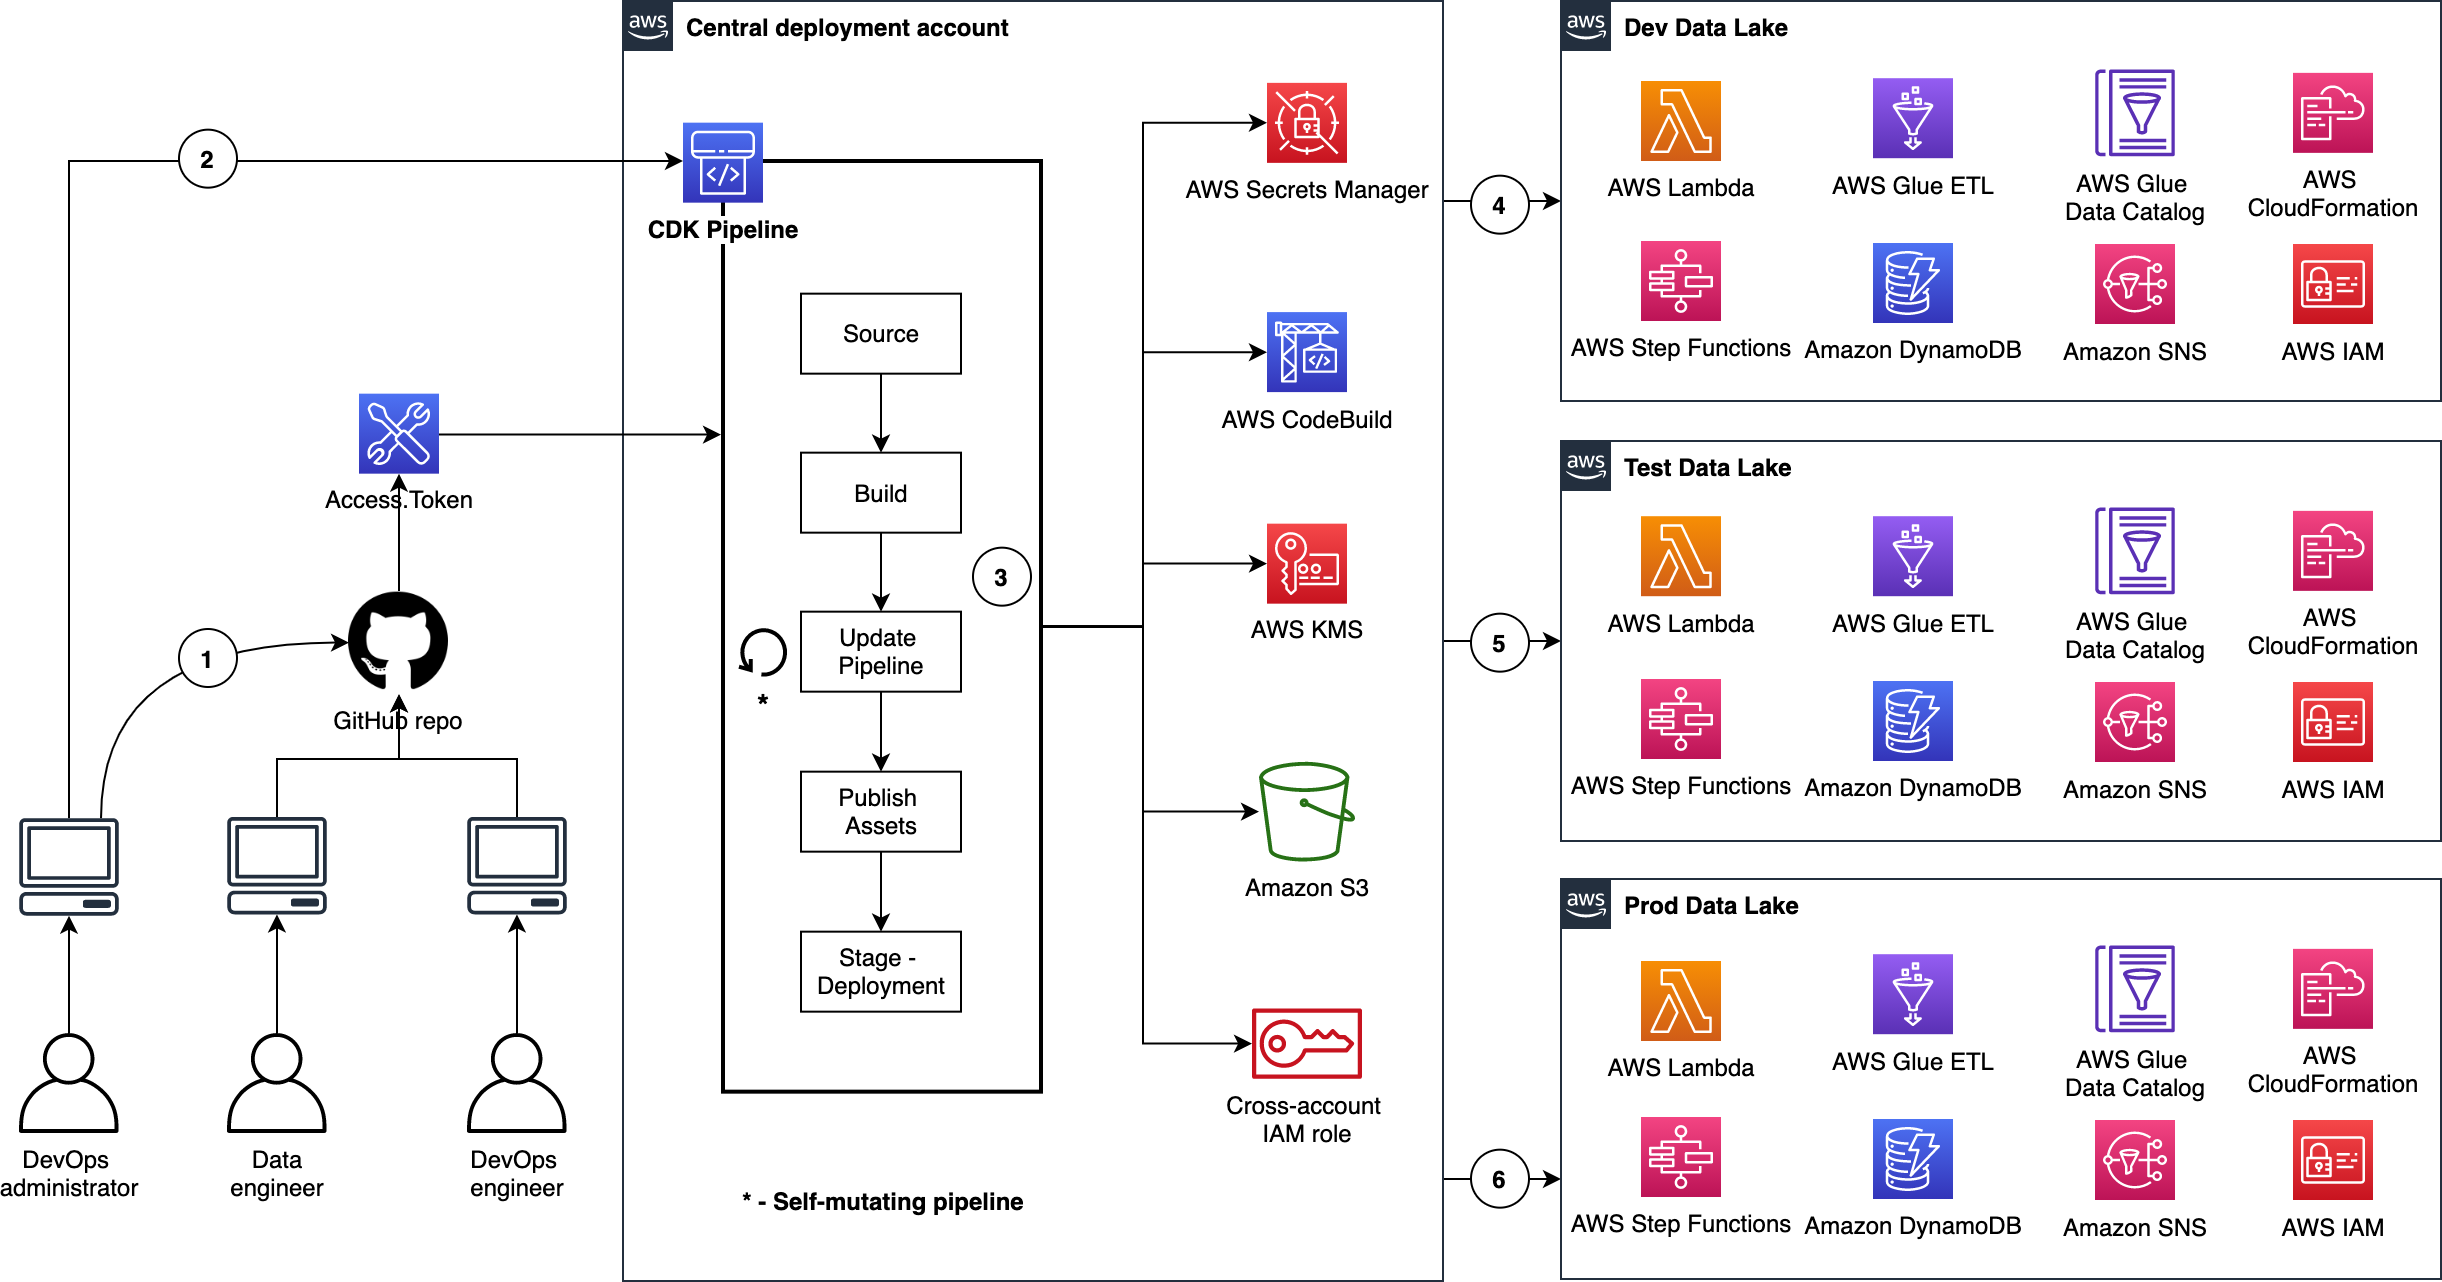
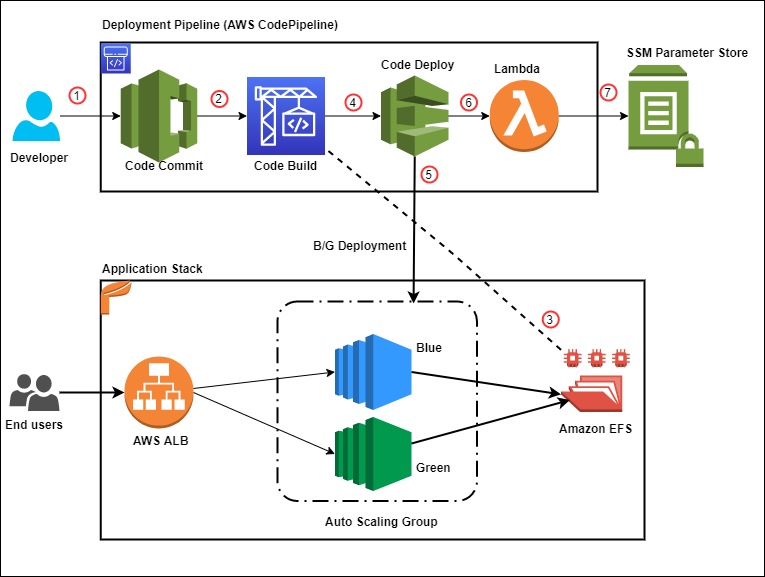
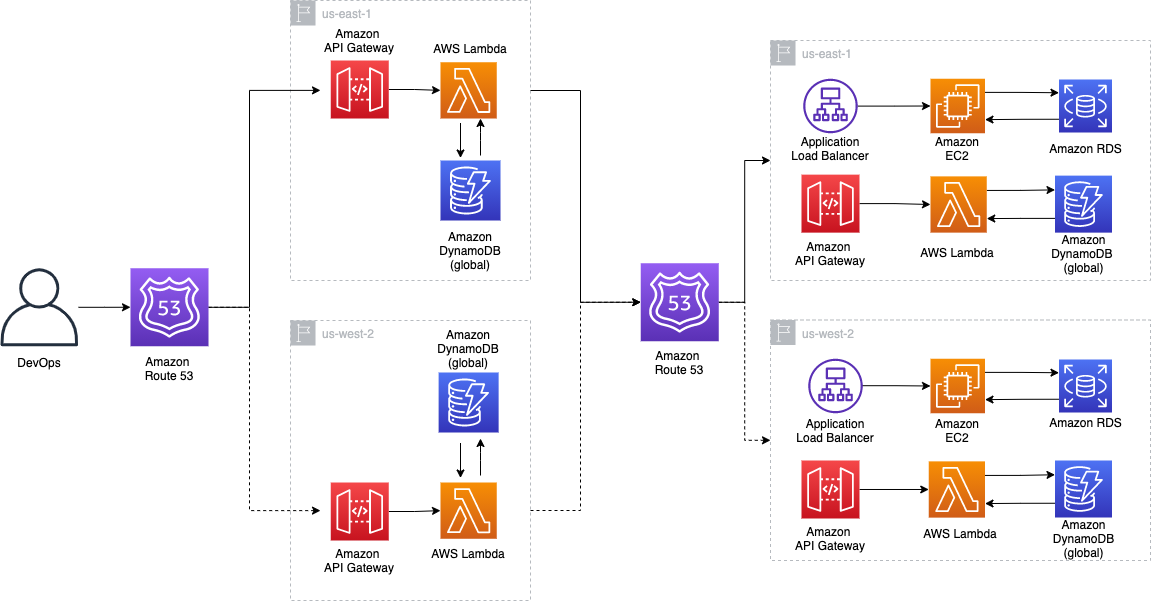
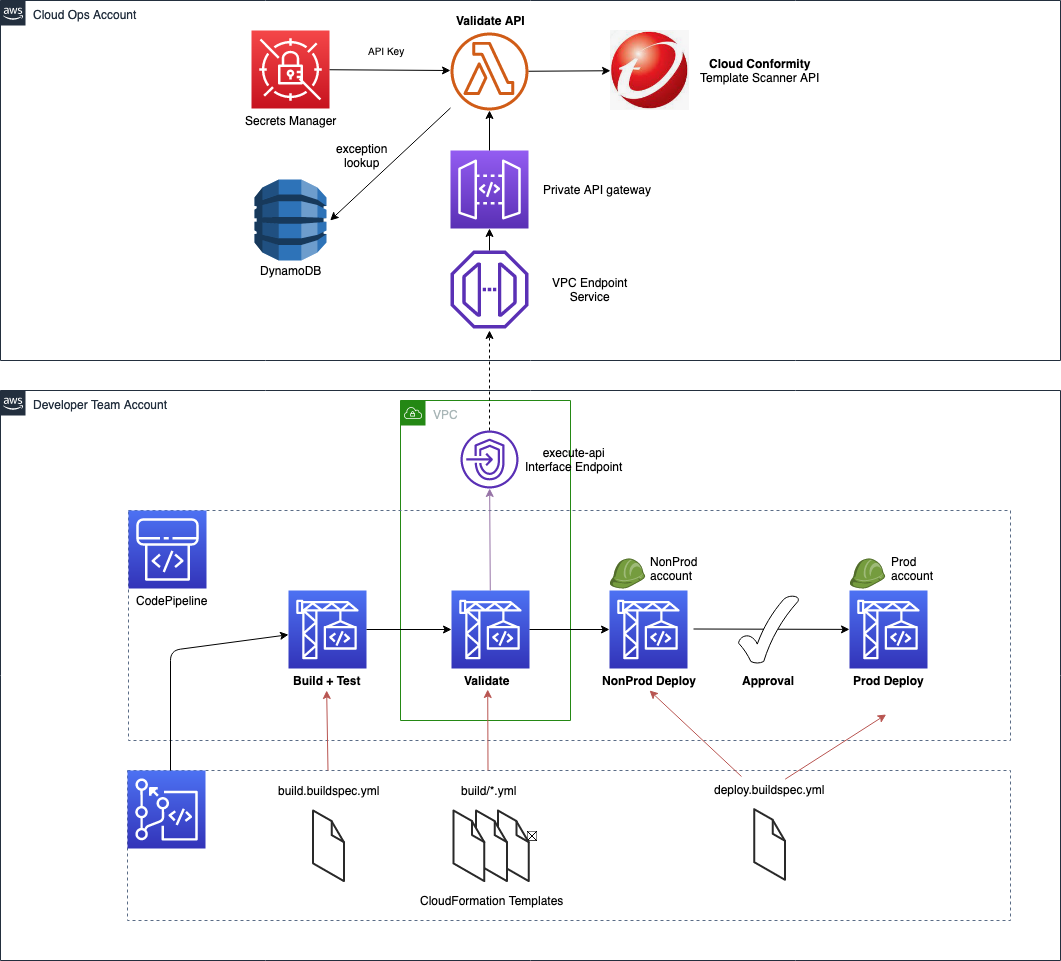
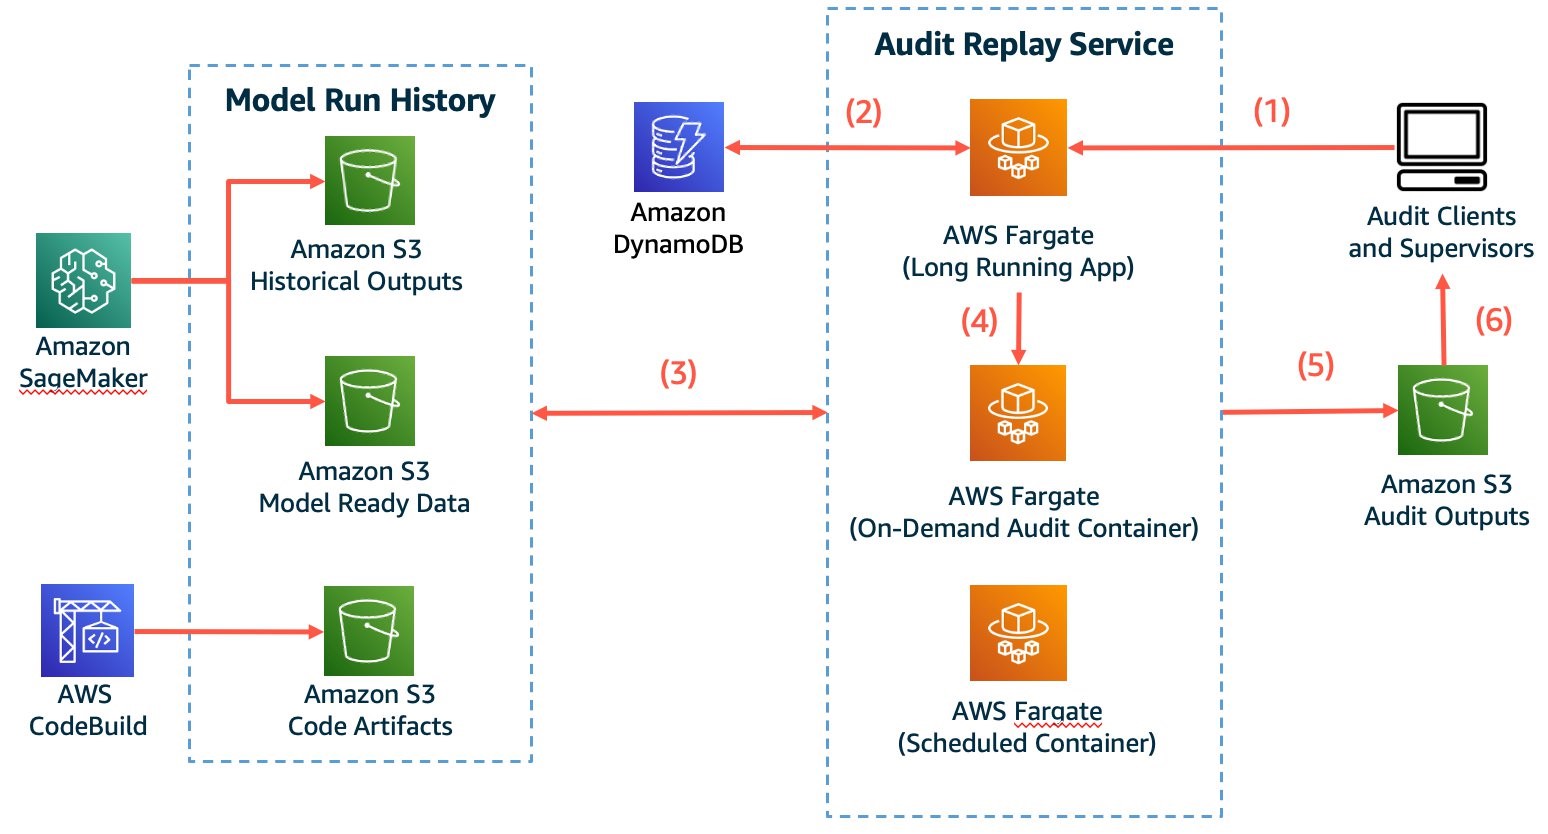
The following diagram illustrates the solution architecture:

Figure 1: Solution architecture
Let’s look closer at the two primary high level solution flows: silo and pool pipeline provisioning (1 and 2), and component code deployment (3 and 4).
Provisioning is separated into a dedicated flow, so that code deployments do not interfere with tenant onboarding, and vice versa. At the heart of the provisioning flow is the deployment database (1), which is implemented by using an Amazon DynamoDB table.
Utilizing DynamoDB Streams and AWS Lambda Triggers, a new AWS CodeBuild provisioning project build (2) is automatically started after a record is inserted into the deployment database. The provisioning project directly provisions new silo and pool pipelines by using the “cdk deploy” command. Provisioning events are processed in parallel, so that the solution can handle possible bursts in Unicorn’s tenant onboarding volumes.
CDK best practices suggest that infrastructure and runtime code live in the same package. A single AWS CodeCommit repository (3) contains everything needed: the CI/CD pipeline definitions as well as the workload component code. This repository is the source artifact for every CodePipeline pipeline and CodeBuild project. The chapter “Managing application resources as code” describes related implementation details.
The CI/CD pipeline (4) is a CDK Pipelines pipeline, and it is responsible for the component’s Software Development Life Cycle (SDLC) activities. In addition to implementing the update release process, it is expected that most SaaS providers will also implement additional activities. This includes a variety of tests and pre-production environment deployments. The chapter “Controlling deployment updates” dives deeper into this topic.
Deployments have two parts: The pipeline (5) and the component resource stack(s) (6) that it manages. The pipelines are deployed to the central toolchain account and region, whereas the component resources are deployed to the AWS Account and Region, as specified in the deployments’ record in the deployment database.
Sample code for the solution is available in GitHub. The sample code is intended for utilization in conjunction with this post. Our solution is implemented in TypeScript.
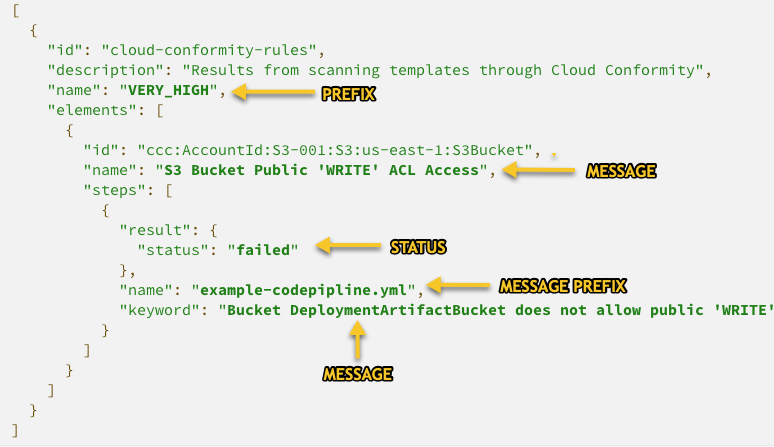
Deployment Database
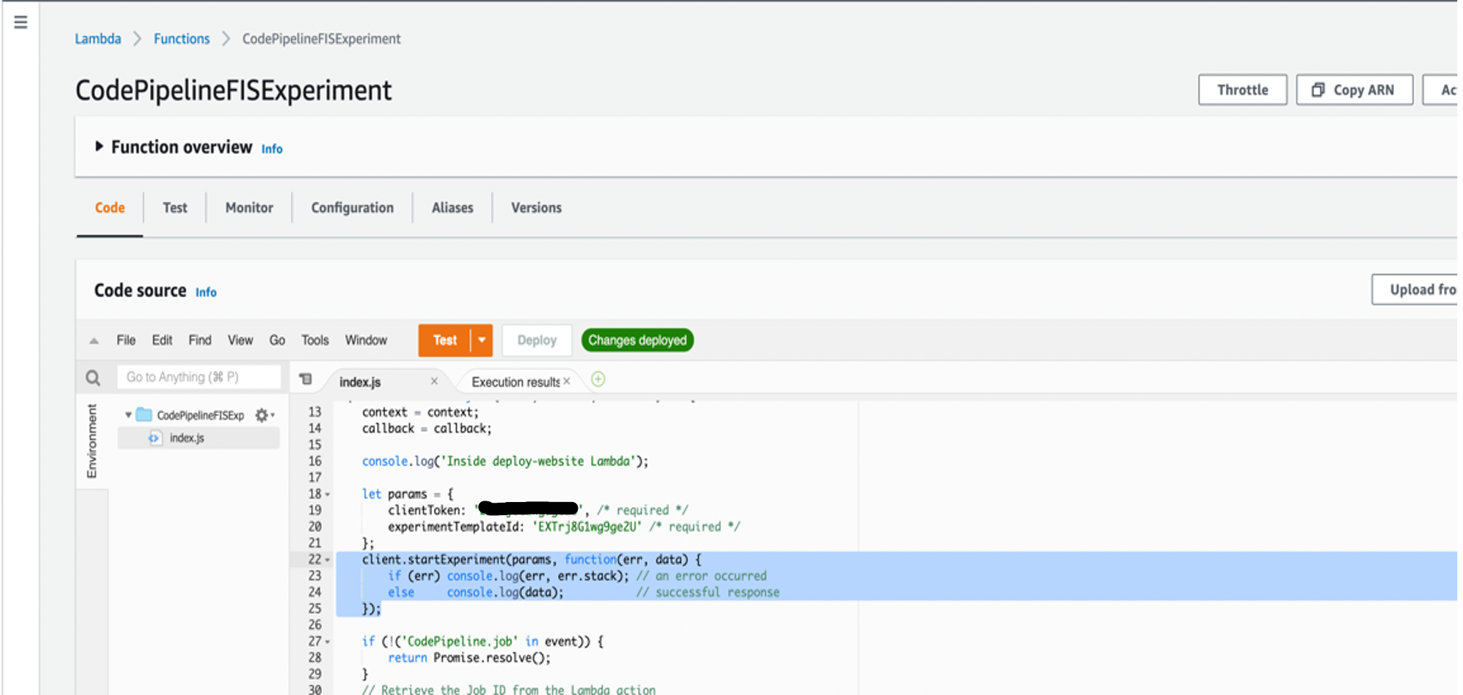
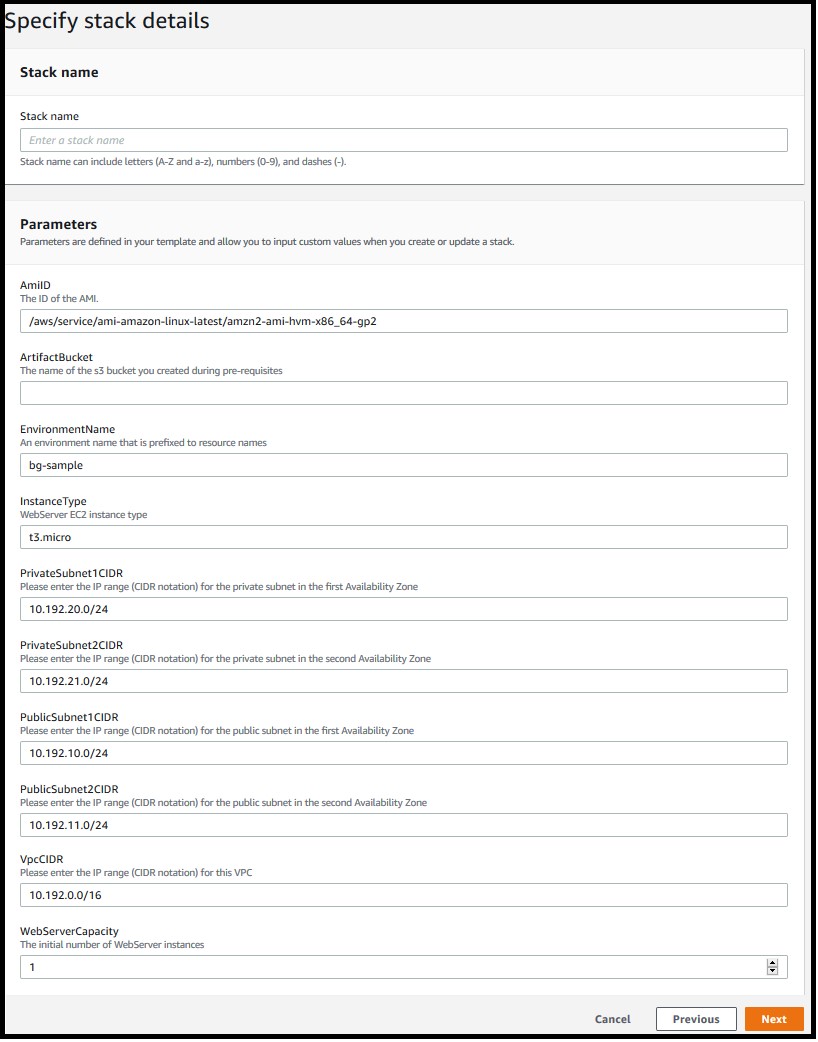
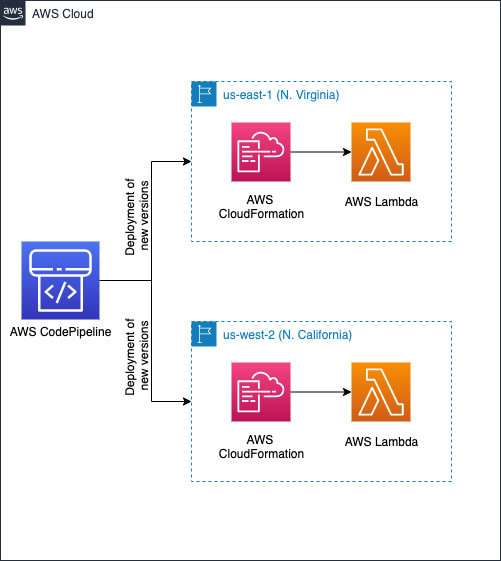
Our deployment database is an Amazon DynamoDB table, with the following structure:

Figure 2: DynamoDB table
- ‘id’ is a unique identifier for each deployment.
- ‘account’ is the AWS account ID for the component resources.
- ‘region’ is the AWS region ID for the component resources.
- ‘type’ is either ‘silo’ or ‘pool’, which defines the deployment model.
This design supports tenant deployment to multiple silo and pool deployments. Each of these can target any available and bootstrapped AWS Account and Region. For example, different pools can support tenants in different regions, with select tenants deployed to dedicated silos. As pools may be limited to how many tenants they can serve, the design also supports having multiple pools within a region, and it can easily be extended with an additional attribute to support the tiers concept.
Note that the deployment database does not contain tenant information. It is expected that such mapping is maintained in a separate tenant database, where each tenant record can map to the ID of the deployment that it is associated with.
Now that we have looked at our solution design and architecture, let’s move to the hands-on section, starting with the deployment requirements for the solution.
Prerequisites
The following tools are required to deploy the solution:
- NodeJS version compatible with AWS CDK version 1.124.0
- The AWS Command Line Interface (AWS CLI)
- Git with git-remote-codecommit extension
To follow this tutorial completely, you should have administrator access to at least one, but preferably two AWS accounts:
- Toolchain: Account for the SDLC toolchain: the pipelines, the provisioning project, the repository, and the deployment database.
- Workload (optional): Account for the component resources.
If you have only a single account, then the toolchain account can be used for both purposes. Credentials for the account(s) are assumed to be configured in AWS CLI profile(s).
The instructions in this post use the following placeholders, which you must replace with your specific values:
- <TOOLCHAIN_ACCOUNT_ID>: The AWS Account ID for the toolchain account
- <TOOLCHAIN_PROFILE_NAME>: The AWS CLI profile name for the toolchain account credentials
- <WORKLOAD_ACCOUNT_ID>: The AWS Account ID for the workload account
- <WORKLOAD_PROFILE_NAME>: The AWS CLI profile name for the workload account credentials
Bootstrapping
The toolchain account, and all workload account(s), must be bootstrapped prior to first-time deployment.
AWS CDK and our solutions’ dependencies must be installed to start with. The easiest way to do this is to install them locally with npm. First, we need to download our sample code, so that the we have the package.json configuration file available for npm.
Note that throughout these instructions, many commands are broken over multiple lines for readability. Take care to execute the commands completely. It is always safe to execute each code block as a whole.
Clone the sample code repository from GitHub, and then install the dependencies by using npm:
git clone https://github.com/aws-samples/aws-saas-parallel-deployments
cd aws-saas-parallel-deployments
npm ci
CDK Pipelines requires use of modern bootstrapping. To ensure that this is enabled, start by setting the related environment variable:
export CDK_NEW_BOOTSTRAP=1Then, bootstrap the toolchain account. You must bootstrap both the region where the toolchain stack is deployed, as well as every target region for component resources. Here, we will first bootstrap only the us-east-1 region, and later you can optionally bootstrap additional region(s).
To bootstrap, we use npx to execute the locally installed version of AWS CDK:
npx cdk bootstrap <TOOLCHAIN_ACCOUNT_ID>/us-east-1 --profile <TOOLCHAIN_PROFILE_NAME>If you have a workload account that is separate from the toolchain account, then that account must also be bootstrapped. When bootstrapping the workload account, we will establish a trust relationship with the toolchain account. Skip this step if you don’t have a separate workload account.
The workload account boostrappings follows the security best practice of least privilege. First create an execution policy with the minimum permissions required to deploy our demo component resources. We provide a sample policy file in the solution repository for this purpose. Then, use that policy as the execution policy for the trust relationship between the toolchain account and the workload account
aws iam create-policy \
  --profile <WORKLOAD_PROFILE_NAME> \
  --policy-name CDK-Exec-Policy \
  --policy-document file://policies/workload-cdk-exec-policy.json
npx cdk bootstrap <WORKLOAD_ACCOUNT_ID>/us-east-1 \
  --profile <WORKLOAD_PROFILE_NAME> \
  --trust <TOOLCHAIN_ACCOUNT_ID> \
  --cloudformation-execution-policies arn:aws:iam::<WORKLOAD_ACCOUNT_ID>:policy/CDK-Exec-Policy
Toolchain deployment
Prior to being able to deploy for the first time, you must create an AWS CodeCommit repository for the solution. Create this repository in the toolchain account:
aws codecommit create-repository \
  --profile <TOOLCHAIN_PROFILE_NAME> \
  --region us-east-1 \
  --repository-name unicorn-repository
Next, you must push the contents to the CodeCommit repository. For this, use the git command together with the git-remote-codecommit extension in order to authenticate to the repository with your AWS CLI credentials. Our pipelines are configured to use the main branch.
git remote add unicorn codecommit::us-east-1://<TOOLCHAIN_PROFILE_NAME>@unicorn-repository
git push unicorn main
Now we are ready to deploy the toolchain stack:
export AWS_REGION=us-east-1
npx cdk deploy --profile <TOOLCHAIN_PROFILE_NAME>
Workload deployments
At this point, our CI/CD pipeline, provisioning project, and deployment database have been created. The database is initially empty.
Note that the DynamoDB command line interface demonstrated below is not intended to be the SaaS providers provisioning interface for production use. SaaS providers typically have online registration portals, wherein the customer signs up for the service. When new deployments are needed, then a record should automatically be inserted into the solution’s deployment database.
To demonstrate the solution’s capabilities, first we will provision two deployments, with an optional third cross-region deployment:
- A silo deployment (silo1) in the us-east-1 region.
- A pool deployment (pool1) in the us-east-1 region.
- A pool deployment (pool2) in the eu-west-1 region (optional).
To start, configure the AWS CLI environment variables:
export AWS_REGION=us-east-1
export AWS_PROFILE=<TOOLCHAIN_PROFILE_NAME>
Add the deployment database records for the first two deployments:
aws dynamodb put-item \
  --table-name unicorn-deployments \
  --item '{
    "id": {"S":"silo1"},
    "type": {"S":"silo"},
    "account": {"S":"<WORKLOAD_ACCOUNT_ID>"},
    "region": {"S":"us-east-1"}
  }'
aws dynamodb put-item \
  --table-name unicorn-deployments \
  --item '{
    "id": {"S":"pool1"},
    "type": {"S":"pool"},
    "account": {"S":"<WORKLOAD_ACCOUNT_ID>"},
    "region": {"S":"us-east-1"}
  }'
This will trigger two parallel builds of the provisioning CodeBuild project. Use the CodeBuild Console in order to observe the status and progress of each build.
Cross-region deployment (optional)
Optionally, also try a cross-region deployment. Skip this part if a cross-region deployment is not relevant for your use case.
First, you must bootstrap the target region in the toolchain and the workload accounts. Bootstrapping of eu-west-1 here is identical to the bootstrapping of the us-east-1 region earlier. First bootstrap the toolchain account:
npx cdk bootstrap <TOOLCHAIN_ACCOUNT_ID>/eu-west-1 --profile <TOOLCHAIN_PROFILE_NAME>If you have a separate workload account, then we must also bootstrap it for the new region. Again, please skip this if you have only a single account:
npx cdk bootstrap <WORKLOAD_ACCOUNT_ID>/eu-west-1 \
  --profile <WORKLOAD_PROFILE_NAME> \
  --trust <TOOLCHAIN_ACCOUNT_ID> \
  --cloudformation-execution-policies arn:aws:iam::<WORKLOAD_ACCOUNT_ID>:policy/CDK-Exec-Policy
Then, add the cross-region deployment:
aws dynamodb put-item \
--table-name unicorn-deployments \
--item '{
"id": {"S":"pool2"},
"type": {"S":"pool"},
"account": {"S":"<WORKLOAD_ACCOUNT_ID>"},
"region": {"S":"eu-west-1"}
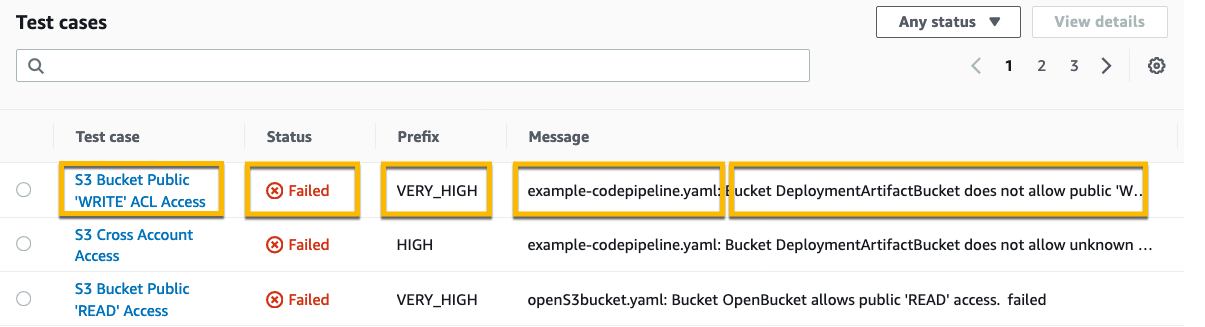
}'Validation of deployments
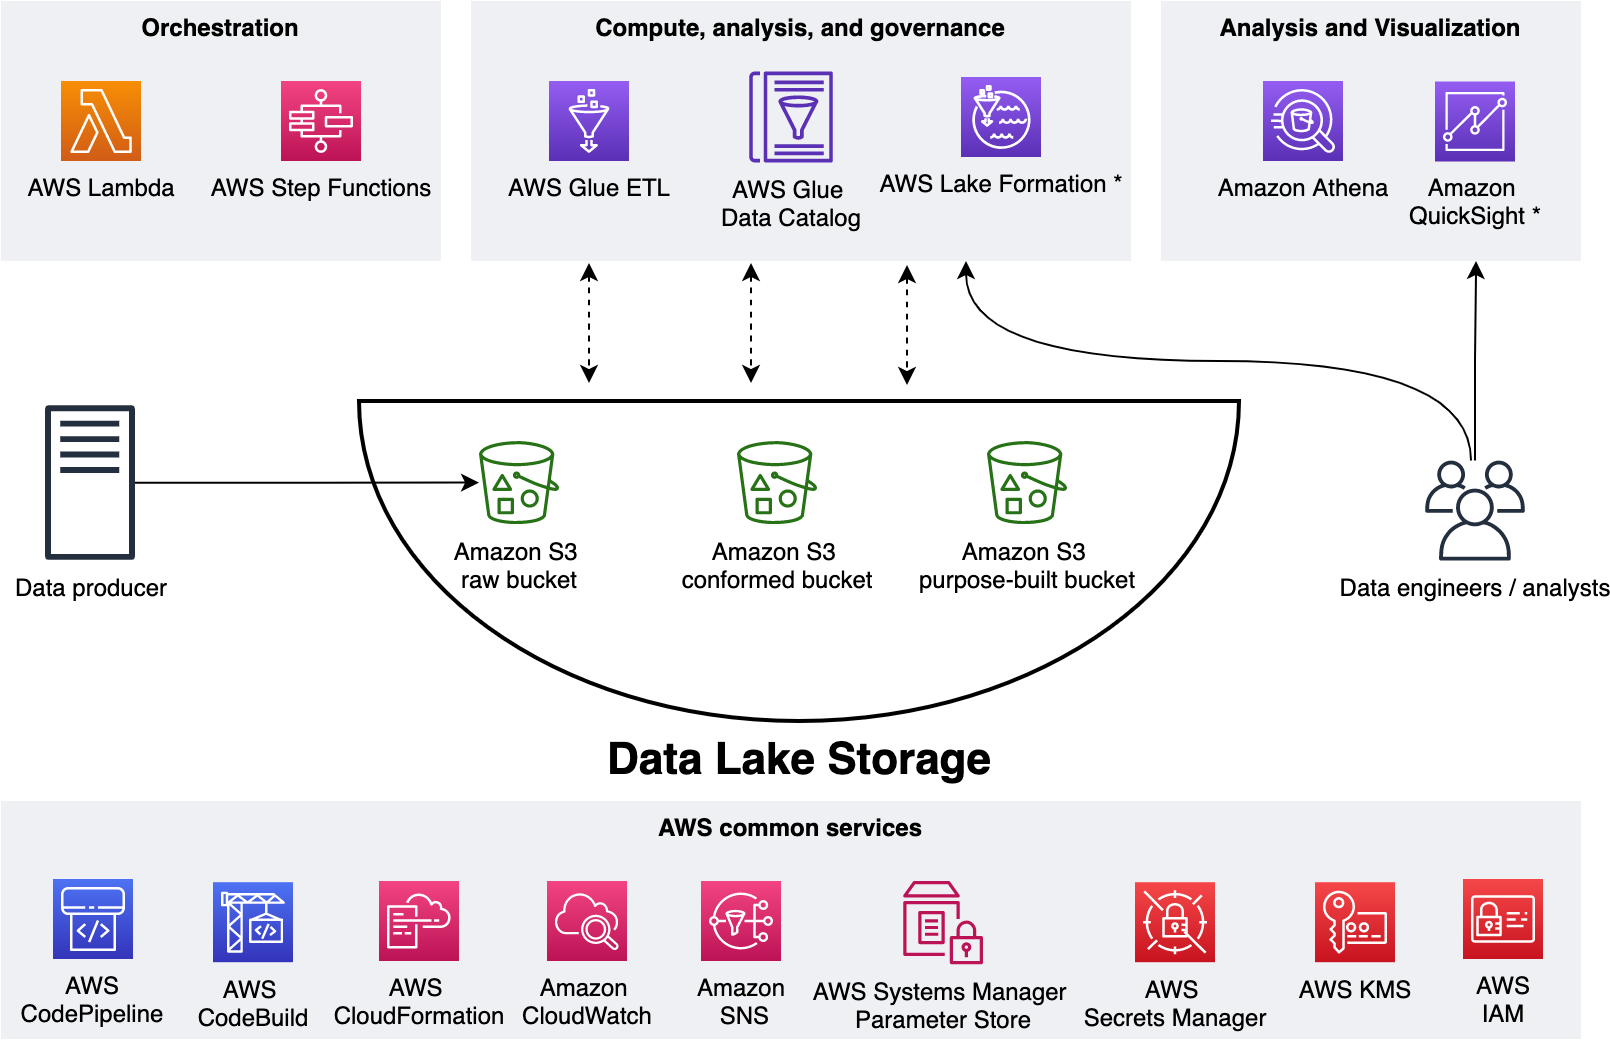
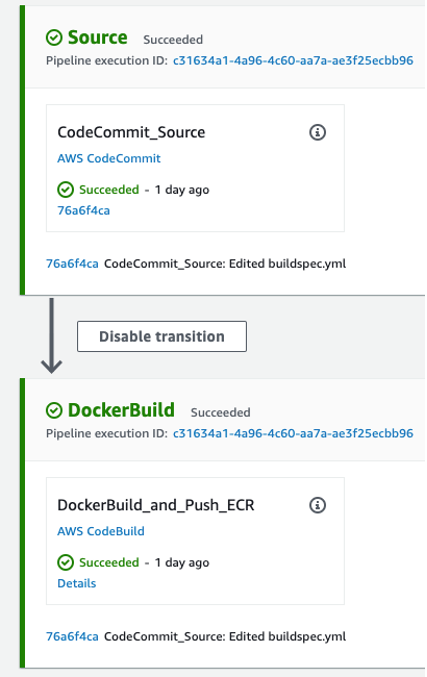
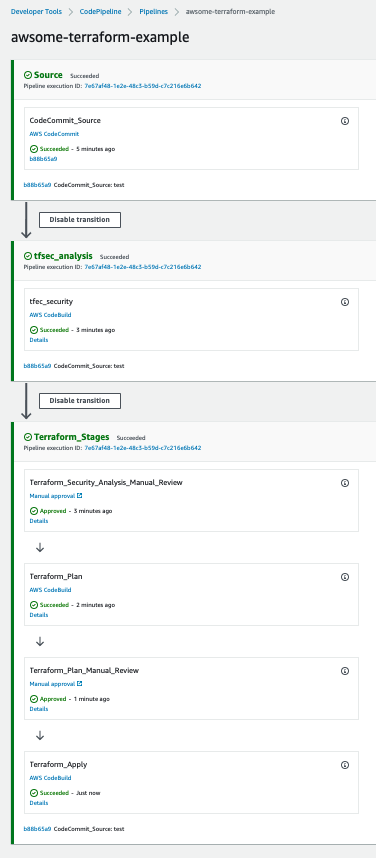
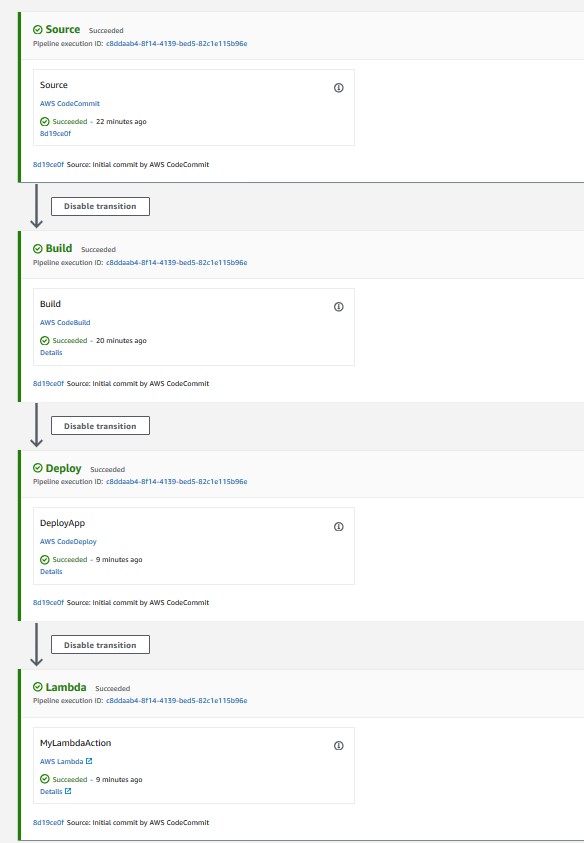
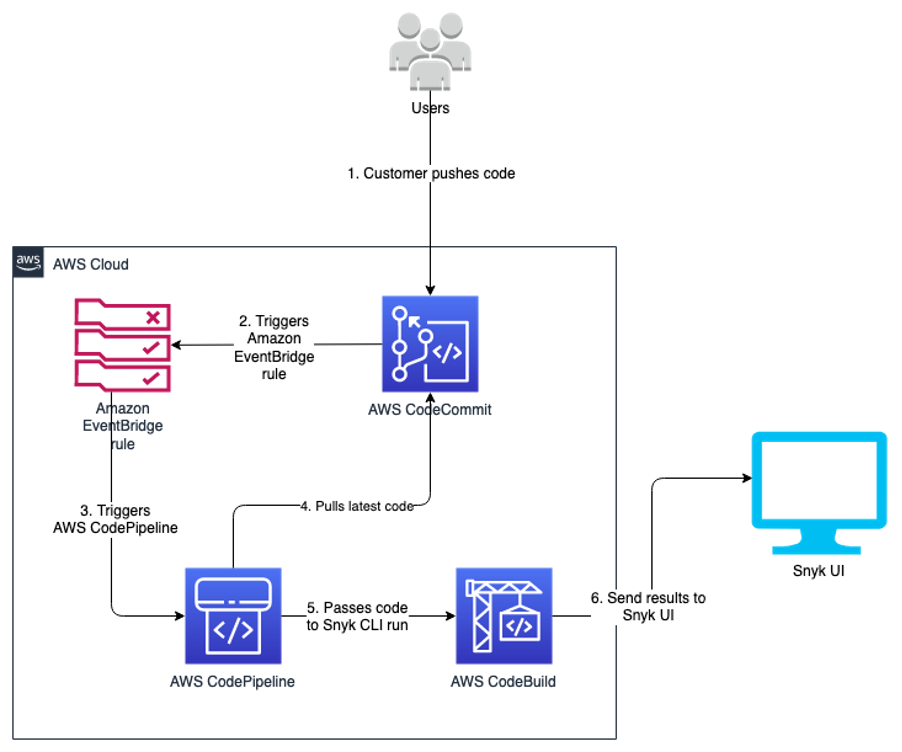
After the builds have completed, use the CodePipeline console to verify that the deployment pipelines were successfully created in the toolchain account:

Figure 3: CodePipeline console
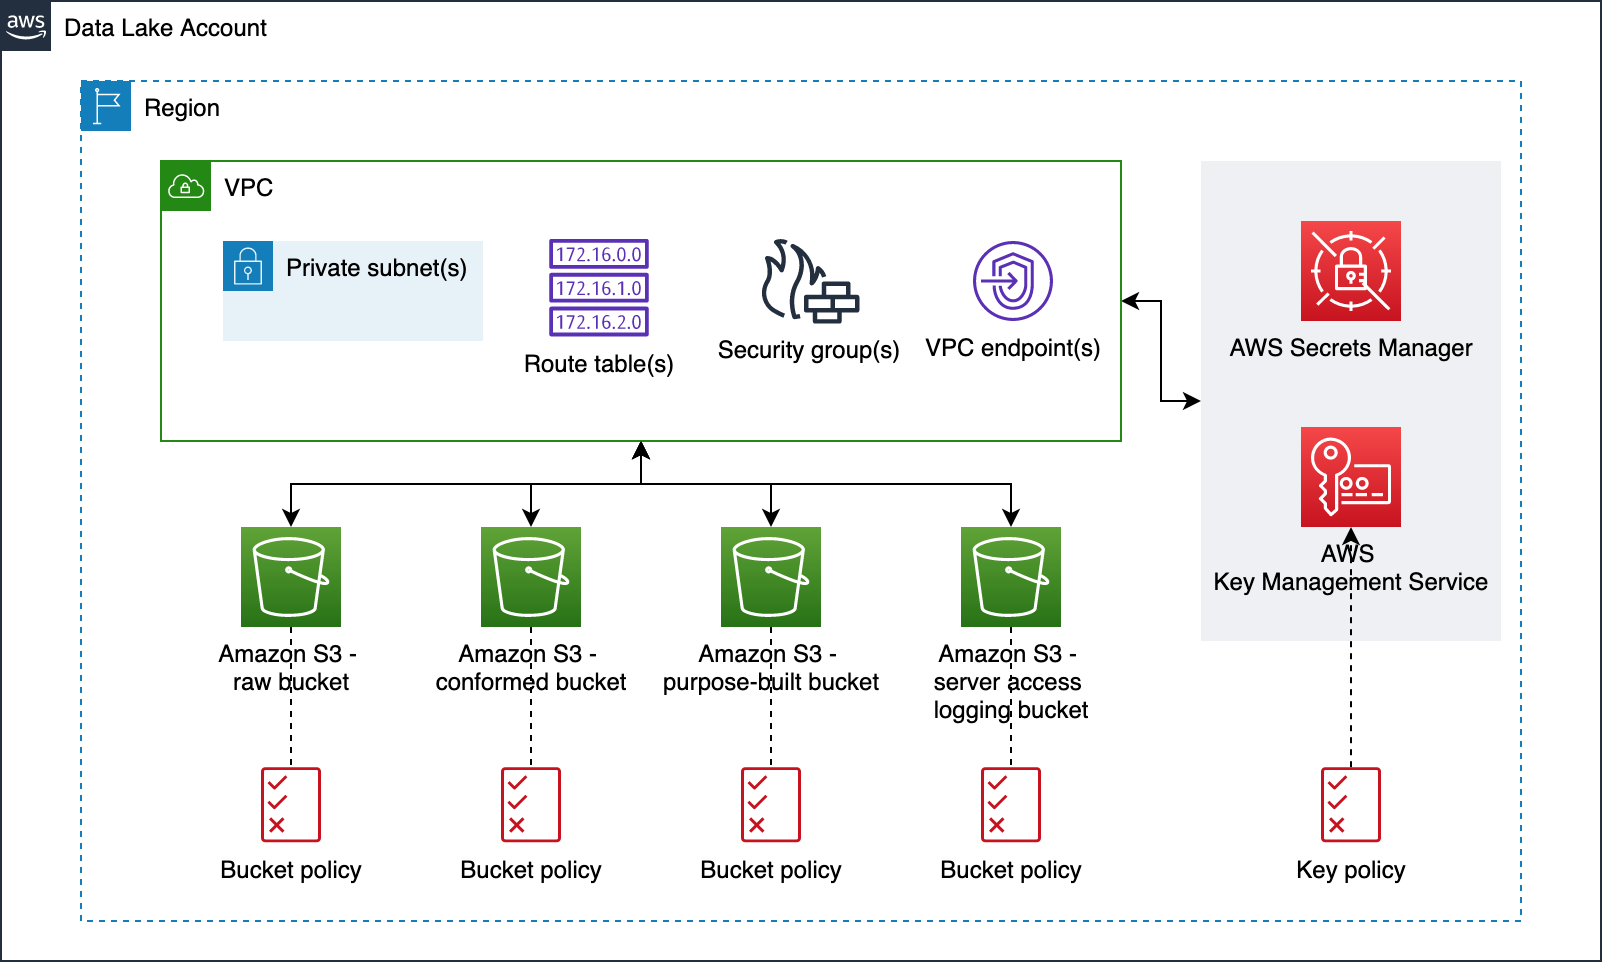
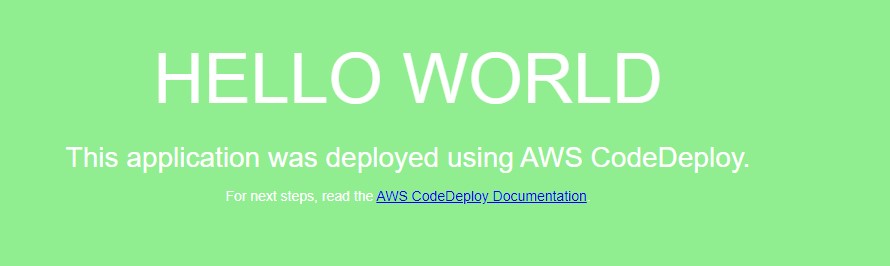
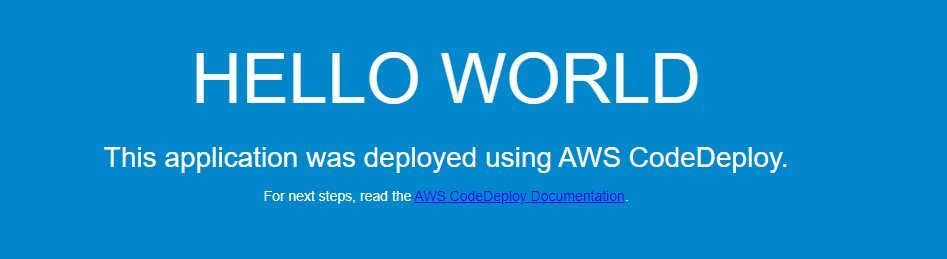
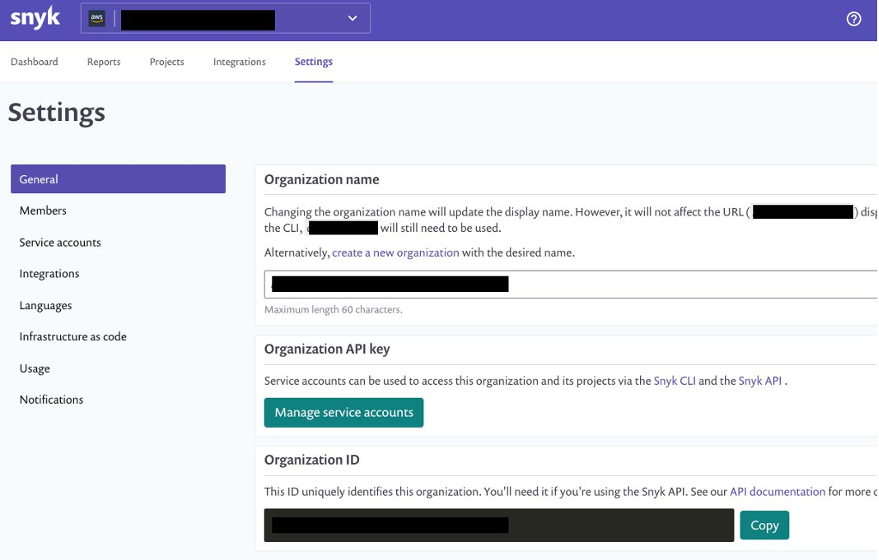
Similarly, in the workload account, stacks containing your component resources will have been deployed to each configured region for the deployments. In this demo, we are deploying a single “hello world” container application utilizing AWS App Runner as runtime environment. Successful deployment can be verified by using CloudFormation Console:

Figure 4: CloudFormation console
Now that we have successfully finished with our demo deployments, let’s look at how updates to the pipelines and the component resources can be managed.
Managing application resources as code
As highlighted earlier in the Solution Overview, every aspect of our solution shares a single source repository. With all of our code in a single source, we can easily deliver complex changes impacting multiple aspects of our solution. And all of this can be packaged, tested, and released as a single change set. For example, a change can introduce a new stage to the CI/CD pipeline, modify an existing stage in the silo and pool pipelines, and/or make code and resource changes to the component resources.
Managing the pipeline definitions is made simple by the self-mutate capability of the CDK Pipelines. Once initially deployed, each CDK Pipelines pipeline can update its own definition. This is implemented by using a separate SelfMutate stage in the pipeline definition. This stage is executed before any deployment actions, thereby ensuring that the pipeline always executes the latest version that is defined by the source code.
Managing how and when the pipelines trigger to execute also required attention. CDK Pipelines configures pipelines by default to utilize event-based polling of the source repository. While this is a reasonable default, and it is great for the CI/CD pipeline, it is undesired for our silo and pool pipelines. If all of these pipelines would execute automatically on code commits to the source repository, the CI/CD pipeline could not manage the release flow. To address this, we have configured the silo and pool pipelines with the trigger in the CodeCommitSourceOptions to NONE.
Controlling deployment updates
A key aspect of SaaS delivery is controlling how you roll out changes to tenants. Significant business risk can arise if changes are released to all tenants all-at-once in a single big bang.
This risk can be managed by utilizing a combination of silo and pool deployments. Reduce your risk by spreading tenants into multiple pools, and gradually rolling out your changes to these pools. Based on business needs and/or risk assessment, select customers can be provisioned into dedicated silo deployments, thereby allowing update control for those customers separately. Note that while all of a pool’s tenants get the same underlying update simultaneously, you can utilize feature flags to selectively enable new features only for specific tenants in the deployment.
In the demo solution, the CI/CD pipeline contains only a single custom stage “UpdateDeployments”. This CodeBuild action implements a simple “one-at-a-time” strategy. The code has been purposely written so that it is simple and provides you with a starting point to implement your own more complex strategy, as based on your unique business needs. In the default implementation, every silo and pool pipeline tracks the same “main” branch of the repository. Releases are governed by controlling when each pipeline executes to update its resources.
When designing your release strategy, look into how the planned process helps implement releases and changes with high quality and frequency. A typical starting point is a CI/CD pipeline with continuous automated deployments via multiple test and staging environments in order to validate your changes prior to deployment to any production tenants.
Furthermore, consider if utilizing a canary release strategy would help identify potential issues with your changes prior to rolling them out across all deployments in production. In a canary release, each change is first deployed only to a small subset of your deployments. Once you are satisfied with the change quality, then the change can either automatically or manually be released to the rest of your deployments. As an example, an AWS Step Functions state machine could be combined with the solution, and then utilized to control the release flow, execute validation tests, implement approval steps (either manual or automatic), and even conduct rollback if necessary.
Further considerations
The example in this post provisions every silo and pool deployment to a single AWS account. However, the solution is not limited to a single account, and it can deploy equally easily to multiple AWS accounts. When operating at scale, it is best-practice to spread your workloads to several accounts. The Organizing Your AWS Environment using Multiple Accounts whitepaper has in-depth guidance on strategies for spreading your workloads.
If combined with an AWS account-vending machine implementation, such as an AWS Control Tower Landing Zone, then the demo solution could be adapted so that new AWS accounts are provisioned automatically. This would be useful if your business requires full account-level deployment isolation, and you also want automated provisioning.
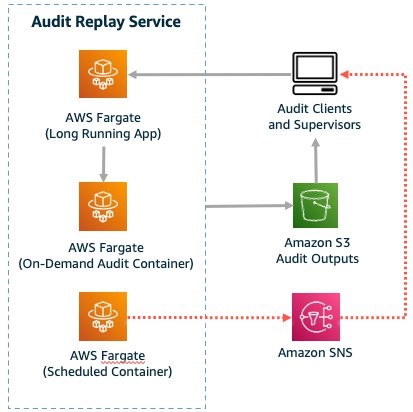
To meet Unicorn’s future needs for spreading their solution architecture over multiple separate components, the deployment database and associated lambda function could be decoupled from the rest of the toolchain components in order to provide a central deployment service. When provisioned as standalone, and amended with Amazon Simple Notification Service-based notifications sent to the component deployment systems for example, this central deployment service could be utilized for managing the deployments for multiple components.
In addition, you should analyze your deployment lifecycle transitions, and then consider what action should be taken when a tenant is disabled and/or deleted. Implementing a deployment archival/deletion process is not in the scope of this post.
Cleanup
To cleanup every resource deployed in this post, conduct the following actions:
- In the workload account:
- In us-east-1 Region, delete CloudFormation stacks named “pool-pool1-resources” and “silo-silo1-resources” and the CDK bootstrap stack “CDKToolKit”.
- In eu-west-1 Region, delete CloudFormation stack named “pool-pool2-resources” and the CDK Bootstrap stack “CDKToolKit”
- In the toolchain account:
- In us-east-1 Region, delete CloudFormation stacks “toolchain”, “pool-pool1-pipeline”, “pool-pool2-pipeline”, “silo-silo1-pipeline” and the CDK bootstrap stack “CDKToolKit”.
- In eu-west-1 Region, delete CloudFormation stack “pool-pool2-pipeline-support-eu-west-1” and the CDK bootstrap stack “CDKToolKit”
- Cleanup and delete S3 buckets “toolchain-*”, “pool-pool1-pipeline-*”, “pool-pool2-pipeline-*”, and “silo-silo1-pipeline-*”.
Conclusion
This solution demonstrated an implementation of an automated SaaS application component deployment factory. We covered how an ISV venturing into the SaaS model can utilize AWS CDK and CDK Pipelines in order to avoid a multitude of undifferentiated heavy lifting by leveraging and combining AWS CDK’s cross-region and cross-account capabilities with CDK Pipelines’ self-mutating deployment pipelines. Furthermore, we demonstrated how all of this can be written, managed, and released just like any other code you write. We also demonstrated how a single dynamic provisioning system can be utilized to operate in a mixed mode, with both silo and pool deployments.
Visit the AWS SaaS Factory Program page for further information on how AWS can help you on your SaaS journey — regardless of the stage you are currently in.


 Rakesh Singh


 Srinivas Manepalli is a DevSecOps Solutions Architect in the U.S. Fed SI SA team at Amazon Web Services (AWS). He is passionate about helping customers, building and architecting DevSecOps and highly available software systems. Outside of work, he enjoys spending time with family, nature and good food.
 Mike is a Principal Solutions Architect with the Startup Team at Amazon Web Services. He is a former founder, current mentor, and enjoys helping startups live their best cloud life.
 Sean is a Senior Startup Solutions Architect at AWS. Before AWS, he was Director of Scientific Computing at the Howard Hughes Medical Institute.