In April 2021, AWS Identity and Access Management (IAM)Access Analyzer added policy generation to help you create fine-grained policies based on AWS CloudTrail activity stored within your account. Now, we’re extending policy generation to enable you to generate policies based on access activity stored in a designated account. For example, you can use AWS Organizations to define a uniform event logging strategy for your organization and store all CloudTrail logs in your management account to streamline governance activities. You can use Access Analyzer to review access activity stored in your designated account and generate a fine-grained IAM policy in your member accounts. This helps you to create policies that provide only the required permissions for your workloads.
Customers that use a multi-account strategy consolidate all access activity information in a designated account to simplify monitoring activities. By using AWS Organizations, you can create a trail that will log events for all Amazon Web Services (AWS) accounts into a single management account to help streamline governance activities. This is sometimes referred to as an organization trail. You can learn more from Creating a trail for an organization. With this launch, you can use Access Analyzer to generate fine-grained policies in your member account and grant just the required permissions to your IAM roles and users based on access activity stored in your organization trail.
When you request a policy, Access Analyzer analyzes your activity in CloudTrail logs and generates a policy based on that activity. The generated policy grants only the required permissions for your workloads and makes it easier for you to implement least privilege permissions. In this blog post, I’ll explain how to set up the permissions for Access Analyzer to access your organization trail and analyze activity to generate a policy. To generate a policy in your member account, you need to grant Access Analyzer limited cross-account access to access the Amazon Simple Storage Service (Amazon S3) bucket where logs are stored and review access activity.
Generate a policy for a role based on its access activity in the organization trail
In this example, you will set fine-grained permissions for a role used in a development account. The example assumes that your company uses Organizations and maintains an organization trail that logs all events for all AWS accounts in the organization. The logs are stored in an S3 bucket in the management account. You can use Access Analyzer to generate a policy based on the actions required by the role. To use Access Analyzer, you must first update the permissions on the S3 bucket where the CloudTrail logs are stored, to grant access to Access Analyzer.
To grant permissions for Access Analyzer to access and review centrally stored logs and generate policies
Select the bucket where the logs from the organization trail are stored.
Change object ownership to bucket owner preferred. To generate a policy, all of the objects in the bucket must be owned by the bucket owner.
Update the bucket policy to grant cross-account access to Access Analyzer by adding the following statement to the bucket policy. This grants Access Analyzer limited access to the CloudTrail data. Replace the <organization-bucket-name>, and <organization-id> with your values and then save the policy.
By using the preceding statement, you’re allowing listbucket and getobject for the bucket my-organization-bucket-name if the role accessing it belongs to an account in your Organizations and has a name that starts with AccessAnalyzerMonitorServiceRole. Using aws:PrincipalAccount in the resource section of the statement allows the role to retrieve only the CloudTrail logs belonging to its own account. If you are encrypting your logs, update your AWS Key Management Service (AWS KMS) key policy to grant Access Analyzer access to use your key.
Now that you’ve set the required permissions, you can use the development account and the following steps to generate a policy.
To generate a policy in the AWS Management Console
Use your development account to open the IAM Console, and then in the navigation pane choose Roles.
Select a role to analyze. This example uses AWS_Test_Role.
Under Generate policy based on CloudTrail events, choose Generate policy, as shown in Figure 1.
Figure 1: Generate policy from the role detail page
In the Generate policy page, select the time window for which IAM Access Analyzer will review the CloudTrail logs to create the policy. In this example, specific dates are chosen, as shown in Figure 2.
Figure 2: Specify the time period
Under CloudTrail access, select the organization trail you want to use as shown in Figure 3.
Note: If you’re using this feature for the first time: select create a new service role, and then choose Generate policy.
This example uses an existing service role “AccessAnalyzerMonitorServiceRole_MBYF6V8AIK.”
Figure 3: CloudTrail access
After the policy is ready, you’ll see a notification on the role page. To review the permissions, choose View generated policy, as shown in Figure 4.
Figure 4: Policy generation progress
After the policy is generated, you can see a summary of the services and associated actions in the generated policy. You can customize it by reviewing the services used and selecting additional required actions from the drop down. To refine permissions further, you can replace the resource-level placeholders in the policies to restrict permissions to just the required access. You can learn more about granting fine-grained permissions and creating the policy as described in this blog post.
Conclusion
Access Analyzer makes it easier to grant fine-grained permissions to your IAM roles and users by generating IAM policies based on the CloudTrail activity centrally stored in a designated account such as your AWS Organizations management accounts. To learn more about how to generate a policy, see Generate policies based on access activity in the IAM User Guide.
If you have feedback about this blog post, submit comments in the Comments section below. If you have questions about this blog post, start a new thread on the IAM forum or contact AWS Support.
Want more AWS Security how-to content, news, and feature announcements? Follow us on Twitter.
Many organizations today require their systems to be compliant with the CIS (Center for Internet Security) Benchmarks. Enterprises have adopted the guidelines or benchmarks drawn by CIS to maintain secure systems. Creating secure Linux or Windows Server images on the cloud and on-premises can involve manual update processes or require teams to build automation scripts to maintain images. This blog post details the process of automating the creation of CIS compliant Windows images using EC2 Image Builder.
EC2 Image Builder simplifies the building, testing, and deployment of Virtual Machine and container images for use on AWS or on-premises. Keeping Virtual Machine and container images up-to-date can be time consuming, resource intensive, and error-prone. Currently, customers either manually update and snapshot VMs or have teams that build automation scripts to maintain images. EC2 Image Builder significantly reduces the effort of keeping images up-to-date and secure by providing a simple graphical interface, built-in automation, and AWS-provided security settings. With Image Builder, there are no manual steps for updating an image nor do you have to build your own automation pipeline. EC2 Image Builder is offered at no cost, other than the cost of the underlying AWS resources used to create, store, and share the images.
Hardening is the process of applying security policies to a system and thereby, an Amazon Machine Image (AMI) with the CIS security policies in place would be a CIS hardened AMI. CIS benchmarks are a published set of recommendations that describe the security policies required to be CIS-compliant. They cover a wide range of platforms including Windows Server and Linux. For example, a few recommendations in a Windows Server environment are to:
Have a password requirement and rotation policy.
Set an idle timer to lock the instance if there is no activity.
Prevent guest users from using Remote Desktop Protocol (RDP) to access the instance.
While Deploying CIS L1 hardened AMIs with EC2 Image Builder discusses about Linux AMIs, this blog post demonstrates how EC2 Image Builder can be used to publish hardened Windows 2019 AMIs. This solutions uses the following AWS services:
EC2 Image Builder provides all the necessary resources needed for publishing AMIs and that involves –
Creating a pipeline by providing details such as a name, description, tags, and a schedule to run automated builds.
Creating a recipe by providing a name and version, select a source operating system image, and choose components to add for building and testing. Components are the building blocks that are consumed by an image recipe or a container recipe. For example, packages for installation, security hardening steps, and tests. The selected source operating system image and components make up an image recipe.
Defining infrastructure configuration – Image Builder launches Amazon EC2 instances in your account to customize images and run validation tests. The Infrastructure configuration settings specify infrastructure details for the instances that will run in your AWS account during the build process.
After the build is complete and has passed all its tests, the pipeline automatically distributes the developed AMIs to the select AWS accounts and regions as defined in the distribution configuration. More details on creating an Image Builder pipeline using the AWS console wizard can be found here.
Solution Overview and prerequisites
The objective of this pipeline is to publish CIS L1 compliant Windows 2019 AMIs and this is achieved by applying a Windows Group Policy Object(GPO) stored in an Amazon S3 bucket for creating the hardened AMIs. The workflow includes the following steps:
Download and modify the CIS Microsoft Windows Server 2019 Benchmark Build Kit available on the Center for Internet Security website. Note: Access to the benchmarks on the CIS site requires a paid subscription.
Upload the modified GPO file to an S3 bucket in an AWS account.
Create a custom Image Builder component by referencing the GPO file uploaded to the S3 bucket.
Create an IAM Instance Profile that the
Launch the EC2 Image Builder pipeline for publishing CIS L1 hardened Windows 2019 AMIs.
Make sure to have these prerequisites checked before getting started:
An AWS account for hosting the S3 bucket and the EC2 Image Builder Pipeline. We use the S3 bucket named image-builder-assets for demonstration purposes in this blog post. Refer to the create an S3 bucket page for more details on creating an S3 buckets.
Now that you have the prerequisites met, let’s begin with modifying the downloaded GPO file.
Creating the GPO File
This step involves modifying two files, registry.pol and GptTmpl.inf
On your workstation, create a folder of your choice, lets say C:\Utils
Move both the CIS Benchmark build kit and the LGPO utility to C:\Utils
Unzip the benchmark file to C:\Utils\Server2019v1.1.0. You should find the following folder structure in the benchmark build kit.
To make the GPO file work with AWS EC2 instances, you need to change the GPO file to prevent it from applying the following CIS recommendations mentioned in the below table and execute the commands mentioned below the table for getting there:
Benchmark rule #
Recommendation
Value to be configured
Reason
2.2.21 (L1)
Configure ‘Deny Access to this computer from the network’
Guests
Does not include ‘Local account and member of Administrators group’ to allow for remote login.
2.2.26 (L1)
Ensure ‘Deny log on through Remote Desktop Services’ is set to include ‘Guests, Local account’
Guests
Does not include ‘Local account’ to allow for RDP login.
2.3.1.1 (L1)
Ensure ‘Accounts: Administrator account status’ is set to ‘Disabled’
Not Configured
Administrator account remains enabled in support of allowing login to the instance after launch.
2.3.1.5 (L1)
Ensure ‘Accounts: Rename administrator account’ is configured
Not Configured
We have retained “Administrator” as the default administrative account for the sake of provisioning scripts that may not have knowledge of “CISAdmin” as defined in the CIS remediation kit.
2.3.1.6 (L1)
Configure ‘Accounts: Rename guest account’
Not Configured
Sysprep process renames this account to default of ‘Guest’.
2.3.7.4
Interactive logon: Message text for users attempting to log on
Not Configured
This recommendation is not configured as it causes issues with AWS Scanner.
2.3.7.5
Interactive logon: Message title for users attempting to log on
Not Configured
This recommendation is not configured as it causes issues with AWS Scanner.
9.3.5 (L1)
Ensure ‘Windows Firewall: Public: Settings: Apply local firewall rules’ is set to ‘No’
Not Configured
This recommendation is not configured as it causes issues with RDP.
9.3.6 (L1)
Ensure ‘Windows Firewall: Public: Settings: Apply local connection security rules’
Not Configured
This recommendation is not configured as it causes issues with RDP.
18.2.1 (L1)
Ensure LAPS AdmPwd GPO Extension / CSE is installed (MS only)
Not Configured
LAPS is not configured by default in the AWS environment.
18.9.58.3.9.1 (L1)
Ensure ‘Always prompt for password upon connection’ is set to ‘Enabled’
Not Configured
This recommendation is not configured as it causes issues with RDP.
Parse the policy file located inside MS-L1\{6B8FB17A-45D6-456D-9099-EB04F0100DE2}\DomainSysvol\GPO\Machine\registry.pol into a text file using the command:
Copy the newly generated registry.pol file from C:\Utils\ to C:\Utils\Server2019v1.1.0\MS-L1\DomainSysvol\GPO\Machine\. Note:This will replace the existing registry.pol file.
Next, open C:\Utils\Server2019v1.1.0\MS-L1\DomainSysvol\GPO\Machine\microsoft\windows nt\SecEdit\GptTmpl.inf using Notepad.
Under the [System Access] section, delete the following lines:
Under the section [Registry Values], remove the following two lines:
MACHINE\Software\Microsoft\Windows\CurrentVersion\Policies\System\LegalNoticeCaption=1,"ADD TEXT HERE" MACHINE\Software\Microsoft\Windows\CurrentVersion\Policies\System\LegalNoticeText=7,ADD TEXT HERE
Save the C:\Utils\Server2019v1.1.0\MS-L1\DomainSysvol\GPO\Machine\microsoft\windows nt\SecEdit\GptTmpl.inf file.
Rename the root folder C:\Utils\Server2019v1.1.0 to a simpler name like C:\Utilis\gpos
Compress both the C:\Utilis\gpos folder along with the C:\Utils\LGPO.exe file and name it as C:\Utilis\cisbuild.zip and upload it to the image-builder-assets S3 bucket.
Create Build Component
Next step for us is to develop the build component file that details what gets to be installed on the AMI that will be created at the end of the process. For example, you can use the component definition for installing external tools like Python. To build a component, you must provide a YAML-based document, which represents the phases and steps to create the component. Create the CISL1Component following the below steps:
Login to the AWS Console and open the EC2 Image Builder dashboard.
Click on Components in the left pane.
Click on Create Component.
Choose Windows for Image Operating System (OS).
Type a name for the Component, in this case, we will name it as CIS-Windows-2019-Build-Component.
Type in a component version. Since it is the first version, we will choose 1.0.0
Optionally, under KMS keys, if you have a custom KMS key to encrypt the image, you can choose that or leave as default.
Type in a meaningful description.
Under Definition Document, choose “Define document content” and paste the following YAML code:
name: CISLevel1Build description: Build Component to build a CIS Level 1 Image along with additional libraries schemaVersion: 1.0
The above template has a build phase with the following steps:
DownloadUtilities – Executes a command to create a directory (C:\Utils) and another command to download Python from the internet and save it in the created directory as python.exe. Both are executed in PowerShell.
BuildKitDownload – Downloads the GPO archive created in the previous section from the bucket we stored it in.
InstallPython – Installs Python in the system using the executable downloaded in the first step.
InstallGPO – Installs the GPO files we prepared from the previous section to apply the CIS security policies. In this example, we are creating a Level 1 CIS hardened AMI.
Note: In order to create a Level 2 CIS hardened AMIs, you need to apply User-L1, User-L2, MS-L1, MS-L2 GPOs.
To apply the policy, we use the LGPO.exe tool and run the following command: LGPO.exe /g "Path\of\GPO\directory"
As an example, to apply the MS-L1 GPO, the command would be as follows: LGPO.exe /g "C:\Utils\gpos\MS-L1\DomainSysvol"
The last command opens the 5985 port in the firewall to allow AWS Scanner inbound connection. This is a CIS recommendation.
RebootStep – Reboots the instance after applying the security policies. A reboot is necessary to apply the policies.
Note: If you need to run any tests/validation you need to include another phase to run the test scripts. Guidelines on that can be found here.
Create an instance profile role for the Image Pipeline
Image Builder launches Amazon EC2 instances in your account to customize images and run validation tests. The Infrastructure configuration settings specify infrastructure details for the instances that will run in your AWS account during the build process. In this step, you will create an IAM Role to attach to the instance that the Image Pipeline will use to create an image. Create the IAM Instance Profile following the below steps:
Open the AWS Identity and Access Management (AWS IAM) console and click on Roles on the left pane.
Click on Create Role.
Choose AWS service for trusted entity and choose EC2 and click Next.
Attach the following policies: AmazonEC2RoleforSSM, AmazonS3ReadOnlyAccess, EC2InstanceProfileForImageBuilder and click Next.
Optionally, add tags and click Next
Give the role a name and description and review if all the required policies are attached. In this case, we will name the IAM Instance Profile as CIS-Windows-2019-Instance-Profile
Click Create role.
Create Image Builder Pipeline
In this step, you create the image pipeline which will produce the desired AMI as an output. Image Builder image pipelines provide an automation framework for creating and maintaining custom AMIs and container images. Pipelines deliver the following functionality:
Assemble the source image, components for building and testing, infrastructure configuration, and distribution settings.
Facilitate scheduling for automated maintenance processes using the Schedule builder in the console wizard, or entering cron expressions for recurring updates to your images.
Enable change detection for the source image and components, to automatically skip scheduled builds when there are no changes.
To create an Image Builder pipeline, perform the following steps:
Open the EC2 Image Builder console and choose create Image Pipeline.
Select Windows for the Image Operating System.
Under Select Image, choose Select Managed Images and browse for the latest Windows Server 2019 English Full Base x86 image.
Under Build components, choose the Build component CIS-Windows-2019-Build-Component created in the previous section.
Optionally, under Tests, if you have a test component created, you can select that.
Click Next.
Under Pipeline details, give the pipeline a name and a description. For IAM role, select the role CIS-Windows-2019-Instance-Profile that was created in the previous section.
Under Build Schedule, you can choose how frequently you want to create an image through this pipeline based on an update schedule. You can select Manual for now.
(Optional) Under Infrastructure Settings, select an instance type to customize your image for that type, an Amazon SNS topic to get alerts from as well as Amazon VPC settings. If you would like to troubleshoot in case the pipeline faces any errors, you can uncheck “Terminate Instance on failure” and choose an EC2 Key Pair to access the instance via Remote Desktop Protocol (RDP). You may wish to store the Logs in an S3 bucket as well. Note: Make sure the chosen VPC has outbound access to the internet in case you are downloading anything from the web as part of the custom component definition.
Click Next.
Under Configure additional settings, you can optionally choose to attach any licenses that you own through AWS License Manager to the AMI.
Under Output AMI, give a name and optional tags.
Under AMI distribution settings, choose the regions or AWS accounts you want to distribute the image to. By default, your current region is included. Click on Review.
Review the details and click Create Pipeline.
Since we have chosen Manual under the Build Schedule, manually trigger the Image Builder pipeline for kicking off the AMI creation process. On successful run, Image Builder pipeline will create the image and the output image can be found under Images on the left pane of the EC2 Image Builder console.
To troubleshoot any issues, the reasons for failure can be found by clicking on the Image Pipeline you created and view the corresponding output image with the Status as Failed.
Cleanup
Following the above detailed step-by-step process creates EC2 Image Builder Pipeline, Custom Component and an IAM Instance Profile. While none of these resources have any costs associated with them, you are charged for the runtime of the EC2 instance used during the AMI built process and the EBS volume costs associated with the size of the AMI. Make sure to clear the AMIs when not needed for avoiding any unwanted costs.
Conclusion
This blog post demonstrated how you can use EC2 Image Builder to create a CIS L1 hardened Windows 2019 Image in an automated fashion. Additionally, this post also demonstrated on how you can use build components to install any dependencies or executables from different sources like the internet or from an Amazon S3 bucket. Feel free to test this solution in your AWS accounts and provide feedback.
In this blog post, I demonstrate how to implement service-to-service authorization using OAuth 2.0 access tokens for microservice APIs hosted on Amazon Elastic Kubernetes Service (Amazon EKS). A common use case for OAuth 2.0 access tokens is to facilitate user authorization to a public facing application. Access tokens can also be used to identify and authorize programmatic access to services with a system identity instead of a user identity. In service-to-service authorization, OAuth 2.0 access tokens can be used to help protect your microservice API for the entire development lifecycle and for every application layer. AWS Well Architected recommends that you validate security at all layers, and by incorporating access tokens validated by the microservice, you can minimize the potential impact if your application gateway allows unintended access. The solution sample application in this post includes access token security at the outset. Access tokens are validated in unit tests, local deployment, and remote cluster deployment on Amazon EKS. Amazon Cognito is used as the OAuth 2.0 token issuer.
Benefits of using access token security with microservice APIs
Some of the reasons you should consider using access token security with microservices include the following:
Access tokens provide production grade security for microservices in non-production environments, and are designed to ensure consistent authentication and authorization and protect the application developer from changes to security controls at a cluster level.
They enable service-to-service applications to identify the caller and their permissions.
Access tokens are short-lived credentials that expire, which makes them preferable to traditional API gateway long-lived API keys.
You get better system integration with a web or mobile interface, or application gateway, when you include token validation in the microservice at the outset.
Overview of solution
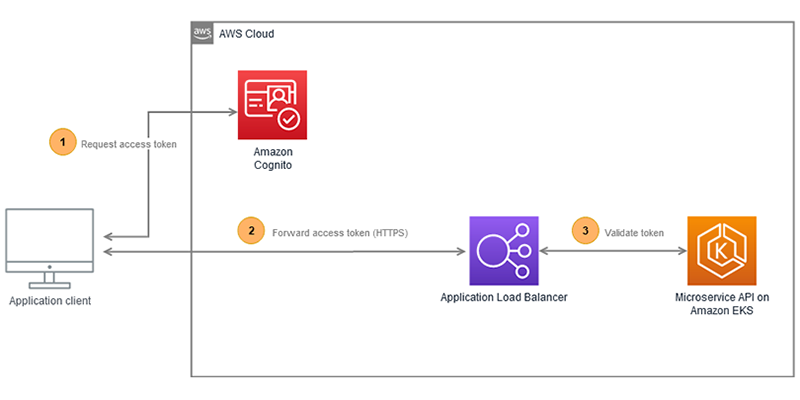
In the solution described in this post, the sample microservice API is deployed to Amazon EKS, with an Application Load Balancer (ALB) for incoming traffic. Figure 1 shows the application architecture on Amazon Web Services (AWS).
Figure 1: Application architecture
The application client shown in Figure 1 represents a service-to-service workflow on Amazon EKS, and shows the following three steps:
The application client requests an access token from the Amazon Cognito user pool token endpoint.
The access token is forwarded to the ALB endpoint over HTTPS when requesting the microservice API, in the bearer token authorization header. The ALB is configured to use IP Classless Inter-Domain Routing (CIDR) range filtering.
The microservice deployed to Amazon EKS validates the access token using JSON Web Key Sets (JWKS), and enforces the authorization claims.
Walkthrough
The walkthrough in this post has the following steps:
Amazon EKS cluster setup
Amazon Cognito configuration
Microservice OAuth 2.0 integration
Unit test the access token claims
Deployment of microservice on Amazon EKS
Integration tests for local and remote deployments
Prerequisites
For this walkthrough, you should have the following prerequisites in place:
A basic familiarity with Kotlin or Java, and frameworks such as Quarkus or Spring
A Unix terminal
Set up
Amazon EKS is the target for your microservices deployment in the sample application. Use the following steps to create an EKS cluster. If you already have an EKS cluster, you can skip to the next section: To set up the AWS Load Balancer Controller. The following example creates an EKS cluster in the Asia Pacific (Singapore) ap-southeast-1 AWS Region. Be sure to update the Region to use your value.
To create an EKS cluster with eksctl
In your Unix editor, create a file named eks-cluster-config.yaml, with the following cluster configuration:
Create the cluster by using the following eksctl command:
eksctl create cluster -f eks-cluster-config.yaml
Allow 10–15 minutes for the EKS control plane and managed nodes creation. eksctl will automatically add the cluster details in your kubeconfig for use with kubectl.
Validate your cluster node status as “ready” with the following command
kubectl get nodes
Create the demo namespace to host the sample application by using the following command:
kubectl create namespace demo
With the EKS cluster now up and running, there is one final setup step. The ALB for inbound HTTPS traffic is created by the AWS Load Balancer Controller directly from the EKS cluster using a Kubernetes Ingress resource.
To set up the AWS Load Balancer Controller
Follow the installation steps to deploy the AWS Load Balancer Controller to Amazon EKS.
An Ingress resource defines the ALB configuration. You customize the ALB by using annotations. Create a file named alb.yml, and add resource definition as follows, replacing the inbound IP CIDR with your values:
Deploy the Ingress resource with kubectl to create the ALB by using the following command:
kubectl apply -f alb.yml
After a few moments, you should see the ALB move from status provisioning to active, with an auto-generated public DNS name.
Validate the ALB DNS name and the ALB is in active status by using the following command:
kubectl -n demo describe ingress alb-ingress
To alias your host, in this case gateway.example.com with the ALB, create a Route 53 alias record. The remote API is now accessible using your Route 53 alias, for example: https://gateway.example.com/api/demo/*
The ALB that you created will only allow incoming HTTPS traffic on port 443, and restricts incoming traffic to known source IP addresses. If you want to share the ALB across multiple microservices, you can add the alb.ingress.kubernetes.io/group.name annotation. To help protect the application from common exploits, you should add an annotation to bind AWS Web Application Firewall (WAFv2) ACLs, including rate-limiting options for the microservice.
Configure the Amazon Cognito user pool
To manage the OAuth 2.0 client credential flow, you create an Amazon Cognito user pool. Use the following procedure to create the Amazon Cognito user pool in the console.
In the top-right corner of the page, choose Create a user pool.
Provide a name for your user pool, and choose Review defaults to save the name.
Review the user pool information and make any necessary changes. Scroll down and choose Create pool.
Note down your created Pool Id, because you will need this for the microservice configuration.
Next, to simulate the client in subsequent tests, you will create three app clients: one for read permission, one for write permission, and one for the microservice.
To create Amazon Cognito app clients
In the left navigation pane, under General settings, choose App clients.
On the right pane, choose Add an app client.
Enter the App client name as readClient.
Leave all other options unchanged.
Choose Create app client to save.
Choose Add another app client, and add an app client with the name writeClient, then repeat step 5 to save.
Choose Add another app client, and add an app client with the name microService. Clear Generate Client Secret, as this isn’t required for the microservice. Leave all other options unchanged. Repeat step 5 to save.
Note down the App client id created for the microService app client, because you will need it to configure the microservice.
You now have three app clients: readClient, writeClient, and microService.
With the read and write clients created, the next step is to create the permission scope (role), which will be subsequently assigned.
To create read and write permission scopes (roles) for use with the app clients
In the left navigation pane, under App integration, choose Resource servers.
On the right pane, choose Add a resource server.
Enter the name Gateway for the resource server.
For the Identifier enter your host name, in this case https://gateway.example.com.Figure 2 shows the resource identifier and custom scopes for read and write role permission.
Figure 2: Resource identifier and custom scopes
In the first row under Scopes, for Name enter demo.read, and for Description enter Demo Read role.
In the second row under Scopes, for Name enter demo.write, and for Description enter Demo Write role.
Choose Save changes.
You have now completed configuring the custom role scopes that will be bound to the app clients. To complete the app client configuration, you will now bind the role scopes and configure the OAuth2.0 flow.
To configure app clients for client credential flow
In the left navigation pane, under App Integration, select App client settings.
On the right pane, the first of three app clients will be visible.
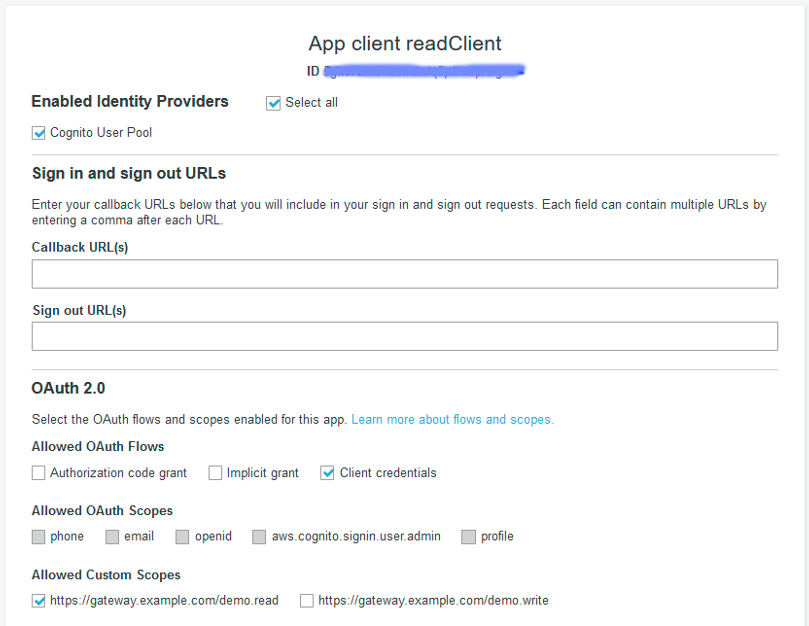
Scroll to the readClient app client and make the following selections:
For Enabled Identity Providers, select Cognito User Pool.
Under OAuth 2.0, for Allowed OAuth Flows, select Client credentials.
Under OAuth 2.0, under Allowed Custom Scopes, select the demo.read scope.
Leave all other options blank.
Scroll to the writeClient app client and make the following selections:
For Enabled Identity Providers, select Cognito User Pool.
Under OAuth 2.0, for Allowed OAuth Flows, select Client credentials.
Under OAuth 2.0, under Allowed Custom Scopes, select the demo.write scope.
Leave all other options blank.
Scroll to the microService app client and make the following selections:
For Enabled Identity Providers, select Cognito User Pool.
Under OAuth 2.0, for Allowed OAuth Flows, select Client credentials.
Under OAuth 2.0, under Allowed Custom Scopes, select the demo.read scope.
Leave all other options blank.
Figure 3 shows the app client configured with the client credentials flow and custom scope—all other options remain blank
Figure 3: App client configuration
Your Amazon Cognito configuration is now complete. Next you will integrate the microservice with OAuth 2.0.
Microservice OAuth 2.0 integration
For the server-side microservice, you will use Quarkus with Kotlin. Quarkus is a cloud-native microservice framework with strong Kubernetes and AWS integration, for the Java Virtual Machine (JVM) and GraalVM. GraalVM native-image can be used to create native executables, for fast startup and low memory usage, which is important for microservice applications.
On the top left, you can modify the Group, Artifact and Build Tool to your preference, or accept the defaults.
In the Pick your extensions search box, select each of the following extensions:
RESTEasy JAX-RS
RESTEasy Jackson
Kubernetes
Container Image Jib
OpenID Connect
Choose Generate your application to download your application as a .zip file.
Quarkus permits low-code integration with an identity provider such as Amazon Cognito, and is configured by the project application.properties file.
To configure application properties to use the Amazon Cognito IDP
Edit the application.properties file in your quick start project:
src/main/resources/application.properties
Add the following properties, replacing the variables with your values. Use the cognito-pool-id and microservice App client id that you noted down when creating these Amazon Cognito resources in the previous sections, along with your Region.
The Kotlin code sample that follows verifies the authenticated principle by using the @Authenticated annotation filter, which performs JSON Web Key Set (JWKS) token validation. The JWKS details are cached, adding nominal latency to the application performance.
The access token claims are auto-filtered by the @RolesAllowed annotation for the custom scopes, read and write. The protected methods are illustrations of a microservice API and how to integrate this with one to two lines of code.
import io.quarkus.security.Authenticated
import javax.annotation.security.RolesAllowed
import javax.enterprise.context.RequestScoped
import javax.ws.rs.*
@Authenticated
@RequestScoped
@Path("/api/demo")
class DemoResource {
@GET
@Path("protectedRole/{name}")
@RolesAllowed("https://gateway.example.com/demo.read")
fun protectedRole(@PathParam(value = "name") name: String) = mapOf("protectedAPI" to "true", "paramName" to name)
@POST
@Path("protectedUpload")
@RolesAllowed("https://gateway.example.com/demo.write")
fun protectedDataUpload(values: Map<String, String>) = "Received: $values"
}
Unit test the access token claims
For the unit tests you will test three scenarios: unauthorized, forbidden, and ok. The @TestSecurity annotation injects an access token with the specified role claim using the Quarkus test security library. To include access token security in your unit test only requires one line of code, the @TestSecurity annotation, which is a strong reason to include access token security validation upfront in your development. The unit test code in the following example maps to the protectedRole method for the microservice via the uri /api/demo/protectedRole, with an additional path parameter sample-username to be returned by the method for confirmation.
Deploying the microservice to Amazon EKS is the same as deploying to any upstream Kubernetes-compliant installation. You declare your application resources in a manifest file, and you deploy a container image of your application to your container registry. You can do this in a similar low-code manner with the Quarkus Kubernetes extension, which automatically generates the Kubernetes deployment and service resources at build time. The Quarkus Container Image Jib extension to automatically build the container image and deploys the container image to Amazon Elastic Container Registry (ECR), without the need for a Dockerfile.
Amazon ECR setup
Your microservice container image created during the build process will be published to Amazon Elastic Container Registry (Amazon ECR) in the same Region as the target Amazon EKS cluster deployment. Container images are stored in a repository in Amazon ECR, and in the following example uses a convention for the repository name of project name and microservice name. The first command that follows creates the Amazon ECR repository to host the microservice container image, and the second command obtains login credentials to publish the container image to Amazon ECR.
To set up the application for Amazon ECR integration
In the AWS CLI, create an Amazon ECR repository by using the following command. Replace the project name variable with your parent project name, and replace the microservice name with the microservice name.
Obtain an ECR authorization token, by using your IAM principal with the following command. Replace the variables with your values for the AWS account ID and Region.
After the application re-build, you should now have a container image deployed to Amazon ECR in your region with the following name [project-group]/[project-name]. The Quarkus build will give an error if the push to Amazon ECR failed.
Now, you can deploy your application to Amazon EKS, with kubectl from the following build path:
kubectl apply -f build/kubernetes/kubernetes.yml
Integration tests for local and remote deployments
The following environment assumes a Unix shell: either MacOS, Linux, or Windows Subsystem for Linux (WSL 2).
How to obtain the access token from the token endpoint
Obtain the access token for the application client by using the Amazon Cognito OAuth 2.0 token endpoint, and export an environment variable for re-use. Replace the variables with your Amazon Cognito pool name, and AWS Region respectively.
To generate the client credentials in the required format, you need the Base64 representation of the app client client-id:client-secret. There are many tools online to help you generate a Base64 encoded string. Export the following environment variables, to avoid hard-coding in configuration or scripts.
You can use curl to post to the token endpoint, and obtain an access token for the read and write app client respectively. You can pass grant_type=client_credentials and the custom scopes as appropriate. If you pass an incorrect scope, you will receive an invalid_grant error. The Unix jq tool extracts the access token from the JSON string. If you do not have the jq tool installed, you can use your relevant package manager (such as apt-get, yum, or brew), to install using sudo [package manager] install jq.
The following shell commands obtain the access token associated with the read or write scope. The client credentials are used to authorize the generation of the access token. An environment variable stores the read or write access token for future use. Update the scope URL to your host, in this case gateway.example.com.
If the curl commands are successful, you should see the access tokens in the environment variables by using the following echo commands:
echo $access_token_read
echo $access_token_write
For more information or troubleshooting, see TOKEN Endpoint in the Amazon Cognito Developer Guide.
Test scope with automation script
Now that you have saved the read and write access tokens, you can test the API. The endpoint can be local or on a remote cluster. The process is the same, all that changes is the target URL. The simplicity of toggling the target URL between local and remote is one of the reasons why access token security can be integrated into the full development lifecycle.
To perform integration tests in bulk, use a shell script that validates the response code. The example script that follows validates the API call under three test scenarios, the same as the unit tests:
If no valid access token is passed: 401 (unauthorized) response is expected.
A valid access token is passed, but with an incorrect role claim: 403 (forbidden) response is expected.
A valid access token and valid role-claim is passed: 200 (ok) response with content-type of application/json expected.
Name the following script, demo-api.sh. For each API method in the microservice, you duplicate these three tests, but for the sake of brevity in this post, I’m only showing you one API method here, protectedRole.
Test the microservice API against the access token claims
Run the script for a local host deployment on http://localhost:8080, and on the remote EKS cluster, in this case https://gateway.example.com.
If everything works as expected, you will have demonstrated the same test process for local and remote deployments of your microservice. Another advantage of creating a security test automation process like the one demonstrated, is that you can also include it as part of your continuous integration/continuous delivery (CI/CD) test automation.
The test automation script accepts the microservice host URL as a parameter (the default is local), referencing the stored access tokens from the environment variables. Upon error, the script will exit with the error code. To test the remote EKS cluster, use the following command, with your host URL, in this case gateway.example.com.
./demo-api.sh https://<gateway.example.com>
Expected output:
Test 401-unauthorized: No access token for /api/demo/protectedRole/{name}
Test 403-forbidden: Incorrect role/custom-scope for /api/demo/protectedRole/{name}
Test 200-ok: Correct role for /api/demo/protectedRole/{name}
Output: {"protectedAPI":"true","paramName":"sample-username"}!200!application/json
Best practices for a well architected production service-to-service client
For elevated security in alignment with AWS Well Architected, it is recommend to use AWS Secrets Manager to hold the client credentials. Separating your credentials from the application permits credential rotation without the requirement to release a new version of the application or modify environment variables used by the service. Access to secrets must be tightly controlled because the secrets contain extremely sensitive information. Secrets Manager uses AWS Identity and Access Management (IAM) to secure access to the secrets. By using the permissions capabilities of IAM permissions policies, you can control which users or services have access to your secrets. Secrets Manager uses envelope encryption with AWS KMS customer master keys (CMKs) and data key to protect each secret value. When you create a secret, you can choose any symmetric customer managed CMK in the AWS account and Region, or you can use the AWS managed CMK for Secrets Manager aws/secretsmanager.
Access tokens can be configured on Amazon Cognito to expire in as little as 5 minutes or as long as 24 hours. To avoid unnecessary calls to the token endpoint, the application client should cache the access token and refresh close to expiry. In the Quarkus framework used for the microservice, this can be automatically performed for a client service by adding the quarkus-oidc-client extension to the application.
Cleaning up
To avoid incurring future charges, delete all the resources created.
To delete the EKS cluster, and the associated Application Load Balancer, follow the steps described in Deleting a cluster in the Amazon EKS User Guide.
This post has focused on the last line of defense, the microservice, and the importance of a layered security approach throughout the development lifecycle. Access token security should be validated both at the application gateway and microservice for end-to-end API protection.
As an additional layer of security at the application gateway, you should consider using Amazon API Gateway, and the inbuilt JWT authorizer to perform the same API access token validation for public facing APIs. For more advanced business-to-business solutions, Amazon API Gateway provides integrated mutual TLS authentication.
If you have feedback about this post, submit comments in the Comments section below. If you have questions about this post, start a new thread on the Amazon Cognito forum or contact AWS Support.
Want more AWS Security how-to content, news, and feature announcements? Follow us on Twitter.
Multi-modal transportation is one of the biggest developments in the logistics industry. There has been a successful collaboration across different transportation partners in supply chain freight forwarding for many decades. But there’s still a considerable overhead of paperwork processing for each leg of the trip. Tens of billions of documents are processed in ocean freight forwarding alone. Using manual labor to process these documents (purchase orders, invoices, bills of lading, delivery receipts, and more) is both expensive and error-prone.
In this blog post, we’ll address how to automate the document processing in the logistics industry. We’ll also show you how to integrate it with a centralized workflow management.
Automated document processing architecture
Figure 1. Architecture of document processing workflow
The solution workflow shown in Figure 1 is as follows:
Documents that belong to the same transaction are collected in an S3 bucket
We use AWS Step Functions for the orchestration of document processing workflow. Step functions also help to improve the application resiliency with less code.
Detect if all required documents for a given transaction are available in Amazon S3
Kick off the process by creating an Amazon SQS message
Detect a new processing job from a generated SQS message
Extract text from PDFs using a Step Function
Extract entities from generated text using a Step Function
Control data completeness and accuracy
Initiate a human loop when needed using a Step Function
Consolidate the data collected from documents
Store the data into the database
Document ingestion and classification
There are several data ingestion options available such as AWS Transfer Family, AWS DataSync, and Amazon Kinesis Data Firehose. Choose the appropriate ingestion blueprints based on the type of data sources. Typical real-time ingestion blueprints include AWS Lambda processing and an Amazon CloudWatch event. The batch pipeline can leverage AWS Step Functions. This can be used to orchestrate the Lambda function that initiates the document processing workflow.
Here are some things to consider when building your document ingestion and storage solution:
Choose your bucket strategy. Amazon S3 is an object store. Analyze your data pipeline ingestion carefully and choose the correct S3 bucket strategy for each document type (bills, supplier invoices, and others.)
Organize your data. The data is organized in S3 buckets by layers: Raw, Staging, and Processed. Each has their own respective bucket policy and access control.
Build a creation tool. This is an automated data lake bucket/folder structure tool, based on your data ingestion requirements. You can use this same structure for user-created data.
Define data security requirements. Do this before you begin the ingestion process. Before ingesting new or current data sources into AWS, secure access to the data.
Review security credentials needed for access. After copying these credentials into AWS Systems Manager (SSM), apply an AWS Key Management Service (KMS) key to encrypt the file. This encrypted key string is stored in SSM to use for authentication.
Document processing workflow
Overview
The workflow checks the input buckets until it detects all the documents types necessary for a complete dataset. In our case, it is the invoice document and customs authorization form. Once both are detected, it generates a job request as a message in Amazon SQS. A Lambda function then processes the message and kicks off the Step Function flow (see Figure 2). The state machine then initiates the document processing, text extraction, and optional human review steps. AWS Step Functions are well suited for our use case due to its ability to manage long-running workflows.
Figure 2. Visual workflow of document processing in AWS Step Functions
Entity extraction
For each document, entities are extracted using Amazon Textract and Amazon Comprehend. These entities can include date, company, address, bill of materials, total cost, and invoice number.
Following is a sample invoice document that is fed to Amazon Textract, which extracts the form data and creates key-value pairs.
Figure 3. Highlighted different entities in the sample invoice document
See Figure 4 for an example of the key-value pairs extracted for the sample invoice. The keys here represent the form labels (“SHIP TO”) and the values represent form values (shipping address).
Figure 4. Key-value pairs of the invoice data, extracted by Amazon Textract
Amazon Textract also generates a raw text output that contains the entire text, as shown in Figure 5 following.
Figure 5. Raw text output of the invoice data extracted by Amazon Textract
To achieve a higher degree of confidence, Amazon Comprehend is used to identify and extract the custom entities. Amazon Comprehend is a natural language processing (NLP) service that uses machine learning (ML) to identify and extracts insights and entities from text data. You can train Amazon Comprehend to identify entities relevant to your organization. These can be product names, part numbers, department names, or other entities. You can also train Amazon Comprehend to categorize documents or assign relevant labels to text.
An Amazon Comprehend entity recognizer comes with a set of pre-built entity types. Amazon Comprehend can introduce custom entities to match our specific business needs. Some of the entities we want to identify are address and company name. We trained a custom recognizer to detect company names and addresses, see Figure 6.
Figure 6. Training details of custom entity recognizer
Figure 7 shows the resulting output from Amazon Comprehend:
The document is processed top-down, from left to right, from the sample invoice in Figure 3. We know that the first company and first address belongs to the Billing Company. And the second set belongs to the Shipment recipient. Along with detecting custom entities, Amazon Comprehend also outputs the confidence score of the extracted result.
Confidence scores can vary depending on how close training data is to actual data. In the example preceding, the first company entity came back with a score of 0.941. Let’s assume that we have set a minimum confidence score of 0.95. Anything below that threshold should be reviewed by a human. The following section describes the last step of our workflow.
Human review
Amazon Augmented AI (A2I) allows you to create and manage human loops. A human loop is a manual review task that gets assigned to a workforce. The workforce can be public, such as Mechanical Turk, or private, such as internal team or a paid contractor. In our example, we created a private workforce to review the entities we were not confident about. Figure 8 shows an example of the user interface that the reviewers use to assign entities to the proper text sections.
Figure 8. Manual review interface of Amazon A2I
Review tasks can be automatically submitted to the workforce based on dynamic criteria, after both AI-related steps are completed. It can be used to review the text detected by Amazon Textract when key data elements are missing (such as order amount or quantity). It can also review entities after invoking Amazon Comprehend.
Figure 9. Consolidated dataset of processed invoice and customs authorization data
After the manual review step, data can be consolidated (as shown in Figure 9) and stored into a relational database. It can also be shared with other business units such as Accounting or Customer Services. You can apply the same process to other document types such as custom forms, which are linked to the same transaction. This allows us to process and combine information that comes from disparate paper sources more efficiently.
Conclusion
This post demonstrates how document processing can be automated to process business documentation by using Amazon Textract, Amazon Comprehend and Amazon Augmented AI.
Deploying an automated solution in the logistics industry takes away the undifferentiated heavy lifting involved in manual document processing. This helps to cut down the delivery delays and track any missed deliveries. By providing a comprehensive view of the shipment, it increases the efficiency of back-office processing. It can also further simplify the data collection for audit purposes.
In an evolving world that is increasingly connected, data-centric, and fast-paced, the sports industry is no exception. Amazon Web Services (AWS) has been helping customers in the sports industry gain real-time insights through analytics. You can re-invent and reimagine the fan experience by tracking sports actions and activities. In this blog post, we will highlight common architectural and design patterns for building a data pipeline to track sporting events in real time.
The sports industry is largely comprised of two subsegments: participatory and spectator sports. Participatory sports, for example fitness, golf, boating, and skiing, comprise the largest share of the market. Spectator sports, such as teams/clubs/leagues, individual sports, and racing, are expected to be the fastest growing segment. Sports teams/leagues/clubs comprise the largest share of the Spectator sports segment, and is growing most rapidly.
IoT data pipeline architecture overview
Let’s discuss the infrastructure in three parts:
Infrastructure at the arena itself
Processing data using AWS services
Leveraging this analysis using a graphics overlay (this can be especially useful for broadcasters, OTT channels, and arena users)
Data-gathering devices
Radio-frequency identification (RFID) chips or IoT devices can be worn by players or embedded in the playing equipment. These devices emit 20–50 messages per second. These messages are collected and output using JSON. This information may include player coordinate positions, player speed, statistics, health information, or more. To process the game, leagues, coaches, or broadcasters can analyze this data using analytics tools and/or machine learning.
Figure 1. Data pipeline architecture using AWS Services
Processing data, feature engineering, and model training at AWS
Use serverless services from AWS when possible in order to keep your solution scalable and cost-efficient. This also helps with operational overhead for teams. You can use the Kinesis family of services for stream ingestion and processing. The streaming data from hundreds to thousands of IoT sources (from equipment and clothing) can be fed to Amazon Kinesis Data Streams (KDS). KDS and Amazon Kinesis Data Firehose provide a buffering mechanism for streaming data before it lands on Amazon Simple Storage Service (S3). With Amazon Kinesis Data Analytics, you can process and analyze Kinesis stream data using powerful SQL, Apache Flink, or Beam. Kinesis Data Analytics also supports building applications in SQL, Java, Scala, and Python. With this service, you can quickly author and run powerful SQL code against Amazon Kinesis Streams as your source. This way you can perform time series analytics, feed real-time dashboards, and create real-time metrics. Read more about Amazon Kinesis Data Analytics for SQL Applications.
You might want to transform or enhance the streaming data before it is delivered to Amazon S3. Amazon Kinesis Data Firehose can be used with an AWS Lambda function to do the transformation. Let’s say you have a player prediction timestamp that you want to represent in a different time format to different ML algorithms. Lambda can process and transform this data. Kinesis Data Firehose will deliver the transformed and raw data to the destination (Amazon S3). This can occur after the specific buffering size or when the buffering interval is reached, whichever happens first.
For more complex transformations, AWS Glue can be used. For example, once the data lands in Amazon S3, you can start preparing and aggregating the training dataset using Amazon SageMaker Data Wrangler. As part of the feature engineering process, you can do the following:
Transform the data
Delete unneeded columns
Impute missing values
Perform label encoding
Use the quick model option to get a sense of which features are adding predictive power as you progress with your data preparation
All the data preparation and feature engineering tasks can be performed from Data Wrangler’s single visual interface.
Once data is prepared in Amazon S3, Amazon SageMaker can be used for model training. In soccer, you can predict a goal percentage based on the player’s position, acceleration, and past performance history. SageMaker provides several built-in algorithms that can be trained. For real-time predictions, Amazon API Gateway provides an API layer to clients like an OTT, broadcasting service, or a web browser. API Gateway can invoke a Lambda function, with logic to call a SageMaker endpoint and persist the output to the database. This data can be used later on for further analysis or to fine-tune your models.
Figure 2. Deliver real-time prediction using Amazon SageMaker
Computer vision-based object detection techniques can be very useful in Sports. These techniques use deep learning algorithms to predict the pass probability, game player face-off, or win prediction. For the sports industry, object detection technology like these are crucial. They obviate the need for sensors. Real-time object identification can be used to:
Generate new advanced analytics regarding player and team performance
Aid game officials in making correct calls
Provide fans an improved and more data-rich viewing experience
Read Football tracking in the NFL with Amazon SageMaker for more information on how to track using broadcast video data. Using SageMaker, you can train object detection models that analyze thousands of images. You can then locate and classify the football itself, and distinguish it from background objects.
Creating a graphics overlay
When you have the ML inference data and video ingestion ready, you may want to represent this data on your broadcasted video. The graphic overlay feature lets you insert an image (a BMP, PNG, or TGA file) at a specified time. It is displayed as a static overlay on the underlying video for a specified duration. The motion graphic overlay feature lets you insert an animation (a MOV or SWF file, or a series of PNG files) on the underlying video. This can be displayed at a specified time for a specified duration.
For example, a player’s motion prediction can be inserted on video during a game, through a RESTful API call of ML inferences. You can use AWS Elemental Live to achieve this. Read about AWS Elemental Live Graphic Overlay at AWS documentation.
In this blog, we’ve highlighted how customers in the sports industry are using AWS to increase the quality of the game, and enhance the sports fan’s experience. The following benefits can be achieved by building a data pipeline for tracking sporting events using AWS services:
Amazon Kinesis collects, processes, and analyzes in-game streaming data in real time. This way both teams and fans get timely insights and can react quickly to new information.
The serverless nature of this architecture enables a cost-effective, scalable, and operationally efficient environment for customers.
Amazon Machine Learning services like Amazon SageMaker can be used to enrich the fan viewing experience. It presents in-game predictions such as who will score next, or which team will win the game.
This post is part of a series about how Amazon Web Services (AWS) can help your US federal agency meet the requirements of the President’s Executive Order on Improving the Nation’s Cybersecurity. You will learn how you can use AWS information security practices to help meet the requirement to improve logging and log retention practices in your AWS environment.
Improving the security and operational readiness of applications relies on improving the observability of the applications and the infrastructure on which they operate. For our customers, this translates to questions of how to gather the right telemetry data, how to securely store it over its lifecycle, and how to analyze the data in order to make it actionable. These questions take on more importance as our federal customers seek to improve their collection and management of log data in all their IT environments, including their AWS environments, as mandated by the executive order.
Given the interest in the technologies used to support logging and log retention, we’d like to share our perspective. This starts with an overview of logging concepts in AWS, including log storage and management, and then proceeds to how to gain actionable insights from that logging data. This post will address how to improve logging and log retention practices consistent with the Security and Operational Excellence pillars of the AWS Well-Architected Framework.
Log actions and activity within your AWS account
AWS provides you with extensive logging capabilities to provide visibility into actions and activity within your AWS account. A security best practice is to establish a wide range of detection mechanisms across all of your AWS accounts. Starting with services such as AWS CloudTrail, AWS Config, Amazon CloudWatch, Amazon GuardDuty, and AWS Security Hub provides a foundation upon which you can base detective controls, remediation actions, and forensics data to support incident response. Here is more detail on how these services can help you gain more security insights into your AWS workloads:
AWS CloudTrail provides event history for all of your AWS account activity, including API-level actions taken through the AWS Management Console, AWS SDKs, command line tools, and other AWS services. You can use CloudTrail to identify who or what took which action, what resources were acted upon, when the event occurred, and other details. If your agency uses AWS Organizations, you can automate this process for all of the accounts in the organization.
CloudTrail log file integrity validation produces and cyptographically signs a digest file that contains references and hashes for every CloudTrail file that was delivered in that hour. This makes it computationally infeasible to modify, delete or forge CloudTrail log files without detection. Validated log files are invaluable in security and forensic investigations. For example, a validated log file enables you to assert positively that the log file itself has not changed, or that particular user credentials performed specific API activity.
AWS Config monitors and records your AWS resource configurations and allows you to automate the evaluation of recorded configurations against desired configurations. For example, you can use AWS Config to verify that resources are encrypted, multi-factor authentication (MFA) is enabled, and logging is turned on, and you can use AWS Config rules to identify noncompliant resources. Additionally, you can review changes in configurations and relationships between AWS resources and dive into detailed resource configuration histories, helping you to determine when compliance status changed and the reason for the change.
Amazon GuardDuty is a threat detection service that continuously monitors for malicious activity and unauthorized behavior to protect your AWS accounts and workloads. Amazon GuardDuty analyzes and processes the following data sources: VPC Flow Logs, AWS CloudTrail management event logs, CloudTrail Amazon Simple Storage Service (Amazon S3) data event logs, and DNS logs. It uses threat intelligence feeds, such as lists of malicious IP addresses and domains, and machine learning to identify potential threats within your AWS environment.
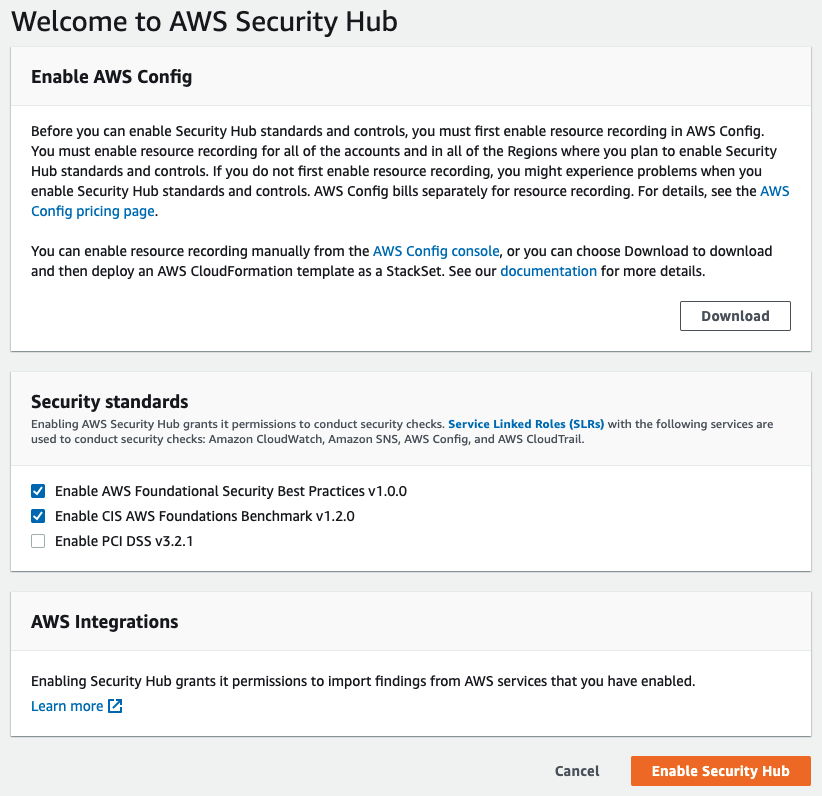
AWS Security Hub provides a single place that aggregates, organizes, and prioritizes your security alerts, or findings, from multiple AWS services and optional third-party products to give you a comprehensive view of security alerts and compliance status.
You should be aware that most AWS services do not charge you for enabling logging (for example, AWS WAF) but the storage of logs will incur ongoing costs. Always consult the AWS service’s pricing page to understand cost impacts. Related services such as Amazon Kinesis Data Firehose (used to stream data to storage services), and Amazon Simple Storage Service (Amazon S3), used to store log data, will incur charges.
Turn on service-specific logging as desired
After you have the foundational logging services enabled and configured, next turn your attention to service-specific logging. Many AWS services produce service-specific logs that include additional information. These services can be configured to record and send out information that is necessary to understand their internal state, including application, workload, user activity, dependency, and transaction telemetry. Here’s a sampling of key services with service-specific logging features:
Amazon CloudWatch provides you with data and actionable insights to monitor your applications, respond to system-wide performance changes, optimize resource utilization, and get a unified view of operational health. CloudWatch collects monitoring and operational data in the form of logs, metrics, and events, providing you with a unified view of AWS resources, applications, and services that run on AWS and on-premises servers. You can gain additional operational insights from your AWS compute instances (Amazon Elastic Compute Cloud, or EC2) as well as on-premises servers using the CloudWatch agent. Additionally, you can use CloudWatch to detect anomalous behavior in your environments, set alarms, visualize logs and metrics side by side, take automated actions, troubleshoot issues, and discover insights to keep your applications running smoothly.
Amazon CloudWatch Logs is a component of Amazon CloudWatch which you can use to monitor, store, and access your log files from Amazon Elastic Compute Cloud (Amazon EC2) instances, AWS CloudTrail, Route 53, and other sources. CloudWatch Logs enables you to centralize the logs from all of your systems, applications, and AWS services that you use, in a single, highly scalable service. You can then easily view them, search them for specific error codes or patterns, filter them based on specific fields, or archive them securely for future analysis. CloudWatch Logs enables you to see all of your logs, regardless of their source, as a single and consistent flow of events ordered by time, and you can query them and sort them based on other dimensions, group them by specific fields, create custom computations with a powerful query language, and visualize log data in dashboards.
Traffic Mirroring allows you to achieve full packet capture (as well as filtered subsets) of network traffic from an elastic network interface of EC2 instances inside your VPC. You can then send the captured traffic to out-of-band security and monitoring appliances for content inspection, threat monitoring, and troubleshooting.
The Elastic Load Balancing service provides access logs that capture detailed information about requests that are sent to your load balancer. Each log contains information such as the time the request was received, the client’s IP address, latencies, request paths, and server responses. The specific information logged varies by load balancer type:
Amazon S3 access logs record the S3 bucket and account that are being accessed, the API action, and requester information.
AWS Web Application Firewall (WAF) logs record web requests that are processed by AWS WAF, and indicate whether the requests matched AWS WAF rules and what actions, if any, were taken. These logs are delivered to Amazon S3 by using Amazon Kinesis Data Firehose.
Amazon Route 53 provides options for logging for both public DNS query requests as well as Route53 Resolver DNS queries:
Route 53 Resolver DNS query logs record DNS queries and responses that originate from your VPC, that use an inbound Resolver endpoint, that use an outbound Resolver endpoint, or that use a Route 53 Resolver DNS Firewall.
Route 53 DNS public query logs record queries to Route 53 for domains you have hosted with AWS, including the domain or subdomain that was requested; the date and time of the request; the DNS record type; the Route 53 edge location that responded to the DNS query; and the DNS response code.
Elastic Beanstalk logs can be streamed to CloudWatch Logs. You can also use the AWS Management Console to request the last 100 log entries from the web and application servers, or request a bundle of all log files that is uploaded to Amazon S3 as a ZIP file.
Now that you’ve enabled foundational and service-specific logging in your AWS accounts, that data needs to be persisted and managed throughout its lifecycle. AWS offers a variety of solutions and services to consolidate your log data and store it, secure access to it, and perform analytics.
Store log data
The primary service for storing all of this logging data is Amazon S3. Amazon S3 is ideal for this role, because it’s a highly scalable, highly resilient object storage service. AWS provides a rich set of multi-layered capabilities to secure log data that is stored in Amazon S3, including encrypting objects (log records), preventing deletion (the S3 Object Lock feature), and using lifecycle policies to transition data to lower-cost storage over time (for example, to S3 Glacier). Access to data in Amazon S3 can also be restricted through AWS Identity and Access Management (IAM) policies, AWS Organizations service control policies (SCPs), S3 bucket policies, Amazon S3 Access Points, and AWS PrivateLink interfaces. While S3 is particularly easy to use with other AWS services given its various integrations, many customers also centralize their storage and analysis of their on-premises log data, or log data from other cloud environments, on AWS using S3 and the analytic features described below.
If your AWS accounts are organized in a multi-account architecture, you can make use of the AWS Centralized Logging solution. This solution enables organizations to collect, analyze, and display CloudWatch Logs data in a single dashboard. AWS services generate log data, such as audit logs for access, configuration changes, and billing events. In addition, web servers, applications, and operating systems all generate log files in various formats. This solution uses the Amazon Elasticsearch Service (Amazon ES) and Kibana to deploy a centralized logging solution that provides a unified view of all the log events. In combination with other AWS-managed services, this solution provides you with a turnkey environment to begin logging and analyzing your AWS environment and applications.
You can also make use of services such as Amazon Kinesis Data Firehose, which you can use to transport log information to S3, Amazon ES, or any third-party service that is provided with an HTTP endpoint, such as Datadog, New Relic, or Splunk.
Finally, you can use Amazon EventBridge to route and integrate event data between AWS services and to third-party solutions such as software as a service (SaaS) providers or help desk ticketing systems. EventBridge is a serverless event bus service that allows you to connect your applications with data from a variety of sources. EventBridge delivers a stream of real-time data from your own applications, SaaS applications, and AWS services, and then routes that data to targets such as AWS Lambda.
Amazon Detective makes it easy to analyze, investigate, and quickly identify the root cause of security findings or suspicious activities. Detective automatically collects log data from your AWS resources. It then uses machine learning, statistical analysis, and graph theory to help you visualize and conduct faster and more efficient security investigations.
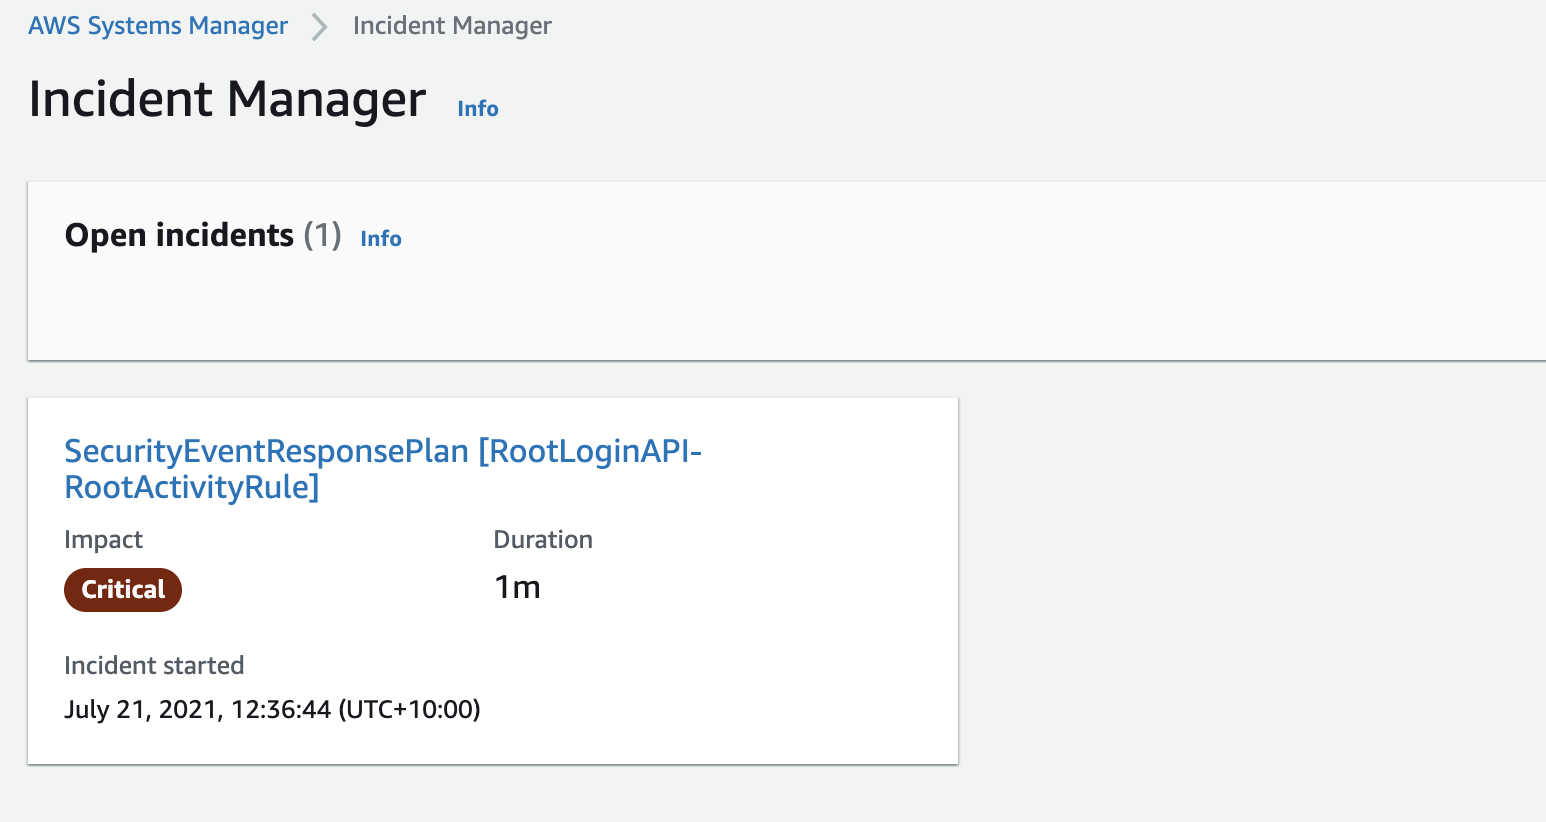
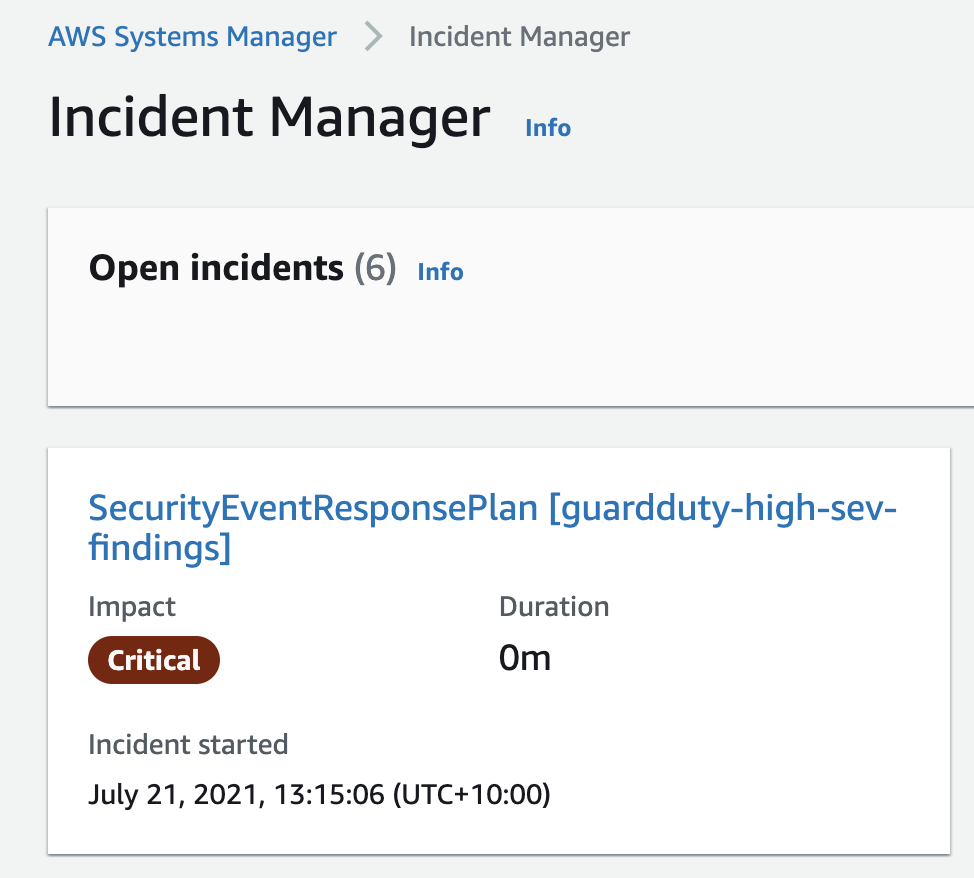
Incident Manager is a component of AWS Systems Manger which enables you to automatically take action when a critical issue is detected by an Amazon CloudWatch alarm or Amazon Eventbridge event. Incident Manager executes pre-configured response plans to engage responders via SMS and phone calls, enable chat commands and notifications using AWS Chatbot, and execute AWS Systems Manager Automation runbooks. The Incident Manager console integrates with AWS Systems Manager OpsCenter to help you track incidents and post-incident action items from a central place that also synchronizes with popular third-party incident management tools such as Jira Service Desk and ServiceNow.
Amazon Elasticsearch Service (Amazon ES) is a fully managed service that collects, indexes, and unifies logs and metrics across your environment to give you unprecedented visibility into your applications and infrastructure. With Amazon ES, you get the scalability, flexibility, and security you need for the most demanding log analytics workloads. You can configure a CloudWatch Logs log group to stream data it receives to your Amazon ES cluster in near real time through a CloudWatch Logs subscription.
CloudWatch Logs Insights enables you to interactively search and analyze your log data in CloudWatch Logs.
Amazon Athena is an interactive query service that you can use to analyze data in Amazon S3 by using standard SQL. Athena is serverless, so there is no infrastructure to manage, and you pay only for the queries that you run.
Conclusion
As called out in the executive order, information from network and systems logs is invaluable for both investigation and remediation services. AWS provides a broad set of services to collect an unprecedented amount of data at very low cost, optionally store it for long periods of time in tiered storage, and analyze that telemetry information from your cloud-based workloads. These insights will help you improve your organization’s security posture and operational readiness and, as a result, improve your organization’s ability to deliver on its mission.
Next steps
To learn more about how AWS can help you meet the requirements of the executive order, see the other post in this series:
The COVID-19 pandemic has proven to be the largest stress test of our technology infrastructures in generations. A meteoric increase in internet consumption followed, due in large part to working and schooling from home. The chaotic, early months of the pandemic have clearly demonstrated the value of resiliency in production. How can we better prepare our critical systems for these global events in the future? A more modern approach to testing and validating your application architecture is needed. Chaos engineering has emerged as an innovative approach to solving these types of challenges.
This blog shows an architecture pattern for automating chaos testing as part of your continuous integration/continuous delivery (CI/CD) process. By automating the implementation of chaos experiments inside CI/CD pipelines, complex risks and modeled failure scenarios can be tested against application environments with every deployment. Application teams can use the results of these experiments to prioritize improvements in their architecture. These results will give your team the confidence they need to operate in an unpredictable production environment.
AWS Fault Injection Simulator (FIS) is a managed service that enables you to perform fault injection experiments on your AWS workloads. Fault injection is based on the principles of chaos engineering. These experiments stress an application by creating disruptive events so that you can observe how your application responds. You can then use this information to improve the performance and resiliency of your applications. With AWS FIS, you set up and run experiments that help you create the real-world conditions needed to uncover application issues.
AWS CodePipeline is a fully managed continuous delivery service for fast and reliable application and infrastructure updates. You can use AWS CodePipeline to model and automate your software release processes. Automating your build, test, and release process allows you to quickly test each code change. You can ensure the quality of your application or infrastructure code by running each change through your staging and release process.
Continuous chaos testing
Figure 1. High-level architecture pattern for automating chaos engineering
Create/Add a FIS IAM role to the Lambda function in the configuration permissions section. To start a specific FIS experiment, we use the experimentTemplateId parameter in our Lambda code. Refer to the AWS FIS API Reference when writing your Lambda code. When integrating the Lambda function into your pipeline, a new AWS CodePipeline can be created or an existing one can be used. A new pipeline stage is added at the point we initiate our Lambda function (post deployment stage), which launches our FIS experiment.
Figure 3. AWS Lambda function initiating AWS FIS experiment
Figure 4. AWS CodePipeline with AWS FIS experiment stage
The experimentTemplateId parameter can also be staged as a key/value ‘environment variable’ in your Lambda function configuration. This is useful as it allows you to change your FIS experiment template without having to adjust your function code. You can use the same Lambda function code by dynamically injecting the experimentTemplateId in multiple environments on your way to production.
Verify FIS experiment results on deployed application
By continuously performing fault injection post-deployment in AWS CodePipeline, you learn about complex failure conditions, which you must solve. User experience and availability testing on your application during the runtime of the FIS experiment can be started by a notification rule. In AWS CodePipeline, you can use an Amazon Simple Notification Service (SNS) topic or chatbot integration. CloudWatch Synthetics can be used for those looking to automate experience testing on the candidate application while other FIS experiments are running.
Using AWS CodePipeline to automate chaos engineering experiments on application architecture with AWS FIS is straightforward. Following are some benefits from automating fault injection testing in our CI/CD pipelines:
Our team can achieve a higher degree of confidence in meeting the resiliency requirements of our application. We use a more modern approach to testing and automating this experimentation inside our existing CI/CD process with AWS CodePipeline.
We know more about the unknown risks to our application. All testing results we receive provide benefit and learning opportunities for our team. We use these results to understand what we do well, where we need to improve, or what we are willing to tolerate based on our application requirements.
Continuously evaluating our architectural fitness inside CI/CD allows our team to validate the impact each feature or component iteration has on the resiliency of our application.
However, the sole value of automating chaos testing is not limited to finding, fixing, or documenting the risks that surface in our application. Additional confidence is gained through constantly validating your operational practices, such as alerts and alarms, monitoring, and notifications.
FIS gives you a controlled and repeatable way to reproduce necessary conditions to fine-tune your operational procedures and runbooks. Automating this testing inside a CI/CD pipeline ensures a nearly continuous feedback loop for these operational practices.
If you want to review additional FIS experiment examples, check out our AWS Samples GitHub
Developing and deploying applications rapidly to users requires a working pipeline that accepts the user code (usually via a Git repository). AWS CodeArtifact was announced in 2020. It’s a secure and scalable artifact management product that easily integrates with other AWS products and services. CodeArtifact allows you to publish, store, and view packages, list package dependencies, and share your application’s packages.
In this post, I will show how we can build a simple DevOps pipeline for a sample JAVA application (JAR file) to be built with Maven.
Solution Overview
We utilize the following AWS services/Tools/Frameworks to set up our continuous integration, continuous deployment (CI/CD) pipeline:
The following diagram illustrates the pipeline architecture and flow:
Our pipeline is built on CodePipeline with CodeCommit as the source (CodePipeline Source Stage). This triggers the pipeline via a CloudWatch Events rule. Then the code is fetched from the CodeCommit repository branch (main) and sent to the next pipeline phase. This CodeBuild phase is specifically for compiling, packaging, and publishing the code to CodeArtifact by utilizing a package manager—in this case Maven.
After Maven publishes the code to CodeArtifact, the pipeline asks for a manual approval to be directly approved in the pipeline. It can also optionally trigger an email alert via Amazon Simple Notification Service (Amazon SNS). After approval, the pipeline moves to another CodeBuild phase. This downloads the latest packaged JAR file from a CodeArtifact repository and deploys to the AWS Lambda function.
After the Git repository is cloned, the directory structure is shown as in the following screenshot :
Let’s study the files and code to understand how the pipeline is built.
The directory java-events is a sample Java Maven project. Find numerous sample applications on GitHub. For this post, we use the sample application java-events.
To add your own application code, place the pom.xml and settings.xml files in the root directory for the AWS CDK project.
Let’s study the code in the file lib/cdk-pipeline-codeartifact-new-stack.ts of the stack CdkPipelineCodeartifactStack. This is the heart of the AWS CDK code that builds the whole pipeline. The stack does the following:
Creates a CodeCommit repository called ca-pipeline-repository.
References a CloudFormation template (lib/ca-template.yaml) in the AWS CDK code via the module @aws-cdk/cloudformation-include.
Creates a CodeArtifact domain called cdkpipelines-codeartifact.
Creates a CodeArtifact repository called cdkpipelines-codeartifact-repository.
Creates a CodeBuild project called JarBuild_CodeArtifact. This CodeBuild phase does all of the code compiling, packaging, and publishing to CodeArtifact into a repository called cdkpipelines-codeartifact-repository.
Creates a CodeBuild project called JarDeploy_Lambda_Function. This phase fetches the latest artifact from CodeArtifact created in the previous step (cdkpipelines-codeartifact-repository) and deploys to the Lambda function.
Finally, creates a pipeline with four phases:
Source as CodeCommit (ca-pipeline-repository).
CodeBuild project JarBuild_CodeArtifact.
A Manual approval Stage.
CodeBuild project JarDeploy_Lambda_Function.
CodeArtifact shows the domain-specific and repository-specific connection settings to mention/add in the application’s pom.xml and settings.xml files as below:
Deploy the Pipeline
The AWS CDK code requires the following packages in order to build the CI/CD pipeline:
After the AWS CDK code is deployed, view the final output on the stack’s detail page on the AWS CloudFormation :
How the pipeline works with artifact versions (using SNAPSHOTS)
In this demo, I publish SNAPSHOT to the repository. As per the documentation here and here, a SNAPSHOT refers to the most recent code along a branch. It’s a development version preceding the final release version. Identify a snapshot version of a Maven package by the suffix SNAPSHOT appended to the package version.
The application settings are defined in the pom.xml file. For this post, we define the following:
The version to be used, called 1.0-SNAPSHOT.
The specific packaging, called jar.
The specific project display name, called JavaEvents.
The specific group ID, called JavaEvents.
The screenshot below shows the pom.xml settings we utilised in the application:
You can’t republish a package asset that already exists with different content, as per the documentation here.
When a Maven snapshot is published, its previous version is preserved in a new version called a build. Each time a Maven snapshot is published, a new build version is created.
When a Maven snapshot is published, its status is set to Published, and the status of the build containing the previous version is set to Unlisted. If you request a snapshot, the version with status Published is returned. This is always the most recent Maven snapshot version.
For example, the image below shows the state when the pipeline is run for the FIRST RUN. The latest version has the status Published and previous builds are marked Unlisted.
For all subsequent pipeline runs, multiple Unlisted versions will occur every time the pipeline is run, as all previous versions of a snapshot are maintained in its build versions.
Fetching the Latest Code
Retrieve the snapshot from the repository in order to deploy the code to an AWS Lambda Function. I have used AWS CLI to list and fetch the latest asset of package version 1.0-SNAPSHOT.
Notice that I’m referring the last code by using variable $ListLatestArtifact. This always fetches the latest code, and demooutput is the outfile of the AWS CLI command where the content (code) is saved.
Testing the Pipeline
Now clone the CodeCommit repository that we created with the following code:
Enter the following code to push the code to the CodeCommit repository:
cp -rp cdk-pipeline-codeartifact-new /* ca-pipeline-repository cd ca-pipeline-repository git checkout -b main git add . git commit -m “testing the pipeline” git push origin main
Once the code is pushed to Git repository, the pipeline is automatically triggered by Amazon CloudWatch events.
The following screenshots shows the second phase (AWS CodeBuild Phase – JarBuild_CodeArtifact) of the pipeline, wherein the asset is successfully compiled and published to the CodeArtifact repository by Maven:
The following screenshots show the last phase (AWS CodeBuild Phase – Deploy-to-Lambda) of the pipeline, wherein the latest asset is successfully pulled and deployed to AWS Lambda Function.
Asset JavaEvents-1.0-20210618.131629-5.jar is the latest snapshot code for the package version 1.0-SNAPSHOT. This is the same asset version code that will be deployed to AWS Lambda Function, as seen in the screenshots below:
The following screenshot of the pipeline shows a successful run. The code was fetched and deployed to the existing Lambda function (codeartifact-test-function).
Cleanup
To clean up, You can either delete the entire stack through the AWS CloudFormation console or use AWS CDK command like below –
cdk destroy
For more information on the AWS CDK commands, please check the here or sample here.
Summary
In this post, I demonstrated how to build a CI/CD pipeline for your serverless application with AWS CodePipeline by utilizing AWS CDK with AWS CodeArtifact. Please check the documentation here for an in-depth explanation regarding other package managers and the getting started guide.
As retail sales, products, and customers continue to expand online, we’ve seen a trend towards releasing products in limited quantities to larger audiences. Demand of these products can be high, due to limited production capacity, venue capacity limits, or product exclusivity. Providers can then experience spikes in transaction volume, especially when multiple event sales occur simultaneously. This increased traffic and load can negatively impact customer experience and infrastructure.
To enhance the customer experience when releasing tickets to high demand events, SeatGeek has introduced a prioritization and queueing mechanism based on event type, venue, and customer type. For example, Dallas Cowboys’ tickets could have a different priority depending on seat type, or whether it’s a suite or a general admission ticket.
SeatGeek previously used a third-party waiting room solution, but it presented a number of shortcomings:
Lack of configuration and customization capabilities
More manual process that resulted in limiting the number of concurrent events could be set up
Inability to capture custom insights and metrics (for example, how long was the customer waiting in the queue before they dropped?)
Resolving these issues is crucial to improve the customer experience and audience engagement. SeatGeek decided to build a custom solution on AWS, in order to create a more robust system and address these third-party issues.
Virtual Waiting Room overview
Our solution redirects overflow customers waiting to complete their purchase to a separate queue. Personalized content is presented to improve the waiting experience. Public services such as school or voting registration can use this solution for limited spots or time slot management.
Figure 1. User path through a Virtual Waiting Room
During a sale event, all customers begin their purchase journey in the Virtual Waiting Room (see Figure 1). When the sale starts, they will be moved from the Virtual Waiting Room to the ticket selection page. This is referred to as the Protected Zone. Here is where the customer will complete their purchase. The Protected Zone is a group of customized pages that guide the user through the purchasing process.
When the virtual waiting room is enabled, it can operate in three modes: Waiting Room mode, Queueing mode, or a combination of the two.
In Waiting Room mode, any request made to an event ticketing page before the designated start time of sale is routed to a separate screen. This displays the on-sale information and other marketing materials. At the desired time, users are then routed to the event page at a predefined throughput rate. Figure 2 shows a screenshot of the Waiting Room mode:
Figure 2. Waiting Room mode
In Queueing mode, the event can be configured to allow a preset number of concurrent users to access the Protected Zone. Those beyond that preconfigured number wait in a First-In-First-Out (FIFO) queue. Exempt users, such as the event coordinator, can bypass the queue for management and operational visibility.
Figure 3. Queueing mode flow
Figure 4. Queueing mode
In some cases, the two modes can work together sequentially. This can occur when the Waiting Room mode is used before a sale starts and the Queueing mode takes over to control flow.
Once the customers move to the front of the queue, they are next in line for the Protected Zone. A ticket selection page, shown in Figure 5, must be protected from an overflow of customers, which could result in overselling.
Figure 5. Ticket selection page
Virtual Waiting Room implementation
In the following diagram, you can see the AWS services and flow that SeatGeek implemented for the Virtual Waiting Room solution. When a SeatGeek customer requests a protected resource like a concert ticket, a gate keeper application scans to see if the resource has an active waiting room. It also confirms if the configuration rules are satisfied in order to grant the customer access. If the customer isn’t allowed access to the protected resource for whatever reason, then that customer is redirected to the Virtual Waiting Room.
Figure 6. Architecture overview
SeatGeek built this initial iteration of the gate keeper service on Fastly’s Computer@Edge service to leverage its existing content delivery network (CDN) investment. However, similar functionality could be built using Amazon CloudFront and AWS Lambda@Edge.
The Bouncer, handling the user flow into either the protected zone or the waiting room, consists of 3 components – Amazon API Gateway, AWS Lambda, and a Token Service. The token service is at the heart of the Waiting Room’s core logic. Before a concert event sale goes live at SeatGeek, the number of access tokens generated is equivalent to the number of available tickets. The order of assigning access tokens to customers in the waiting room can be based on FIFO or customer status (VIP customers first). Tokens are allocated when the customer is admitted to the waiting room and expire when tickets are purchased or when the customer exits.
For data storage, SeatGeek uses Amazon DynamoDB to monitor protected resources, tokens, and queues. The key tables are:
Protected Zone table: This table contains metadata about available protected zones
Counters table: Monitors the number of access tokens issued per minute for a specific protected zone
User Connection table: Every time a customer connects to the Amazon API Gateway, a record is created in this table recording their visitor token and connection ID using AWS Lambda
Queue table: This is the main table where the visitor token to access token mapping is saved
For analytics, two types of metrics are captured to ensure operational integrity:
System metrics: These are built into the AWS runtime infrastructure, and are stored in Amazon CloudWatch. These metrics provide telemetry of each component of the solution: Lambda latency, DynamoDB throttle (read and write), API Gateway connections, and more.
Business metrics: These are used to understand previous user behavior to improve infrastructure provisioning and user experiences. SeatGeek uses an AWS Lambda function to capture metrics from data in a DynamoDB stream. It then forwards it to Amazon Timestream for time-based analytics processing. Metrics captured include queue length, waiting time per queue, number of users in the protected zone, and more.
For historical needs, long-lived data can be streamed to tiered data storage options such as Amazon Simple Storage Service (S3). They can then be used later for other purposes, such as auditing and data analysis.
Considerations and enhancements for the Virtual Waiting Room
Tokens: We recommend using first-party cookies and token confirmations to track the number of sessions. Use the same token at the same time to stop users from checking out multiple times and cutting in line.
DDoS protection: Token and first-party cookies usage must also comply with General Data Protection Regulation (GDPR) and California Consumer Privacy Act (CCPA) guidelines depending on the geographic region. This system is susceptible to DDoS attacks, XSS attacks, and others, like any web-based solution. But these threats can be mitigated by using AWS Shield, a DDoS protection service, and AWS WAF – Web Application Firewall. For more information on DDoS protection, read this security blog post.
Marketing: Opportunities to educate the customer about the venue or product(s) while they wait in the Virtual Waiting Room (for example, parking or food options).
Alerts: Customers can be alerted via SMS or voice when their turn is up by using Amazon Pinpoint as a marketing communication service.
Conclusion
We have shown how to set up a Virtual Waiting Room for your customers. This can be used to improve the customer experience while they wait to complete their registration or purchase through your website. The solution takes advantage of several AWS services like AWS Lambda, Amazon DynamoDB, and Amazon Timestream.
While this references a retail use case, the waiting room concept can be used whenever throttling access to a specific resource is required. It can be useful during an infrastructure or application outage. You can use it during a load spike, while more resources (EC2 instances) are being launched. To block access to an unreleased feature or product, temporarily place all users in the waiting room and let them in as needed per your own configuration.
Providing a friendly, streamlined, and responsive user experience, even during peak load times, is a valuable way to keep existing customers and gain new ones.
The global retail market continues to grow larger and the influx of consumer data increases daily. The rise in volume, variety, and velocity of data poses challenges with demand forecasting and inventory planning. Outdated systems generate inaccurate demand forecasts. This results in multiple challenges for retailers. They are faced with over-stocking and lost sales, and often have to rely on increased levels of safety stock to avoid losing sales.
A recent McKinsey study indicates that AI-based forecasting improves forecasting accuracy by 10–20 percent. This translates to revenue increases of 2–3 percent. An accurate forecasting system can also help determine ideal inventory levels and better predict the impact of sales promotions. It provides a single view of demand across all channels and a better customer experience overall.
In this blog post, we will show you how to build a reliable retail forecasting system. We will use Amazon Forecast, and an AWS-vetted solution called Improving Forecast Accuracy with Machine Learning. This is an AWS Solutions Implementation that automatically produces forecasts and generates visualization dashboards. This solution can be extended to use cases across a variety of industries.
Improving Forecast Accuracy solution architecture
This post will illustrate a retail environment that has an SAP S/4 HANA system for overall enterprise resource planning (ERP). We will show a forecasting solution based on Amazon Forecast to predict demand across product categories. The environment also has a unified platform for customer experience provided by SAP Customer Activity Repository (CAR). Replenishment processes are driven by SAP Forecasting and Replenishment (F&R), and SAP Fiori apps are used to manage forecasts.
The solution is divided into four parts: Data extraction and preparation, Forecasting and monitoring, Data visualization, and Forecast import and utilization in SAP.
Figure 1. Notional architecture for improving forecasting accuracy solution and SAP integration
Related data that can potentially affect demand levels can be uploaded to Amazon S3. These could include seasonal events, promotions, and item price. Additional item metadata, such as product descriptions, color, brand, size may also be uploaded. Amazon Forecast provides built-in related time series data for holidays and weather. These three components together form the forecast inputs.
Forecasting and monitoring
An S3 event notification will be initiated when new datasets are uploaded to the input bucket. This in turn, starts an AWS Step Functions state machine. The state machine combines a series of AWS Lambda functions that build, train, and deploy machine learning models in Amazon Forecast. All AWS Step Functions logs are sent to Amazon CloudWatch. Administrators will be notified with the results of the AWS Step Functions through Amazon Simple Notification Service (SNS).
An AWS Glue job combines raw forecast input data, metadata, predictor backtest exports, and forecast exports. These all go into an aggregated view of forecasts in an S3 bucket. It is then translated to the format expected by the External Forecast import interface. Amazon Athena can be used to query forecast output in S3 using standard SQL queries.
Data visualization
Amazon QuickSight analyses can be created on a per-forecast basis. This provides users with forecast output visualization across hierarchies and categories of forecasted items. It also displays item-level accuracy metrics. Dashboards can be created from these analyses and shared within the organization. Additionally, data scientists and developers can prepare and process data, and evaluate Forecast outputs using an Amazon SageMaker Notebook Instance.
Forecast import and utilization in SAP
Amazon Forecast outputs located in Amazon S3 will be imported into the Unified Demand Forecast (UDF) module within the SAP Customer Activity Repository (CAR). You can read here about how to import external forecasts. An AWS Lambda function will be initiated when aggregated forecasts are uploaded to the S3 bucket. The Lambda function performs a remote function call (RFC) to the SAP system through the official SAP JCo Library. The SAP RFC credentials and connection information may be stored securely inside AWS Secrets Manager and read on demand to establish connectivity.
Once imported, forecast values from the solution can be retrieved by SAP Forecasting and Replenishment (F&R). They will be consumed as an input to replenishment processes, which consist of requirements calculation and requirement quantity optimization. SAP F&R calculates requirements based on the forecast, the current stock, and the open purchase orders. The requirement quantity then may be improved in accordance with optimization settings defined in SAP F&R.
To illustrate how beneficial this solution can be for retail organizations, let’s consider AnyCompany Stores, Inc. This is a hypothetical customer and leader in the retailer industry with 985 stores across the United States. They struggle with issues stemming from their existing forecasting implementation. That implementation only understands certain categories and does not factor in the entire product portfolio. Additionally, it is limited to available demand history and does not consider related information that may affect forecasts. AnyCompany Stores is looking to improve their demand forecasting system.
Using Improving Forecast Accuracy with Machine Learning, AnyCompany Stores can easily generate AI-based forecasts at appropriate quantiles to address sensitivities associated with respective product categories. This mitigates inconsistent inventory buys, overstocks, out-of-stocks, and margin erosion. The solution also considers all relevant related data in addition to the historical demand data. This ensures that generated forecasts are accurate for each product category.
The generated forecasts may be used to complement existing forecasting and replenishment processes. With an improved forecasting solution, AnyCompany Stores will be able to meet demand, while holding less inventory and improving customer experience. This also helps ensure that potential demand spikes are accurately captured, so staples will always be in stock. Additionally, the company will not overstock expensive items with short shelf lives that are likely to spoil.
Conclusion
In this post, we explored how to implement an accurate retail forecasting solution using a ready-to-deploy AWS Solution. We use generated forecasts to drive inventory replenishment optimization and improve customer experience. The solution can be extended to inventory, workforce, capacity, and financial planning.
We showcase one of the ways in which Improving Forecast Accuracy with Machine Learning may be extended for a use case in the retail industry. If your organization would like to improve business outcomes with the power of forecasting, explore customizing this solution to fit your unique needs.
In this post, we describe the AWS services that you can use to both detect and protect your data stored in Amazon Simple Storage Service (Amazon S3). When you analyze security in depth for your Amazon S3 storage, consider doing the following:
Monitor and remediate configuration changes with AWS Config
Using these additional AWS services along with Amazon S3 can improve your security posture across your accounts.
Audit and restrict Amazon S3 access with IAM Access Analyzer
IAM Access Analyzer allows you to identify unintended access to your resources and data. Users and developers need access to Amazon S3, but it’s important for you to keep users and privileges accurate and up to date.
Amazon S3 can often house sensitive and confidential information. To help secure your data within Amazon S3, you should be using AWS Key Management Service (AWS KMS) with server-side encryption at rest for Amazon S3. It is also important that you secure the S3 buckets so that you only allow access to the developers and users who require that access. Bucket policies and access control lists (ACLs) are the foundation of Amazon S3 security. Your configuration of these policies and lists determines the accessibility of objects within Amazon S3, and it is important to audit them regularly to properly secure and maintain the security of your Amazon S3 bucket.
IAM Access Analyzer can scan all the supported resources within a zone of trust. Access Analyzer then provides you with insight when a bucket policy or ACL allows access to any external entities that are not within your organization or your AWS account’s zone of trust.
The example in Figure 1 shows creating an analyzer with the zone of trust as the current account, but you can also create an analyzer with the organization as the zone of trust.
Figure 1: Creating IAM Access Analyzer and zone of trust
After you create your analyzer, IAM Access Analyzer automatically scans the resources in your zone of trust and returns the findings from your Amazon S3 storage environment. The initial scan shown in Figure 2 shows the findings of an unsecured S3 bucket.
Figure 2: Example of unsecured S3 bucket findings
For each finding, you can decide which action you would like to take. As shown in figure 3, you are given the option to archive (if the finding indicates intended access) or take action to modify bucket permissions (if the finding indicates unintended access).
Figure 3: Displays choice of actions to take
After you address the initial findings, Access Analyzer monitors your bucket policies for changes, and notifies you of access issues it finds. Access Analyzer is regional and must be enabled in each AWS Region independently.
Classify and secure sensitive data with Macie
Organizational compliance standards often require the identification and securing of sensitive data. Your organization’s sensitive data might contain personally identifiable information (PII), which includes things such as credit card numbers, birthdates, and addresses.
Macie is a data security and privacy service offered by AWS that uses machine learning and pattern matching to discover the sensitive data stored within Amazon S3. You can define your own custom type of sensitive data category that might be unique to your business or use case. Macie will automatically provide an inventory of S3 buckets and alert you of unprotected sensitive data.
Figure 4 shows a sample result from a Macie scan in which you can see important information regarding Amazon S3 public access, encryption settings, and sharing.
Figure 4: Sample results from a Macie scan
In addition to finding potential sensitive data, Macie also gives you a severity score based on the privacy risk, as shown in the example data in Figure 5.
Figure 5: Example Macie severity scores
When you use Macie in conjunction with AWS Step Functions, you can also automatically remediate any issues found. You can use this combination to help meet regulations such as General Data Protection Regulation (GDPR) and Health Insurance Portability and Accountability Act (HIPAA). Macie allows you to have constant visibility of sensitive data within your Amazon S3 storage environment.
When you deploy Macie in a multi-account configuration, your usage is rolled up to the master account to provide the total usage for all accounts and a breakdown across the entire organization.
Detect malicious access patterns with GuardDuty
Your customers and users can commit thousands of actions each day on S3 buckets. Discerning access patterns manually can be extremely time consuming as the volume of data increases. GuardDuty uses machine learning, anomaly detection, and integrated threat intelligence to analyze billions of events across multiple accounts and uses data collected in AWS CloudTrail logs for S3 data events as well as S3 access logs, VPC Flow Logs, and DNS logs. GuardDuty can be configured to analyze these logs and notify you of suspicious activity, such as unusual data access patterns, unusual discovery API calls, and more. After you receive a list of findings on these activities, you will be able to make informed decisions to secure your S3 buckets.
Figure 6 shows a sample list of findings returned by GuardDuty which shows the finding type, resource affected, and count of occurrences.
Figure 6: Example GuardDuty list of findings
You can select one of the results in Figure 6 to see the IP address and details associated from this potential malicious IP caller, as shown in Figure 7.
Figure 7: GuardDuty Malicious IP Caller detailed findings
Monitor and remediate configuration changes with AWS Config
Configuration management is important when securing Amazon S3, to prevent unauthorized users from gaining access. It is important that you monitor the configuration changes of your S3 buckets, whether the changes are intentional or unintentional. AWS Config can track all configuration changes that are made to an S3 bucket. For example, if an S3 bucket had its permissions and configurations unexpectedly changed, using AWS Config allows you to see the changes made, as well as who made them.
AWS Config can be used in conjunction with a service called AWS Lambda. If an S3 bucket is noncompliant, AWS Config can trigger a preprogrammed Lambda function and then the Lambda function can resolve those issues. This combination can be used to reduce your operational overhead in maintaining compliance within your S3 buckets.
Figure 8 shows a sample of AWS Config managed rules selected for configuration monitoring and gives a brief description of what the rule does.
Figure 8: Sample selections of AWS Managed Rules
Figure 9 shows a sample result of a non-compliant configuration and resource inventory listing the type of resource affected and the number of occurrences.
Figure 9: Example of AWS Config non-compliant resources
Conclusion
AWS has many offerings to help you audit and secure your storage environment. In this post, we discussed the particular combination of AWS services that together will help reduce the amount of time and focus your business devotes to security practices. This combination of services will also enable you to automate your responses to any unwanted permission and configuration changes, saving you valuable time and resources to dedicate elsewhere in your organization.
Organizations with online businesses have to be on guard constantly for fraudulent activity, such as fake accounts or payments made with stolen credit cards. One way they try to identify fraudsters is by using fraud detection applications. Some of these applications use machine learning (ML).
A common challenge with ML is the need for a large, labeled dataset to create ML models to detect fraud. You will also need the skill set and infrastructure to build, train, deploy, and scale your ML model.
In this post, I discuss how to perform fraud detection on a batch of many events using Amazon Fraud Detector. Amazon Fraud Detector is a fully managed service that can identify potentially fraudulent online activities. These can be situations such as the creation of fake accounts or online payment fraud. Unlike general-purpose ML packages, Amazon Fraud Detector is designed specifically to detect fraud. You can analyze fraud transaction prediction results by using Amazon Athena and Amazon QuickSight. I will explain how to review fraud using Amazon Fraud Detector and Amazon SageMaker built-in algorithms.
Batch fraud prediction use cases
You can use a batch predictions job in Amazon Fraud Detector to get predictions for a set of events that do not require real-time scoring. You may want to generate fraud predictions for a batch of events. These might be payment fraud, account take over or compromise, and free tier misuse while performing an offline proof-of-concept. You can also use batch predictions to evaluate the risk of events on an hourly, daily, or weekly basis depending upon your business need.
Batch fraud insights using Amazon Fraud Detector
Organizations such as ecommerce companies and credit card companies use ML to detect the fraud. Some of the most common types of fraud include email account compromise (personal or business), new account fraud, and non-payment or non-delivery (which includes compromised card numbers).
Amazon Fraud Detector automates the time-consuming and expensive steps to build, train, and deploy an ML model for fraud detection. Amazon Fraud Detector customizes each model it creates to your dataset, making the accuracy of models higher than current one-size-fits-all ML solutions. And because you pay only for what you use, you can avoid large upfront expenses.
If you want to analyze fraud transactions after the fact, you can perform batch fraud predictions using Amazon Fraud Detector. Then you can store fraud prediction results in an Amazon S3 bucket. Amazon Athena helps you analyze the fraud prediction results. You can create fraud prediction visualization dashboards using Amazon QuickSight.
The following diagram illustrates how to perform fraud predictions for a batch of events and analyze them using Amazon Athena.
Figure 1. Example architecture for analyzing fraud transactions using Amazon Fraud Detector and Amazon Athena
The architecture flow follows these general steps:
Create and publish a detector. First create and publish a detector using Amazon Fraud Detector. It should contain your fraud prediction model and rules. For additional details, see Get started (console).
Create an input Amazon S3 bucket and upload your CSV file. Prepare a CSV file that contains the events you want to evaluate. Then upload your CSV file into the input S3 bucket. In this file, include a column for each variable in the event type associated with your detector. In addition, include columns for EVENT_ID, ENTITY_ID, EVENT_TIMESTAMP, ENTITY_TYPE. Refer to Amazon Fraud Detector batch input and output files for more details. Read Create a variable for additional information on Amazon Fraud Detector variable data types and formatting.
Create an output Amazon S3 bucket. Create an output Amazon S3 bucket to store your Amazon Fraud Detector prediction results.
Perform a batch prediction. You can use a batch predictions job in Amazon Fraud Detector to get predictions for a set of events that do not require real-time scoring. Read more here about Batch predictions.
Review your prediction results. Review your results in the CSV file that is generated and stored in the Amazon S3 output bucket.
Analyze your fraud prediction results.
After creating a Data Catalog by using AWS Glue, you can use Amazon Athena to analyze your fraud prediction results with standard SQL.
You can develop user-friendly dashboards to analyze fraud prediction results using Amazon QuickSight by creating new datasets with Amazon Athena as your data source.
Fraud detection using Amazon SageMaker
The Amazon Web Services (AWS) Solutions Implementation, Fraud Detection Using Machine Learning, enables you to run automated transaction processing. This can be on an example dataset or your own dataset. The included ML model detects potentially fraudulent activity and flags that activity for review. The diagram following presents the architecture you can automatically deploy using the solution’s implementation guide and accompanying AWS CloudFormation template.
SageMaker provides several built-in machine learning algorithms that you can use for a variety of problem types. This solution leverages the built-in Random Cut Forest algorithm for unsupervised learning and the built-in XGBoost algorithm for supervised learning. In the SageMaker Developer Guide, you can see how Random Cut Forest and XGBoost algorithms work.
Figure 2. Fraud detection using machine learning architecture on AWS
This architecture can be segmented into three phases.
Develop a fraud prediction machine learning model. The AWS CloudFormation template deploys an example dataset of credit card transactions contained in an Amazon Simple Storage Service (Amazon S3) bucket. An Amazon SageMaker notebook instance with different ML models will be trained on the dataset.
Perform fraud prediction. The solution also deploys an AWS Lambda function that processes transactions from the example dataset. It invokes the two SageMaker endpoints that assign anomaly scores and classification scores to incoming data points. An Amazon API Gateway REST API initiates predictions using signed HTTP requests. An Amazon Kinesis Data Firehose delivery stream loads the processed transactions into another Amazon S3 bucket for storage. The solution also provides an example of how to invoke the prediction REST API as part of the Amazon SageMaker notebook.
Analyze fraud transactions. Once the transactions have been loaded into Amazon S3, you can use analytics tools and services for visualization, reporting, ad-hoc queries, and more detailed analysis.
By default, the solution is configured to process transactions from the example dataset. To use your own dataset, you must modify the solution. For more information, see Customization.
Conclusion
In this post, we showed you how to analyze fraud transactions using Amazon Fraud Detector and Amazon Athena. You can build fraud insights using Amazon Fraud Detector and Amazon SageMaker built-in algorithms Random Cut Forest and XGBoost. With the information in this post, you can build your own fraud insights models on AWS. You’ll be able to detect fraud faster. Finally, you’ll be able to solve a variety of fraud types. These can be new account fraud, online transaction fraud, and fake reviews, among others.
Read more and get started on building fraud detection models on AWS.
In this post, I show you how to implement a centralized patching solution across Amazon Web Services (AWS) Regions by using AWS Systems Manager in your AWS account. This helps you to initiate, track, and manage your patching events across AWS Regions from one centralized place.
Enterprises with large, multi-Region hybrid environments must determine whether they want to centralize patching by using Systems Manager to map all their instances under one Region, or decentralize patching to each Region where instances are deployed. Both approaches have trade-offs in terms of cost and operation overhead. For centralized patching under one Region, you must enable the Systems Manager advanced-instances tier if your running instances count exceeds the registration maximum for on-premises servers or VMs per AWS account per Region. (At the time of this blog post, the maximum count is set to 1,000). This tier is priced at a higher pay-as-you-go rate, but provides additional features on top of the standard-instances tier solution, such as the ability to connect to your hybrid machines by using Systems Manager Session Manager, Microsoft application patching, or other solutions. Using a decentralized patching approach, if you aren’t interested in advanced-tier features and have more instances than the AWS Region registration maximum that is allowed at the standard-tier level, you can distribute your instances across Regions and run it under the standard-tier section which is priced at a lower rate with respect to the advanced tier.
Solution overview
Figure 1 shows the architecture of the centralized patching solution across multiple Regions.
Figure 1: Solution architecture
The automated solution I provide in this post is focused on scheduling and patching managed instances across AWS Regions. Systems Manager Maintenance Windows initiates a series of steps for automated patching for the instances, regardless of which Regions the instances are in.
Here are the key building blocks for this solution:
AWS Lambda automatically runs your code without requiring you to provision or manage infrastructure. It can automatically scale your application by running code in response to each event. Also, you only pay for the compute time you consume, so you’re never paying for over-provisioned infrastructure.
Figure 2 shows the centralized patching solution for a multi-Region hybrid workflow in detail.
Figure 2: Detailed workflow diagram: Centralized patching solution for multi-Region and hybrid instances
You implement the solution as follows:
In a central management Region, configure a maintenance window with a custom Lambda function as a target, with a JSON payload input that defines your target Regions, custom SSM document information, and target resource groups.
Configure the Lambda function that will first filter out the target Regions where there are no instances mapped to resource groups, and then initiate the Systems Manager Automation API for the remaining Regions that have instances mapped to the resource groups.
Configure a Systems Manager Automation API to initiate Run Command in all target Regions according to the custom AWS document.
Configure the AWS custom automation document to call the AWS-RunPatchBaseline document against all instances for patching according to the resource group defined in the input payload JSON.
The sample solution provided by this blog requires that you set up Systems Manager in your account and resource groups in the target Regions. Before you get started, make sure you’ve completed all of the following steps:
Use AWS Resource Groups to create a resource group in each Region that you want to use as a target for patching, as shown in Figure 3. Each resource group must have the same name.
Figure 3: Sample resource group creation
Create or configure a Systems Manager-compatible instance. You need at least one EC2 instance that is configured for use with Systems Manager in order to complete this walkthrough. This means that SSM Agent is installed on the instance, and an AWS Identity and Access Management (IAM) instance profile for Systems Manager is attached to the instance. You must also add the tag target to the instance with the value DummyTarget, which will be used by Systems Manager Maintenance Windows to run the Lambda function against this target.
Step 2: Deploy the CloudFormation template
In this next step, you deploy a CloudFormation template to implement the centralized patching solution across Regions in your account. Make sure you deploy the template within the AWS account and Region from which you want to centralize patching coordination.
To deploy the CloudFormation stack
Choose the following Launch Stack button to launch a CloudFormation stack in your account.
Note: The stack will launch in the N. Virginia (us-east-1) Region. It takes approximately 15 minutes for the CloudFormation stack to complete. To deploy this solution into other AWS Regions, download the solution’s CloudFormation template and deploy it to the selected Region.
In the AWS CloudFormation console, choose the Select Template form, and then choose Next.
On the Specify Details page, provide the following input parameters. You can modify the default values to customize the solution for your environment.
Input parameter
Description
Duration
The duration for the maintenance window automation job, in hours. The default is 5.
OwnerInformation
The owner information for the maintenance window. The default is Patch Management Team.
Schedule
The schedule for the owner of the maintenance window, in the form of either a cron or rate expression). The default is cron(0 4 ? * SUN *).
TimeZone
The time zone for the maintenance window automation job. The default is S/EasternU.
Figure 4: An example of the values entered for the template parameters
After you’ve entered values for all of the input parameters, choose Next.
On the Options page, keep the defaults, and then choose Next.
On the Review page, under Capabilities, select the check box next to I acknowledge that AWS CloudFormation might create IAM resources with custom names, and then choose Create stack.
After the Status field for the CloudFormation stack changes to CREATE_COMPLETE, as shown in Figure 6, the solution is implemented and is ready for testing.
Figure 6: Completed deployment of the AWS CloudFormation stack
Step 3: Create a test patching event
After the CloudFormation stack has completed deployment, an AWS maintenance window is created. To test the centralized patching solution, you can use this maintenance window to initiate patching across Regions.
(Optional) To create a test patching event, edit the Lambda task as follows. Under the Tasks tab, add the following JSON data as the payload, and update the following parameters with your own data: resource group, AutomationAssumeRole ARN, MaxConcurrency, MaxErrors, Operation (Scan/ Install), and Regions, as needed for the target environment.
Wait for the next execution time for the maintenance window. On the History tab, you should see status Success to indicate that patching is complete, as shown in Figure 7.
Figure 7: The History tab for the maintenance window, showing successful patching
To see more details related to the completed automations, look on the Automation Executions tab, shown in Figure 8.
Figure 8: The Executions tab showing details
Congratulations! You’ve successfully deployed and tested a centralized patching solution for an AWS multi-Region hybrid environment. In order to fully implement this solution, you’ll need to add the resource groups in all your target Regions and update the payload JSON in Systems Manager Maintenance Windows.
Summary
You’ve learned how to use Systems Manager to centralize patching across multiple AWS Regions and to include on-premises instances in your patching solution. All of the code for this solution is available as part of an CloudFormation template. Feel free to play around with the code; we hope it helps you learn more about automated security remediation. You can adjust the code to better fit your unique environment, or extend the code with additional steps. For example, you could extend it across accounts and also create a custom Systems Manager document to run across Regions.
If you have feedback about this post, submit comments in the Comments section below. If you have questions about using this solution, contact AWS Support.
Want more AWS Security how-to content, news, and feature announcements? Follow us on Twitter.
Securing sensitive information is a high priority for organizations for many reasons. At the same time, organizations are looking for ways to empower development teams to stay agile and innovative. Centralized security teams strive to create systems that align to the needs of the development teams, rather than mandating how those teams must operate.
Security teams who create automation for the discovery of sensitive data have some issues to consider. If development teams are able to self-provision data storage, how does the security team protect that data? If teams have a business need to store sensitive data, they must consider how, where, and with what safeguards that data is stored.
Data classification is part of the security pillar of a Well-Architected application. Following the guidelines provided in the AWS Well-Architected Framework, we can develop a resource-tagging scheme that fits our needs.
Overview of decentralized data validation system
In our example, we have multiple levels of data classification that represent different levels of risk associated with each classification. When a software development team creates a new Amazon Simple Storage Service (S3) bucket, they are responsible for labeling that bucket with a tag. This tag represents the classification of data stored in that bucket. The security team must maintain a system to validate that the data in those buckets meets the classification specified by the development teams.
This separation of roles and responsibilities for development and security teams who work independently requires a validation system that’s decoupled from S3 bucket creation. It should automatically detect new buckets or data in the existing buckets, and validate the data against the assigned classification tags. It should also notify the appropriate development teams of misclassified or unclassified buckets in a timely manner. These notifications can be through standard notification channels, such as email or Slack channel notifications.
Validation and alerts with AWS services
Figure 1. Validation system for data classification
We assume that teams are permitted to create S3 buckets and we will use AWS Config to enforce the following required tags: DataClassification and SupportSNSTopic. The DataClassification tag indicates what type of data is allowed in the bucket. The SupportSNSTopic tag indicates an Amazon Simple Notification Service (SNS) topic. If there are issues found with the data in the bucket, a message is published to the topic, and Amazon SNS will deliver an alert. For example, if there is personally identifiable information (PII) data in a bucket that is classified as non-sensitive, the system will alert the owners of the bucket.
Macie is configured to scan all S3 buckets on a scheduled basis. This configuration ensures that any new bucket and data placed in the buckets is analyzed the next time the Macie job runs.
Macie provides several managed data identifiers for discovering and classifying the data. These include bank account numbers, credit card information, authentication credentials, PII, and more. You can also create custom identifiers (or rules) to gather information not covered by the managed identifiers.
Macie integrates with Amazon EventBridge to allow us to capture data classification events and route them to one or more destinations for reporting and alerting needs. In our configuration, the event initiates an AWS Lambda. The Lambda function is used to validate the data classification inferred by Macie against the classification specified in the DataClassification tag using custom business logic. If a data classification violation is found, the Lambda then sends a message to the Amazon SNS topic specified in the SupportSNSTopic tag.
The Lambda function also creates custom metrics and sends those to Amazon CloudWatch. The metrics are organized by engineering team and severity. This allows the security team to create a dashboard of metrics based on the Macie findings. The findings can also be filtered per engineering team and severity to determine which teams need to be contacted to ensure remediation.
Conclusion
This solution provides a centralized security team with the tools it needs. The team can validate the data classification of an Amazon S3 bucket that is self-provisioned by a development team. New Amazon S3 buckets are automatically included in the Macie jobs and alerts. These are only sent out if the data in the bucket does not conform to the classification specified by the development team. The data auditing process is loosely coupled with the Amazon S3 Bucket creation process, enabling self-service capabilities for development teams, while ensuring proper data classification. Your teams can stay agile and innovative, while maintaining a strong security posture.
In this blog post, we show you how to set up end-to-end encryption on Amazon Elastic Kubernetes Service (Amazon EKS) with AWS Certificate Manager Private Certificate Authority. For this example of end-to-end encryption, traffic originates from your client and terminates at an Ingress controller server running inside a sample app. By following the instructions in this post, you can set up an NGINX ingress controller on Amazon EKS. As part of the example, we show you how to configure an AWS Network Load Balancer (NLB) with HTTPS using certificates issued via ACM Private CA in front of the ingress controller.
AWS Private CA supports an open source plugin for cert-manager that offers a more secure certificate authority solution for Kubernetes containers. cert-manager is a widely-adopted solution for TLS certificate management in Kubernetes. Customers who use cert-manager for application certificate lifecycle management can now use this solution to improve security over the default cert-manager CA, which stores keys in plaintext in server memory. Customers with regulatory requirements for controlling access to and auditing their CA operations can use this solution to improve auditability and support compliance.
Solution components
Kubernetes is an open-source system for automating the deployment, scaling, and management of containerized applications.
Amazon EKS is a managed service that you can use to run Kubernetes on Amazon Web Services (AWS) without needing to install, operate, and maintain your own Kubernetes control plane or nodes.
cert-manager is an add on to Kubernetes to provide TLS certificate management. cert-manager requests certificates, distributes them to Kubernetes containers, and automates certificate renewal. cert-manager ensures certificates are valid and up-to-date, and attempts to renew certificates at an appropriate time before expiry.
ACM Private CA enables the creation of private CA hierarchies, including root and subordinate CAs, without the investment and maintenance costs of operating an on-premises CA. With ACM Private CA, you can issue certificates for authenticating internal users, computers, applications, services, servers, and other devices, and for signing computer code. The private keys for private CAs are stored in AWS managed hardware security modules (HSMs), which are FIPS 140-2 certified, providing a better security profile compared to the default CAs in Kubernetes. Private certificates help identify and secure communication between connected resources on private networks such as servers, mobile and IoT devices, and applications.
AWS Private CA Issuer plugin. Kubernetes containers and applications use digital certificates to provide secure authentication and encryption over TLS. With this plugin, cert-manager requests TLS certificates from Private CA. The integration supports certificate automation for TLS in a range of configurations, including at the ingress, on the pod, and mutual TLS between pods. You can use the AWS Private CA Issuer plugin with Amazon Elastic Kubernetes Service, self managed Kubernetes on AWS, and Kubernetes on-premises.
An AWS Application Load Balancer (ALB) when you create a Kubernetes Ingress.
An AWS Network Load Balancer (NLB) when you create a Kubernetes Service of type LoadBalancer.
Different points for terminating TLS in Kubernetes
How and where you terminate your TLS connection depends on your use case, security policies, and need to comply with regulatory requirements. This section talks about four different use cases that are regularly used for terminating TLS. The use cases are illustrated in Figure 1 and described in the text that follows.
Figure 1: Terminating TLS at different points
At the load balancer: The most common use case for terminating TLS at the load balancer level is to use publicly trusted certificates. This use case is simple to deploy and the certificate is bound to the load balancer itself. For example, you can use ACM to issue a public certificate and bind it with AWS NLB. You can learn more from How do I terminate HTTPS traffic on Amazon EKS workloads with ACM?
At the ingress: If there is no strict requirement for end-to-end encryption, you can offload this processing to the ingress controller or the NLB. This helps you to optimize the performance of your workloads and make them easier to configure and manage. We examine this use case in this blog post.
On the pod: In Kubernetes, a pod is the smallest deployable unit of computing and it encapsulates one or more applications. End-to-end encryption of the traffic from the client all the way to a Kubernetes pod provides a secure communication model where the TLS is terminated at the pod inside the Kubernetes cluster. This could be useful for meeting certain security requirements. You can learn more from the blog post Setting up end-to-end TLS encryption on Amazon EKS with the new AWS Load Balancer Controller.
Mutual TLS between pods: This use case focuses on encryption in transit for data flowing inside Kubernetes cluster. For more details on how this can be achieved with Cert-manager using an Istio service mesh, please see the Securing Istio workloads with mTLS using cert-manager blog post. You can use the AWS Private CA Issuer plugin in conjunction with cert-manager to use ACM Private CA to issue certificates for securing communication between the pods.
In this blog post, we use a scenario where there is a requirement to terminate TLS at the ingress controller level, demonstrating the second example above.
Figure 2 provides an overall picture of the solution described in this blog post. The components and steps illustrated in Figure 2 are described fully in the sections that follow.
Verify that you have the latest versions of these tools installed before you begin.
Provision an Amazon EKS cluster
If you already have a running Amazon EKS cluster, you can skip this step and move on to install NGINX Ingress.
You can use the AWS Management Console or AWS CLI, but this example uses eksctl to provision the cluster. eksctl is a tool that makes it easier to deploy and manage an Amazon EKS cluster.
This example uses the US-EAST-2 Region and the T2 node type. Select the node type and Region that are appropriate for your environment. Cluster provisioning takes approximately 15 minutes.
To provision an Amazon EKS cluster
Run the following eksctl command to create an Amazon EKS cluster in the us-east-2 Region with Kubernetes version 1.19 and two nodes. You can change the Region to the one that best fits your use case.
Run the following command to determine the address that AWS has assigned to your NLB:
$ kubectl get service -n ingress-nginx
NAME TYPE CLUSTER-IP EXTERNAL-IP PORT(S) AGE
ingress-nginx-controller LoadBalancer 10.100.214.10 a3ebe22e7ca0522d1123456fbc92605c-8ac7f1d49be2fc42.elb.us-east-2.amazonaws.com 80:32598/TCP,443:30624/TCP 14s
ingress-nginx-controller-admission ClusterIP 10.100.118.1 <none> 443/TCP 14s
It can take up to 5 minutes for the load balancer to be ready. Once the external IP is created, run the following command to verify that traffic is being correctly routed to ingress-nginx:
curl http://a3ebe22e7ca0522d1123456fbc92605c-8ac7f1d49be2fc42.elb.us-east-2.amazonaws.com
<html>
<head><title>404 Not Found</title></head>
<body>
<center><h1>404 Not Found</h1></center>
<hr><center>nginx</center>
</body>
</html>
Note: Even though, it’s returning an HTTP 404 error code, in this case curl is still reaching the ingress controller and getting the expected HTTP response back.
Configure your DNS records
Once your load balancer is provisioned, the next step is to point the application’s DNS record to the URL of the NLB.
You can use your DNS provider’s console, for example Route53, and set a CNAME record pointing to your NLB. See CNAME record type for more details on how to setup a CNAME record using Route53.
This scenario uses the sample domain rsa-2048.example.com.
As you go through the scenario, replace rsa-2048.example.com with your registered domain.
Install cert-manager
cert-manager is a Kubernetes add-on that you can use to automate the management and issuance of TLS certificates from various issuing sources. It runs within your Kubernetes cluster and will ensure that certificates are valid and attempt to renew certificates at an appropriate time before they expire.
After you’ve deployed cert-manager, you can verify the installation by following these instructions. If all the above steps have completed without error, you’re good to go!
Note: If you’re planning to use Amazon EKS with Kubernetes pods running on AWS Fargate, please follow the cert-manager Fargate instructions to make sure cert-manager installation works as expected. AWS Fargate is a technology that provides on-demand, right-sized compute capacity for containers.
Install aws-privateca-issuer
The AWS PrivateCA Issuer plugin acts as an addon (see external cert configuration) to cert-manager that signs certificate requests using ACM Private CA.
To install aws-privateca-issuer
For installation, use the following helm commands:
Verify that the AWS Private CA Issuer is configured correctly by running the following command and ensure that it is in READY state with status as Running:
$ kubectl get pods --namespace aws-pca-issuer
NAME READY STATUS RESTARTS AGE
aws-pca-issuer-1622570742-56474c464b-j6k8s 1/1 Running 0 21s
You can check the chart configuration in the default values file.
Create an ACM Private CA
In this scenario, you create a private certificate authority in ACM Private CA with RSA 2048 selected as the key algorithm. You can create a CA using the AWS console, AWS CLI, or AWS CloudFormation.
To create an ACM Private CA
Download the CA certificate using the following command. Replace the <CA_ARN> and <Region> values with the values from the CA you created earlier and save it to a file named cacert.pem:
aws acm-pca get-certificate-authority-certificate --certificate-authority-arn <CA_ARN> -- region <region> --output text > cacert.pem
Once your private CA is active, you can proceed to the next step. You private CA will look similar to the CA in Figure 3.
Figure 3: Sample ACM Private CA
Set EKS node permission for ACM Private CA
In order to issue a certificate from ACM Private CA, add the IAM policy from the prerequisites to your EKS NodeInstanceRole. Replace the <CA_ARN> value with the value from the CA you created earlier:
Now that the ACM Private CA is active, you can begin requesting private certificates which can be used by Kubernetes applications. Use aws-privateca-issuer plugin to create the ClusterIssuer, which will be used with the ACM PCA to issue certificates.
Issuers (and ClusterIssuers) represent a certificate authority from which signed x509 certificates can be obtained, such as ACM Private CA. You need at least one Issuer or ClusterIssuer before you can start requesting certificates in your cluster. There are two custom resources that can be used to create an Issuer inside Kubernetes using the aws-privateca-issuer add-on:
AWSPCAIssuer is a regular namespaced issuer that can be used as a reference in your Certificate custom resources.
AWSPCAClusterIssuer is specified in exactly the same way, but it doesn’t belong to a single namespace and can be referenced by certificate resources from multiple different namespaces.
To create an Issuer in Amazon EKS
For this scenario, you create an AWSPCAClusterIssuer. Start by creating a file named cluster-issuer.yaml and save the following text in it, replacing <CA_ARN> and <Region> information with your own.
Verify the installation and make sure that the following command returns a Kubernetes service of kind AWSPCAClusterIssuer:
$ kubectl get AWSPCAClusterIssuer
NAME AGE
demo-test-root-ca 51s
Request the certificate
Now, you can begin requesting certificates which can be used by Kubernetes applications from the provisioned issuer. For more details on how to specify and request Certificate resources, please check Certificate Resources guide.
To request the certificate
As a first step, create a new namespace that contains your application and secret:
$ kubectl create namespace acm-pca-lab-demo
namespace/acm-pca-lab-demo created
Next, create a basic X509 private certificate for your domain. Create a file named rsa-2048.yaml and save the following text in it. Replace rsa-2048.example.com with your domain.
For the purpose of this scenario, you can create a new service—a simple “hello world” website that uses echoheaders that respond with the HTTP request headers along with some cluster details.
To deploy a demo application
Create a new file named hello-world.yaml with below content:
You should see an output similar to the following:
Hostname: hello-world-d8fbd49c6-9bczb
Pod Information:
-no pod information available-
Server values:
server_version=nginx: 1.13.3 - lua: 10008
Request Information:
client_address=192.162.32.64
method=GET
real path=/
query=
request_version=1.1
request_scheme=http
request_uri=http://rsa-2048.example.com:8080/
Request Headers:
accept=*/*
host=rsa-2048.example.com
user-agent=curl/7.62.0
x-forwarded-for=52.94.2.2
x-forwarded-host=rsa-2048.example.com
x-forwarded-port=443
x-forwarded-proto=https
x-real-ip=52.94.2.2
x-request-id=371b6fc15a45d189430281693cccb76e
x-scheme=https
Request Body:
-no body in request-…
This response is returned from the service running behind the Kubernetes Ingress controller and demonstrates that a successful TLS handshake happened at port 443 with https protocol.
You can use the following command to verify that the certificate issued earlier is being used for the SSL handshake:
You can also clean up from your Cloudformation console by deleting the stacks named eksctl-acm-pca-lab-nodegroup-acm-pca-nlb-lab-workers and eksctl-acm-pca-lab-cluster.
If you have feedback about this post, submit comments in the Comments section below. If you have questions about this post, start a new thread on the AWS Certificate Manager forum or contact AWS Support.
Want more AWS Security how-to content, news, and feature announcements? Follow us on Twitter.
In software as a service (SaaS) systems, which are designed to be used by multiple customers, isolating tenant data is a fundamental responsibility for SaaS providers. The practice of isolation of data in a multi-tenant application platform is called tenant isolation. In this post, we describe an approach you can use to achieve tenant isolation in Amazon Simple Storage Service (Amazon S3) and Amazon Aurora PostgreSQL-Compatible Edition databases by implementing attribute-based access control (ABAC). You can also adapt the same approach to achieve tenant isolation in other AWS services.
ABAC in Amazon Web Services (AWS), which uses tags to store attributes, offers advantages over the traditional role-based access control (RBAC) model. You can use fewer permissions policies, update your access control more efficiently as you grow, and last but not least, apply granular permissions for various AWS services. These granular permissions help you to implement an effective and coherent tenant isolation strategy for your customers and clients. Using the ABAC model helps you scale your permissions and simplify the management of granular policies. The ABAC model reduces the time and effort it takes to maintain policies that allow access to only the required resources.
The solution we present here uses the pool model of data partitioning. The pool model helps you avoid the higher costs of duplicated resources for each tenant and the specialized infrastructure code required to set up and maintain those copies.
Solution overview
In a typical customer environment where this solution is implemented, the tenant request for access might land at Amazon API Gateway, together with the tenant identifier, which in turn calls an AWS Lambda function. The Lambda function is envisaged to be operating with a basic Lambda execution role. This Lambda role should also have permissions to assume the tenant roles. As the request progresses, the Lambda function assumes the tenant role and makes the necessary calls to Amazon S3 or to an Aurora PostgreSQL-Compatible database. This solution helps you to achieve tenant isolation for objects stored in Amazon S3 and data elements stored in an Aurora PostgreSQL-Compatible database cluster.
Figure 1 shows the tenant isolation architecture for both Amazon S3 and Amazon Aurora PostgreSQL-Compatible databases.
Figure 1: Tenant isolation architecture diagram
As shown in the numbered diagram steps, the workflow for Amazon S3 tenant isolation is as follows:
An Aurora PostgreSQL-Compatible cluster with a database created.
Note: Make sure to note down the default master database user and password, and make sure that you can connect to the database from your desktop or from another server (for example, from Amazon Elastic Compute Cloud (Amazon EC2) instances).
A security group and inbound rules that are set up to allow an inbound PostgreSQL TCP connection (Port 5432) from Lambda functions. This solution uses regular non-VPC Lambda functions, and therefore the security group of the Aurora PostgreSQL-Compatible database cluster should allow an inbound PostgreSQL TCP connection (Port 5432) from anywhere (0.0.0.0/0).
Make sure that you’ve completed the prerequisites before proceeding with the next steps.
Deploy the solution
The following sections describe how to create the IAM roles, IAM policies, and Lambda functions that are required for the solution. These steps also include guidelines on the changes that you’ll need to make to the prerequisite components Amazon S3 and the Aurora PostgreSQL-Compatible database cluster.
Step 1: Create the IAM policies
In this step, you create two IAM policies with the required permissions for Amazon S3 and the Aurora PostgreSQL database.
Choose IAM, choose Policies, and then choose Create policy.
Use the following JSON policy document to create a second policy. This policy grants an IAM role permission to connect to an Aurora PostgreSQL-Compatible database through a database user that is IAM authenticated. Replace the placeholders with the appropriate Region, account number, and cluster resource ID of the Aurora PostgreSQL-Compatible database cluster, respectively.
Save the policy with the name sts-ti-demo-dbuser-policy.
Figure 3: Create the IAM policy for Aurora PostgreSQL database (sts-ti-demo-dbuser-policy)
Note: Make sure that you use the cluster resource ID for the clustered database. However, if you intend to adapt this solution for your Aurora PostgreSQL-Compatible non-clustered database, you should use the instance resource ID instead.
Step 2: Create the IAM roles
In this step, you create two IAM roles for the two different tenants, and also apply the necessary permissions and tags.
To create the IAM roles
In the IAM console, choose Roles, and then choose Create role.
On the Trusted entities page, choose the EC2 service as the trusted entity.
On the Permissions policies page, select sts-ti-demo-s3-access-policy and sts-ti-demo-dbuser-policy.
On the Tags page, add two tags with the following keys and values.
Tag key
Tag value
s3_home
tenant1_home
dbuser
tenant1_dbuser
On the Review screen, name the role assumeRole-tenant1, and then choose Save.
In the IAM console, choose Roles, and then choose Create role.
On the Trusted entities page, choose the EC2 service as the trusted entity.
On the Permissions policies page, select sts-ti-demo-s3-access-policy and sts-ti-demo-dbuser-policy.
On the Tags page, add two tags with the following keys and values.
Tag key
Tag value
s3_home
tenant2_home
dbuser
tenant2_dbuser
On the Review screen, name the role assumeRole-tenant2, and then choose Save.
Step 3: Create and apply the IAM policies for the tenants
In this step, you create a policy and a role for the Lambda functions. You also create two separate tenant roles, and establish a trust relationship with the role that you created for the Lambda functions.
To create and apply the IAM policies for tenant1
In the IAM console, choose Policies, and then choose Create policy.
Use the following JSON policy document to create the policy. Replace the placeholder <111122223333> with your AWS account number.
Save the policy with the name sts-ti-demo-assumerole-policy.
In the IAM console, choose Roles, and then choose Create role.
On the Trusted entities page, select the Lambda service as the trusted entity.
On the Permissions policies page, select sts-ti-demo-assumerole-policy and AWSLambdaBasicExecutionRole.
On the review screen, name the role sts-ti-demo-lambda-role, and then choose Save.
In the IAM console, go to Roles, and enter assumeRole-tenant1 in the search box.
Select the assumeRole-tenant1 role and go to the Trust relationship tab.
Choose Edit the trust relationship, and replace the existing value with the following JSON document. Replace the placeholder <111122223333> with your AWS account number, and choose Update trust policy to save the policy.
To verify that the policies are applied correctly for tenant1
In the IAM console, go to Roles, and enter assumeRole-tenant1 in the search box. Select the assumeRole-tenant1 role and on the Permissions tab, verify that sts-ti-demo-dbuser-policy and sts-ti-demo-s3-access-policy appear in the list of policies, as shown in Figure 4.
Figure 4: The assumeRole-tenant1 Permissions tab
On the Trust relationships tab, verify that sts-ti-demo-lambda-role appears under Trusted entities, as shown in Figure 5.
Figure 5: The assumeRole-tenant1 Trust relationships tab
On the Tags tab, verify that the following tags appear, as shown in Figure 6.
Tag key
Tag value
dbuser
tenant1_dbuser
s3_home
tenant1_home
Figure 6: The assumeRole-tenant1 Tags tab
To create and apply the IAM policies for tenant2
In the IAM console, go to Roles, and enter assumeRole-tenant2 in the search box.
Select the assumeRole-tenant2 role and go to the Trust relationship tab.
Edit the trust relationship, replacing the existing value with the following JSON document. Replace the placeholder <111122223333> with your AWS account number.
To verify that the policies are applied correctly for tenant2
In the IAM console, go to Roles, and enter assumeRole-tenant2 in the search box. Select the assumeRole-tenant2 role and on the Permissions tab, verify that sts-ti-demo-dbuser-policy and sts-ti-demo-s3-access-policy appear in the list of policies, you did for tenant1. On the Trust relationships tab, verify that sts-ti-demo-lambda-role appears under Trusted entities.
On the Tags tab, verify that the following tags appear, as shown in Figure 7.
Tag key
Tag value
dbuser
tenant2_dbuser
s3_home
tenant2_home
Figure 7: The assumeRole-tenant2 Tags tab
Step 4: Set up an Amazon S3 bucket
Next, you’ll set up an S3 bucket that you’ll use as part of this solution. You can either create a new S3 bucket or re-purpose an existing one. The following steps show you how to create two user homes (that is, S3 prefixes, which are also known as folders) in the S3 bucket.
In the AWS Management Console, go to Amazon S3 and select the S3 bucket you want to use.
Create two prefixes (folders) with the names tenant1_home and tenant2_home.
Place two test objects with the names tenant.info-tenant1_home and tenant.info-tenant2_home in the prefixes that you just created, respectively.
Step 5: Set up test objects in Aurora PostgreSQL-Compatible database
In this step, you create a table in Aurora PostgreSQL-Compatible Edition, insert tenant metadata, create a row level security (RLS) policy, create tenant users, and grant permission for testing purposes.
To set up Aurora PostgreSQL-Compatible
Connect to Aurora PostgreSQL-Compatible through a client of your choice, using the master database user and password that you obtained at the time of cluster creation.
Run the following commands to create a table for testing purposes and to insert a couple of testing records.
CREATE TABLE tenant_metadata (
tenant_id VARCHAR(30) PRIMARY KEY,
email VARCHAR(50) UNIQUE,
status VARCHAR(10) CHECK (status IN ('active', 'suspended', 'disabled')),
tier VARCHAR(10) CHECK (tier IN ('gold', 'silver', 'bronze')));
INSERT INTO tenant_metadata (tenant_id, email, status, tier)
VALUES ('tenant1_dbuser','[email protected]','active','gold');
INSERT INTO tenant_metadata (tenant_id, email, status, tier)
VALUES ('tenant2_dbuser','[email protected]','suspended','silver');
ALTER TABLE tenant_metadata ENABLE ROW LEVEL SECURITY;
Run the following command to query the newly created database table.
SELECT * FROM tenant_metadata;
Figure 8: The tenant_metadata table content
Run the following command to create the row level security policy.
CREATE POLICY tenant_isolation_policy ON tenant_metadata
USING (tenant_id = current_user);
Run the following commands to establish two tenant users and grant them the necessary permissions.
CREATE USER tenant1_dbuser WITH LOGIN;
CREATE USER tenant2_dbuser WITH LOGIN;
GRANT rds_iam TO tenant1_dbuser;
GRANT rds_iam TO tenant2_dbuser;
GRANT select, insert, update, delete ON tenant_metadata to tenant1_dbuser, tenant2_dbuser;
Run the following commands to verify the newly created tenant users.
SELECT usename AS role_name,
CASE
WHEN usesuper AND usecreatedb THEN
CAST('superuser, create database' AS pg_catalog.text)
WHEN usesuper THEN
CAST('superuser' AS pg_catalog.text)
WHEN usecreatedb THEN
CAST('create database' AS pg_catalog.text)
ELSE
CAST('' AS pg_catalog.text)
END role_attributes
FROM pg_catalog.pg_user
WHERE usename LIKE (‘tenant%’)
ORDER BY role_name desc;
Figure 9: Verify the newly created tenant users output
Step 6: Set up the AWS Lambda functions
Next, you’ll create two Lambda functions for Amazon S3 and Aurora PostgreSQL-Compatible. You also need to create a Lambda layer for the Python package PG8000.
To set up the Lambda function for Amazon S3
Navigate to the Lambda console, and choose Create function.
Choose Author from scratch. For Function name, enter sts-ti-demo-s3-lambda.
For Runtime, choose Python 3.7.
Change the default execution role to Use an existing role, and then select sts-ti-demo-lambda-role from the drop-down list.
Keep Advanced settings as the default value, and then choose Create function.
Copy the following Python code into the lambda_function.py file that is created in your Lambda function.
import json
import os
import time
def lambda_handler(event, context):
import boto3
bucket_name = os.environ['s3_bucket_name']
try:
login_tenant_id = event['login_tenant_id']
data_tenant_id = event['s3_tenant_home']
except:
return {
'statusCode': 400,
'body': 'Error in reading parameters'
}
prefix_of_role = 'assumeRole'
file_name = 'tenant.info' + '-' + data_tenant_id
# create an STS client object that represents a live connection to the STS service
sts_client = boto3.client('sts')
account_of_role = sts_client.get_caller_identity()['Account']
role_to_assume = 'arn:aws:iam::' + account_of_role + ':role/' + prefix_of_role + '-' + login_tenant_id
# Call the assume_role method of the STSConnection object and pass the role
# ARN and a role session name.
RoleSessionName = 'AssumeRoleSession' + str(time.time()).split(".")[0] + str(time.time()).split(".")[1]
try:
assumed_role_object = sts_client.assume_role(
RoleArn = role_to_assume,
RoleSessionName = RoleSessionName,
DurationSeconds = 900) #15 minutes
except:
return {
'statusCode': 400,
'body': 'Error in assuming the role ' + role_to_assume + ' in account ' + account_of_role
}
# From the response that contains the assumed role, get the temporary
# credentials that can be used to make subsequent API calls
credentials=assumed_role_object['Credentials']
# Use the temporary credentials that AssumeRole returns to make a connection to Amazon S3
s3_resource=boto3.resource(
's3',
aws_access_key_id=credentials['AccessKeyId'],
aws_secret_access_key=credentials['SecretAccessKey'],
aws_session_token=credentials['SessionToken']
)
try:
obj = s3_resource.Object(bucket_name, data_tenant_id + "/" + file_name)
return {
'statusCode': 200,
'body': obj.get()['Body'].read()
}
except:
return {
'statusCode': 400,
'body': 'error in reading s3://' + bucket_name + '/' + data_tenant_id + '/' + file_name
}
Under Basic settings, edit Timeout to increase the timeout to 29 seconds.
Edit Environment variables to add a key called s3_bucket_name, with the value set to the name of your S3 bucket.
Configure a new test event with the following JSON document, and save it as testEvent.
Choose Test to test the Lambda function with the newly created test event testEvent. You should see status code 200, and the body of the results should contain the data for tenant1.
Figure 10: The result of running the sts-ti-demo-s3-lambda function
Next, create another Lambda function for Aurora PostgreSQL-Compatible. To do this, you first need to create a new Lambda layer.
To set up the Lambda layer
Use the following commands to create a .zip file for Python package pg8000.
Note: This example is created by using an Amazon EC2 instance running the Amazon Linux 2 Amazon Machine Image (AMI). If you’re using another version of Linux or don’t have the Python 3 or pip3 packages installed, install them by using the following commands.
Choose Test to test the Lambda function with the newly created test event testEvent. You should see status code 200, and the body of the results should contain the data for tenant1.
Figure 12: The result of running the sts-ti-demo-pgdb-lambda function
Step 7: Perform negative testing of tenant isolation
You already performed positive tests of tenant isolation during the Lambda function creation steps. However, it’s also important to perform some negative tests to verify the robustness of the tenant isolation controls.
To perform negative tests of tenant isolation
In the Lambda console, navigate to the sts-ti-demo-s3-lambda function. Update the test event to the following, to mimic a scenario where tenant1 attempts to access other tenants’ objects.
Choose Test to test the Lambda function with the updated test event. You should see status code 400, and the body of the results should contain an error message.
Figure 13: The results of running the sts-ti-demo-s3-lambda function (negative test)
Navigate to the sts-ti-demo-pgdb-lambda function and update the test event to the following, to mimic a scenario where tenant1 attempts to access other tenants’ data elements.
Choose Test to test the Lambda function with the updated test event. You should see status code 400, and the body of the results should contain an error message.
Figure 14: The results of running the sts-ti-demo-pgdb-lambda function (negative test)
Cleaning up
To de-clutter your environment, remove the roles, policies, Lambda functions, Lambda layers, Amazon S3 prefixes, database users, and the database table that you created as part of this exercise. You can choose to delete the S3 bucket, as well as the Aurora PostgreSQL-Compatible database cluster that we mentioned in the Prerequisites section, to avoid incurring future charges.
Update the security group of the Aurora PostgreSQL-Compatible database cluster to remove the inbound rule that you added to allow a PostgreSQL TCP connection (Port 5432) from anywhere (0.0.0.0/0).
Conclusion
By taking advantage of attribute-based access control (ABAC) in IAM, you can more efficiently implement tenant isolation in SaaS applications. The solution we presented here helps to achieve tenant isolation in Amazon S3 and Aurora PostgreSQL-Compatible databases by using ABAC with the pool model of data partitioning.
If you run into any issues, you can use Amazon CloudWatch and AWS CloudTrail to troubleshoot. If you have feedback about this post, submit comments in the Comments section below.
To learn more, see these AWS Blog and AWS Support articles:
AWS Security Hub gives you a comprehensive view of your security alerts and security posture across your AWS accounts. With Security Hub, you have a single place that aggregates, organizes, and prioritizes your security alerts, or findings, from multiple AWS services. Security Hub lets you assign workflow statuses to these findings, which are NEW, NOTIFIED, SUPPRESSED, or RESOLVED. These statuses allow you to categorize which findings are open and need your attention.
In this blog post, we show how you can create automated suppression rules for specific types of findings in AWS Security Hub, such as ones that are an accepted risk by design, or have a compensating control. By automatically suppressing these findings that don’t require follow-up action from your security team, you can concentrate on investigating and remediating findings that are not yet resolved.
As an example of a finding that you may want to suppress, suppose that your development environment doesn’t need to have Amazon Virtual Private Cloud (VPC) Flow Logs enabled because it does not contain any sensitive data (that is, it is an accepted risk). However, your production environment must have VPC Flow Logs enabled. You can use this solution to automatically suppress the development environment findings regarding VPC Flow Logs not being enabled. Then, you can focus on responding to and remediating findings regarding the production environment VPC Flow Logs that are not enabled.
This solution uses an Amazon EventBridge rule to evaluate Security Hub findings based on predefined filters. An AWS Lambda function is the target of the rule, and is triggered to perform the suppression. The Lambda function calls the Security Hub BatchUpdateFindings API action to set the finding of interest to the SUPPRESSED status.
Prerequisites
This solution assumes that you have Security Hub and AWS Config enabled in your administrator and member AWS accounts. AWS Config is required to execute the rules that will generate the findings. You will also need to enable the AWS Foundational Security Best Practices standard, because the examples in this post rely on those findings. You should ensure that you have configured your administrator account to aggregate your Security Hub findings from across your AWS accounts.
Solution overview
In Security Hub, the status of an investigation of a finding is tracked using the workflow status attribute. The workflow status for new findings is initially set to NEW. You can change the workflow status of a finding either by selecting it in the AWS Security Hub console, or by automating the change of workflow status by using AWS CLI or Security Hub API. After the owner of the finding’s resource is notified to take action, you can set the workflow status to NOTIFIED. After a finding is remediated, you can set the workflow status to RESOLVED. If the finding is not a concern for your given environment and does not require any action, then you can set the workflow status to SUPPRESSED.
In this solution, we show you how to automatically set the workflow status to SUPPRESSED for expected findings, by using EventBridge event patterns that trigger on Security Hub findings that match your defined criteria. The event pattern can match on fields of the findings such as account number, AWS Region, and Amazon Resource Names (ARNs). The Lambda function triggers on findings that match all defined criteria, and then sets the workflow status to SUPPRESSED for all matched findings using the BatchUpdateFindings Security Hub API action.
Solution architecture
Figure 1: Solution architecture overview
Figure 1 shows the administrator account aggregating the Security Hub findings from the member accounts.
Security Hub generates findings in the member accounts, then forwards the findings to the administrator account to be evaluated.
In the administrator account, Security Hub evaluates every finding (whether generated or forwarded) against EventBridge rules.
If a finding satisfies any of the defined EventBridge rule conditions, EventBridge triggers a Lambda function in the same Region. The EventBridge event bus delivers the finding to the Lambda function.
The Lambda function in the administrator account performs the finding suppression evaluation, and sets the Security Hub workflow status of the finding to SUPPRESSED.
This architecture uses one Lambda function per Region. You can group together multiple suppression rules into the same EventBridge pattern when they apply to the same group of AWS accounts. You can also configure multiple separate EventBridge event patterns when a suppression rule shouldn’t apply to an account.
Implementation
First, we show how to write the EventBridge event pattern. You use the CDK to define the event rule and pattern. The following example code will suppress Security Hub findings that originate in the development accounts for VPC flow logs that aren’t enabled. The solution will filter new findings only.
In the following example, replace <account-id-1> and <account-id-2> with your own information.
To deploy the solution by using the AWS Management Console
In your security account, launch the template by choosing the following Launch Stack button.
To deploy the solution by using the AWS CDK
You can find the latest code on GitHub, where you can also contribute to the sample code. The following commands show how to deploy the solution by using the AWS CDK. First, the CDK initializes your environment and uploads the Lambda assets to Amazon Simple Storage Service (Amazon S3). Then, you can deploy the solution to your account. For <account_id>, specify the account number, or comma separated list of account numbers, that you want the suppression rule to apply to.
Create a VPC that does not have flow logs enabled. We have included a test VPC that you can deploy with the following command:
cdk deploy vpc-test-suppression
Verify that the Security Hub finding EC2.6 has been suppressed in the parent account and the target account. You might need to wait a few minutes for the AWS Config recorder to detect the newly created resource and then to manually trigger the following AWS Config rule:
securityhub-vpc-flow-logs-enabled-*
After verifying the suppression, delete the test VPC you created to test the suppression rule:
cdk destroy vpc-test-suppression
Next steps
You can configure EventBridge rules and patterns to suppress all of your findings that are accepted risk, by design, or that have a compensating control. For example, if you are performing IAM authentication by using Amazon RDS Proxy, you could consider suppressing the control [RDS.10] IAM authentication should be configured for RDS instances. You can also consider creating event patterns that filter based on resource tags, such as filtering VPCs based on tags rather than account numbers for [EC2.6] VPC flow logging should be enabled in all VPCs.
Summary
In this blog post, we showed how you can automatically suppress specific findings by using the Security Hub BatchUpdateFindings API action. We showed you how to configure EventBridge patterns and rules in order to trigger a Lambda function that calls this API action to suppress your expected findings. After you follow the steps in this blog post for automatic Security Hub suppression, your console view in Security Hub will only show findings that are not suppressed.
If you have feedback about this post, submit comments in the Comments section below.
Want more AWS Security how-to content, news, and feature announcements? Follow us on Twitter.
It’s a common use case for customers to integrate identity providers (IdPs) with Amazon Elasticsearch Service (Amazon ES) to achieve single sign-on (SSO) with Kibana. This integration makes it possible for users to leverage their existing identity credentials and offers administrators a single source of truth for user and permissions management. In this blog post, we’ll discuss how you can configure Security Assertion Markup Language (SAML) authentication for Kibana by using Amazon ES and Microsoft Active Directory Federation Services (AD FS).
Amazon ES now natively supports SSO authentication that uses the SAML protocol. With SAML authentication for Kibana, users can integrate directly with their existing third-party IdPs, such as Okta, Ping Identity, OneLogin, Auth0, AD FS, AWS Single Sign-on, and Azure Active Directory. SAML authentication for Kibana is powered by Open Distro for Elasticsearch, an Apache 2.0-licensed distribution of Elasticsearch, and is available to all Amazon ES customers who have enabled fine-grained access controls.
When you set up SAML authentication with Kibana, you can configure authentication that uses either service provider (SP)-initiated SSO or IdP-initiated SSO. The SP-initiated SSO flow occurs when a user directly accesses any SAML-configured Kibana endpoint, at which time Amazon ES redirects the user to their IdP for authentication, followed by a redirect back to Amazon ES after successful authentication. An IdP-initiated SSO flow typically occurs when a user chooses a link that first initiates the sign-in flow at the IdP, skipping the redirect between Amazon ES and the IdP. This blog post will focus on the SAML SP-initiated SSO flow.
Prerequisites
To complete this walkthrough, you must have the following:
AD FS installed and configured with at least one user and one group.
A browser with network connectivity to AD FS, Amazon ES, and Kibana.
Solution overview
For the solution presented in this post, you use your existing AD FS as an IdP for the user’s authentication. The SAML federation uses a claim-based authentication model in which user attributes (in this case stored in Active Directory) are passed from the IdP (AD FS) to the SP (Kibana).
Let’s walk through how a user would use the SAML protocol to access Amazon ES Kibana (the SP) while using AD FS as the IdP. In Figure 1, the user authentication request comes from an on-premises network, which is connected to Amazon VPC through a VPN connection—in this case, this could also be over AWS Direct Connect. The Amazon ES domain and AD FS are created in the same VPC.
Figure 1: A high-level view of a SAML transaction between Amazon ES and AD FS
The initial sign-in flow is as follows:
Open a browser on the on-premises computer and navigate to the Kibana endpoint for your Amazon ES domain in the VPC.
Amazon ES generates a SAML authentication request for the user and redirects it back to the browser.
The browser redirects the SAML authentication request to AD FS.
AD FS parses the SAML request and prompts user to enter credentials.
User enters credentials and AD FS authenticates the user with Active Directory.
After successful authentication, AD FS generates a SAML response and returns the encoded SAML response to the browser. The SAML response contains the destination (the Assertion Consumer Service (ACS) URL), the authentication response issuer (the AD FS entity ID URL), the digital signature, and the claim (which user is authenticated with AD FS, the user’s NameID, the group, the attribute used in SAML assertions, and so on).
The browser sends the SAML response to the Kibana ACS URL, and then Kibana redirects to Amazon ES.
Amazon ES validates the SAML response. If all the validations pass, you are redirected to the Kibana front page. Authorization is performed by Kibana based on the role mapped to the user. The role mapping is performed based on attributes of the SAML assertion being consumed by Kibana and Amazon ES.
Deploy the solution
Now let’s walk through the steps to set up SAML authentication for Kibana single sign-on by using Amazon ES and Microsoft AD FS.
Enable SAML for Amazon Elasticsearch Service
The first step in the configuration setup process is to enable SAML authentication in the Amazon ES domain.
To enable SAML for Amazon ES
Sign in to the Amazon ES console and choose any existing Amazon ES domain that meets the criteria described in the Prerequisites section of this post.
Under Actions, select Modify Authentication.
Select the Enable SAML authentication check box.
Figure 2: Enable SAML authentication
When you enable SAML, it automatically creates and displays the different URLs that are required to configure SAML support in your IdP.
Figure 3: URLs for configuring the IdP
Look under Configure your Identity Provider (IdP), and note down the URL values for Service provider entity ID and SP-initiated SSO URL.
Set up and configure AD FS
During the SAML authentication process, the browser receives the SAML assertion token from AD FS and forwards it to the SP. In order to pass the claims to the Amazon ES domain, AD FS (the claims provider) and the Amazon ES domain (the relying party) have to establish a trust between them. Then you define the rules for what type of claims AD FS needs to send to the Amazon ES domain. The Amazon ES domain authorizes the user with internal security roles or backend roles, according to the claims in the token.
To configure Amazon ES as a relying party in AD FS
Sign in to the AD FS server. In Server Manager, choose Tools, and then choose AD FS Management.
In the AD FS management console, open the context (right-click) menu for Relying Party Trust, and then choose Add Relying Party Trust.
Figure 4: Set up a relying party trust
In the Add Relying Party Trust Wizard, select Claims aware, and then choose Start.
Figure 5: Create a claims aware application
On the Select Data Source page, choose Enter data about the relying party manually, and then choose Next.
Figure 6: Enter data about the relying party manually
On the Specify Display Name page, type in the display name of your choice for the relying party, and then choose Next. Choose Next again to move past the Configure Certificate screen. (Configuring a token encryption certificate is optional and at the time of writing, Amazon ES doesn’t support SAML token encryption.)
Figure 7: Provide a display name for the relying party
On the Configure URL page, do the following steps.
Choose the Enable support for the SAML 2.0 WebSSO protocol check box.
In the URL field, add the SP-initiated SSO URL that you noted when you enabled SAML authentication in Amazon ES earlier.
Choose Next.
Figure 8: Enable SAML support and provide the SP-initiated SSO URL
On the Configure Identifiers page, do the following:
For Relying party trust identifier, provide the service provider entity ID that you noted when you enabled SAML authentication in Amazon ES.
Choose Add, and then choose Next.
Figure 9: Provide the service provider entity ID
On the Choose Access Control Policy page, choose the appropriate access for your domain. Depending on your requirements, choose one of these options:
Choose Permit Specific Group to restrict access to one or more groups in your Active Directory domain based on the Active Directory group.
Choose Permit Everyone to allow all Active Directory domain users to access Kibana.
Note: This step only provides access for the users to authenticate into Kibana. You have not yet set up Open Distro security roles and permissions.
Figure 10: Choose an access control policy
On the Ready to Add Trust page, choose Next, and then choose Close.
Now you’ve finished adding Amazon ES as a relying party trust.
To configure claim issuance rules for the relying party during the authentication process, AD FS sends user attributes—claims—to the relying party. With claim rules, you define what claims AD FS can send to the Amazon ES domain. In the following procedure, you create two claim rules: one is to send the incoming Windows account name as the Name ID and the other is to send Active Directory groups as roles.
To configure claim issuance rules
On the Relying Party Trusts page, right-click the relying party trust (in this case, AWS_ES_Kibana) and choose Edit Claim Issuance Policy.
Figure 11: Edit the claim issuance policy
Configure the claim rule to send the Windows account name as the Name ID, using these steps.
In the Edit Claim Issuance Policy dialog box, choose Add Rule. The Add Transform Claim Rule Wizard opens.
For Rule Type, choose Transform an Incoming Claim, and then choose Next.
On the Configure Rule page, enter the following information:
Claim rule name: NameId
Incoming claim type: Windows account name
Outgoing claim type: Name ID
Outgoing name ID format: Unspecified
Pass through all claim values: Select this option
Choose Finish.
Figure 12: Set the claim rule for Name ID
Configure Active Directory groups to send as roles, using the following steps.
In the Edit Claim Issuance Policy dialog box, choose Add Rule. The Add Transform Claim Rule Wizard opens.
For Rule Type, choose Send LDAP Attributes as Claims, and then choose Next.
On the Configure Rule page, enter or choose the following settings:
Claim rule name: Send-Groups-as-Roles
Attribute store: Active Directory
LDAP attribute: Token-Groups – Unqualified Names (to select the group name)
Outgoing claim type: Roles (the value for Roles should match the Roles Key that you will set in the Configure SAML in the Amazon ES domain step later in this process)
Choose Finish
Figure 13: Set claim rule for Active Directory groups as Roles
The configuration of AD FS is now complete and you can download the SAML metadata file from AD FS. The SAML metadata is in XML format and is needed to configure SAML in the Amazon ES domain. The AD FS metadata file (the IdP metadata) can be accessed from the following link (replace <AD FS FQDN> with the domain name of your AD FS server). Copy the XML and note down the value of entityID from the XML, as shown in Figure 14. You will need this information in the next steps.
Next, you configure SAML settings in the Amazon Elasticsearch Service console. You need to import the IdP metadata, configure the IdP entity ID, configure the backend role, and set up the Roles key.
To configure SAML setting in the Amazon ES domain
Sign in to the Amazon Elasticsearch Service console. On the Actions menu, choose Modify authentication.
Import the IdP metadata, using the following steps.
Choose Import IdP metadata, and then choose Metadata from IdP.
Paste the contents of the FederationMetadata XML file (the IdP metadata) that you copied earlier in the Add or edit metadata field. You can also choose the Import from XML file button if you have the metadata file on the local disk.
Figure 15: The imported identity provider metadata
Copy and paste the value of entityID from the XML file to the IdP entity ID field, if that field isn’t autofilled.
For SAML manager backend role (the console may refer to this as master backend role), enter the name of the group you created in AD FS as part of the prerequisites for this post. In this walkthrough, we set the name of the group as admins, and therefore the backend role is admins.
Optionally, you can also provide the user name instead of the backend role.
Set up the Roles key, using the following steps.
Under Optional SAML settings, for Roles key, enter Roles. This value must match the value for Outgoing claim type, which you set when you configured claims rules earlier.
Figure 16: Set the Roles key
Leave the Subject key field empty to use the NameID element of the SAML assertion for the user name. Keep the defaults for everything else, and then choose Submit.
It can take few minutes to update the SAML settings and for the domain to come back to the active state.
Congratulations! You’ve completed all the SP and IdP configurations.
Sign in to Kibana
When the domain comes back to the active state, choose the Kibana URL in the Amazon ES console. You will be redirected to the AD FS sign-in page for authentication. Provide the user name and password for any of the users in the admins group. The example in Figure 17 uses the credentials for the user [email protected], who is a member of the admins group.
Figure 17: The AD FS sign-in screen with user credentials
AD FS authenticates the user and redirect the page to Kibana. If the user has at least one role mapped, you go to the Kibana home page, as shown in Figure 18. In this walkthrough, you mapped the AD FS group admins as a backend role to the manager user. Internally, the Open Distro security plugin maps the backend role admins to the security roles all_access and security_manager. Therefore, the Active Directory user in the admins group is authorized with the privileges of the manager user in the domain. For more granular access, you can create different AD FS groups and map the group names (backend roles) to internal security roles by using Role Mappings in Kibana.
Figure 18: The AD FS user [email protected] is successfully logged in to Kibana
Note: At the time of writing for this blog post, if you specify the <SingleLogoutService /> details in the AD FS metadata XML, when you sign out from Kibana, Kibana will call AD FS directly and try to sign the user out. This doesn’t work currently, because AD FS expects the sign-out request to be signed with a certificate that Amazon ES doesn’t currently support. If you remove <SingleLogoutService /> from the metadata XML file, Amazon ES will use its own internal sign-out mechanism and sign the user out on the Amazon ES side. No calls will be made to AD FS for signing out.
Conclusion
In this post, we covered setting up SAML authentication for Kibana single sign-on by using Amazon ES and Microsoft AD FS. The integration of IdPs with your Amazon ES domain provides a powerful way to control fine-grained access to your Kibana endpoint and integrate with existing identity lifecycle processes for create/update/delete operations, which reduces the operational overhead required to manage users.
This post is co-authored with Piotr Klesta, Robert Meisner and Lukasz Luszczynski of ERGO
Artificial intelligence (AI) and related technologies are already finding applications in our homes, cars, industries, and offices. The insurance business is no exception to this. When AI is implemented correctly, it adds a major competitive advantage. It enhances the decision-making process, improves efficiency in operations, and provides hassle-free customer assistance.
At ERGO Group, we realized early on that innovation using AI required more flexibility in data integration than most of our legacy data architectures allowed. Our internal governance, data privacy processes, and IT security requirements posed additional challenges towards integration. We had to resolve these issues in order to use AI at the enterprise level, and allow for sensitive data to be used in a cloud environment.
We aimed for a central system that introduces ‘intelligence’ into other core application systems, and thus into ERGO’s business processes. This platform would support the process of development, training, and testing of complex AI models, in addition to creating more operational efficiency. The goal of the platform is to take the undifferentiated heavy lifting away from our data teams so that they focus on what they do best – harness data insights.
Building ERGO AI Factory to power AI use cases
Our quest for this central system led to the creation of AI Factory built on AWS Cloud. ERGO AI Factory is a compliant platform for running production-ready AI use cases. It also provides a flexible model development and testing environment. Let’s look at some of the capabilities and services we offer to our advanced analytics teams.
Figure 1: AI Factory imperatives
Compliance: Enforcing security measures (for example, authentication, encryption, and least privilege) was one of our top priorities for the platform. We worked closely with the security teams to meet strict domain and geo-specific compliance requirements.
Data governance: Data lineage and deep metadata extraction are important because they support proper data governance and auditability. They also allow our users to navigate a complex data landscape. Our data ingestion frameworks include a mixture of third party and AWS services to capture and catalog both technical and business metadata.
Data storage and access: AI Factory stores data in Amazon Simple Storage Service (S3) in a secure and compliant manner. Access rights are only granted to individuals working on the corresponding projects. Roles are defined in Active Directory.
Automated data pipelines: We sought to provide a flexible and robust data integration solution. An ETL pipeline using Apache Spark, Apache Airflow, and Kubernetes pods is central to our data ingestion. We use this for AI model development and subsequent data preparation for operationalization and model integration.
Monitoring and security: AI Factory relies on open-source cloud monitoring solutions like Grafana to detect security threats and anomalies. It does this by collecting service and application logs, tracking metrics, and generating alarms.
Feedback loop: We store model inputs/outputs and use BI tools, such as Amazon QuickSight, to track the behavior and performance of productive AI models. It’s important to share such information with our business partners so we can build their trust and confidence with AI.
Developer-friendly environment: Creating AI models is possible in a notebook-style or integrated development environment. Because our data teams use a variety of machine learning (ML) frameworks and libraries, we keep our platform extensible and our framework agnostic. We support Python/R, Apache Spark, PyTorch and TensorFlow, and more. All this is bolstered by CI/CD processes that accelerate delivery and reduce errors.
Business process integration: AI Factory offers services to integrate ML models into existing business processes. We focus on standardizing processes and close collaboration with business and technical stakeholders. Our overarching goal is to operationalize the AI model in the shortest possible timeframe, while preserving high quality and security standards.
AI Factory architecture
So far, we have looked at the functional building blocks of the AI Factory. Let’s take an architectural view of the platform using a five-step workflow:
Figure 2: AI Factory high-level architecture
Data ingestion environment: We use this environment to ingest data from the prominent on-premises ERGO data sources. We can schedule the batch or Delta transfer data to various cloud destinations using multiple Kubernetes-hosted microservices. Once ingested, data is persisted and cataloged as ERGO’s data lake on Amazon S3. It is prepared for processing by the upstream environments.
Model development environment: This environment is used primarily by data scientists and data engineers. We use Amazon EMR and Amazon SageMaker extensively for data preparation, data wrangling, experimentation with predictive models, and development through rapid iterations.
Model operationalization environment: Trained models with satisfactory KPIs are promoted from the model development to the operationalization environment. This is where we integrate AI models in business processes. The team focuses on launching and optimizing the operation of services and algorithms.
Integration with ERGO business processes is achieved using Kubernetes-hosted ‘Model Service.’ This allows us to infuse AI models provided by data scientists in existing business processes.
An essential part of model operationalization is to continuously monitor the quality of the deployed ML models using the ‘feedback loop service.’
Model insights environment: This environment is used for displaying information about platform performance, processes, and analytical data. Data scientists use its services to check for unexpected bias or performance drifts that the model could exhibit. Feedback coming from the business through the “feedback loop service’ allows them to identify problems fast and retrain the model.
Shared services: Though shown as the fifth step of the workflow, the shared services environment supports almost every step in the process. It provides common, shared components between different parts of the platform managing CI/CD and orchestration processes within the AI factory. Additional services like platform logging and monitoring, authentication, and metadata management are also delivered from the shared services environment.
A binding theme across the various subplatforms is that all provisioning and deployment activities are automated using Infrastructure as Code (IaC) practices. This reduces the potential for human error, provides architectural flexibility, and greatly speeds up software development and our infrastructure-related operations.
All components of the AI factory are run in the AWS Cloud and can be scaled and adapted as needed. The connection between model development and operationalization happens at well-defined interfaces to prevent unnecessary coupling of components.
Lessons learned
Security first
Align with security early and often
Understand all the regulatory obligations and document them as critical, non-functional requirements
Modular approach
Combine modern data science technology and professional IT with a cross-functional, agile way of working
Apply loosely coupled services with an API-first approach
Data governance
Tracking technical metadata is important but not sufficient, you need business attributes too
Determine data ownership in operational systems to map upstream data governance workflows
Establish solutions to data masking as the data moves across sub-platforms
Define access rights and permissions boundaries among various personas
FinOps strategy
Carefully track platform cost
Assign owners responsible for monitoring and cost improvements
Provide regular feedback to platform stakeholders on usage patterns and associated expenses
Working with our AWS team
Establish cadence for architecture review and new feature updates
Plan cloud training and enablement
The future for the AI factory
The creation of the AI Factory was an essential building block of ERGO’s strategy. Now we are ready to embrace the next chapter in our advanced analytics journey.
We plan to focus on important use cases that will deliver the highest business value. We want to make the AI Factory available to ERGO’s international subsidiaries. We are also enhancing and scaling its capabilities. We are creating an ‘analytical content hub’ based on automated text extraction, improving speech to text, and developing translation processes for all unstructured and semistructured data using AWS AI services.
Over the past few years, midsize and large enterprises have adopted vertical integration as part of their strategy to optimize operations and profitability. Vertical integration consists of separating different stages of the production line from other related departments, such as marketing and logistics. Enterprises implement such strategy to gain full control of their value chain: from the raw material production to the assembly lines and end consumer.
To achieve operational efficiency, enterprises must keep a level of independence between departments. However, this can lead to unstandardized operations and communication issues. Moreover, with this kind of autonomy for independent and dynamic verticals, the enterprise may lose some measure of visibility and control. As a result, it becomes challenging to generate a basic report from multiple departments. This blog post provides a high-level solution to integrate your different business verticals, using an event-driven architecture on top of Amazon EventBridge.
Event-driven architecture
Event-driven architecture is an architectural pattern to model communication between services while decoupling applications from each other. Applications scale and fail independently, and a central event bus facilitates the communication between the services in the enterprise. Instead of a particular application sending a request directly to another, it produces an event. The central event router captures it and forwards the message to the proper destinations.
For instance, when a customer places a new order on the retail website, the application sends the event to the event bus. Following, the event bus sends the message to the ERP system and the fulfillment center for dispatch. In this scenario, we call the application sending the event, an event publisher, and the applications receiving the event, event consumers.
Because all messages are going through the central event bus, there is clear independence between the applications within the enterprise. Here are some benefits:
Application independence occurs even if they belong to the same business workflow
You can plug in more event consumers to receive the same event type
You can add a data lake to receive all new order events from the retail website
You can receive all the events from the payment system and the customer relations department
This ensures you can integrate independent departments, increase overall visibility, and make sense of specific processes happening in the organization using the right tools.
Implementing event-driven architecture with Amazon EventBridge
Each vertical organically generates lifecycle events. Enterprises can use the event-driven architecture paradigm to make the information flow between the departments by asynchronously exchanging events through the event bus. This way, each department can react to events generated by other departments and initiate processes or actions depending on its business needs.
Such an approach creates a dynamic and flexible choreography between the different participants, which is unique to the enterprise. Such choreography can be followed and monitored using analytics and fine-grained event data collected on the data lake. Read Using AWS X-Ray tracing with Amazon EventBridge to learn how to debug and analyze this kind of distributed application.
In Figure 1, Amazon EventBridge works as the central event bus, the core component of this event-driven architecture. Through Amazon EventBridge, each event publisher sends or receives lifecycle events to and from all the other participants. Amazon EventBridge has an advanced routing mechanism using the concept of rules. Each rule defines up to five targets for the event arriving on the bus. Events are selected based on the event pattern. You can set up routing rules to determine where to send your data to build application architectures. These will react in real time to your data sources, with event publisher and consumer decoupled.
In addition to initiating the heavy routing and distribution of events, Amazon EventBridge can also give real-time insights into how the business runs. Using metrics automatically sent to Amazon CloudWatch, it is possible to see which kinds of events are arriving, and at which rate. You can also see how those events are distributed across the registered targets, and any failures that occur during this distribution. Every event can also be archived using the Amazon EventBridge events archiving feature.
Amazon Simple Storage Service (S3) is the backend storage, or data lake, for all the events that have ever transited via the event bus. With Amazon S3, customers have a cost-efficient storage service at any scale, with 11 9’s of durability. To help customers manage and secure their data, S3 provides features such as Amazon S3 Lifecycle to optimize costs. S3 Object Lock allows the write-once-read-many (WORM) model. You can expand this data and transform it into information using S3. Using services like Amazon Athena, Amazon Redshift, and Amazon EMR, those events can be transformed, correlated, and aggregated to generate insights on the business. The Amazon S3 data lake can also be the input to a data warehouse, machine learning models, and real-time analytics. Learn more about how to use Amazon S3 as the data lake storage.
A critical feature of this solution is the initiation of complex queries on top of the data lake. Amazon API Gateway provides one single flexible and elastic API entry point to retrieve data from the data lake. It also can publish events directly to the event bus. For complex queries, Amazon API Gateway can be integrated with an AWS Lambda. It will coordinate the execution of standard SQL queries using Amazon Athena as the query engine. You can read about a fully functional example of such an API called athena-express.
After collecting data from multiple departments, third-party entities, and shop floors, you can use the data to derive business value using cross-organization dashboards. In this way, you can increase visibility over the different entities and make sense of the data from the distributed systems. Even though this design allows you to use your favorite BI tool, we are using Amazon QuickSight for this solution. For example, with QuickSight, you can author your interactive dashboards, which include machine learning-powered insights. Those dashboards can then connect the marketing campaigns data with the sales data. You can measure how effective those campaigns were and forecast the demand on the production lines.
Conclusion
In this blog post, we showed you how to use Amazon EventBridge as an event bus to allow event-driven architectures. This architecture pattern streamlines the adoption of vertical integration. Enterprises can decouple IT systems from each other while retaining visibility into the data they generate. Integrating those systems can happen asynchronously using a choreography approach instead of having an orchestrator as a central component. There are technical challenges to implement this kind of solution, such as maintaining consistency in distributed applications and transactions spanning multiple microservices. Refer to the saga pattern for microservices-based architecture, and how to implement it using AWS Step Functions.
With a data lake in place to collect all the data produced by IT systems, you can create BI dashboards that provide a holistic view of multiple departments. Moreover, it allows organizations to get better insights into their valuable data and explore other use cases, such as machine learning. To support the data lake creation and management, refer to AWS Lake Formation and a series of other blog posts.
To learn more about Amazon EventBridge from a hands-on perspective, refer to this EventBridge workshop.
The collective thoughts of the interwebz
Manage Consent
To provide the best experiences, we use technologies like cookies to store and/or access device information. Consenting to these technologies will allow us to process data such as browsing behavior or unique IDs on this site. Not consenting or withdrawing consent, may adversely affect certain features and functions.
Functional
Always active
The technical storage or access is strictly necessary for the legitimate purpose of enabling the use of a specific service explicitly requested by the subscriber or user, or for the sole purpose of carrying out the transmission of a communication over an electronic communications network.
Preferences
The technical storage or access is necessary for the legitimate purpose of storing preferences that are not requested by the subscriber or user.
Statistics
The technical storage or access that is used exclusively for statistical purposes.The technical storage or access that is used exclusively for anonymous statistical purposes. Without a subpoena, voluntary compliance on the part of your Internet Service Provider, or additional records from a third party, information stored or retrieved for this purpose alone cannot usually be used to identify you.
Marketing
The technical storage or access is required to create user profiles to send advertising, or to track the user on a website or across several websites for similar marketing purposes.