Post Syndicated from Samit Kumbhani original https://aws.amazon.com/blogs/security/how-to-use-aws-database-encryption-sdk-for-client-side-encryption-and-perform-searches-on-encrypted-attributes-in-dynamodb-tables/
Today’s applications collect a lot of data from customers. The data often includes personally identifiable information (PII), that must be protected in compliance with data privacy laws such as the General Data Protection Regulation (GDPR) and the California Consumer Privacy Act (CCPA). Modern business applications require fast and reliable access to customer data, and Amazon DynamoDB is an ideal choice for high-performance applications at scale. While server-side encryption options exist to safeguard customer data, developers can also add client-side encryption to further enhance the security of their customer’s data.
In this blog post, we show you how the AWS Database Encryption SDK (DB-ESDK) – an upgrade to the DynamoDB Encryption Client – provides client-side encryption to protect sensitive data in transit and at rest. At its core, the DB-ESDK is a record encryptor that encrypts, signs, verifies, and decrypts the records in DynamoDB table. You can also use DB-ESDK to search on encrypted records and retrieve data, thereby alleviating the need to download and decrypt your entire dataset locally. In this blog, we demonstrate how to use DB-ESDK to build application code to perform client-side encryption of sensitive data within your application before transmitting and storing it in DynamoDB and then retrieve data by searching on encrypted fields.
Client-side encryption
For protecting data at rest, many AWS services integrate with AWS Key Management Service (AWS KMS). When you use server-side encryption, your plaintext data is encrypted in transit over an HTTPS connection, decrypted at the service endpoint, and then re-encrypted by the service before being stored. Client-side encryption is the act of encrypting your data locally to help ensure its security in transit and at rest. When using client-side encryption, you encrypt the plaintext data from the source (for example, your application) before you transmit the data to an AWS service. This verifies that only the authorized users with the right permission to the encryption key can decrypt the ciphertext data. Because data is encrypted inside an environment that you control, it is not exposed to a third party, including AWS.
While client-side encryption can be used to improve overall security posture, it introduces additional complexity on the application, including managing keys and securely executing cryptographic tasks. Furthermore, client-side encryption often results in reduced portability of the data. After data is encrypted and written to the database, it’s generally not possible to perform additional tasks such as creating index on the data or search directly on the encrypted records without first decrypting it locally. In the next section, you’ll see how you can address these issues by using the AWS Database Encryption SDK (DB-ESDK)—to implement client-side encryption in your DynamoDB workloads and perform searches.
AWS Database Encryption SDK
DB-ESDK can be used to encrypt sensitive attributes such as those containing PII attributes before storing them in your DynamoDB table. This enables your application to help protect sensitive data in transit and at rest, because data cannot be exposed unless decrypted by your application. You can also use DB-ESDK to find information by searching on encrypted attributes while your data remains securely encrypted within the database.
In regards to key management, DB-ESDK gives you direct control over the data by letting you supply your own encryption key. If you’re using AWS KMS, you can use key policies to enforce clear separation between the authorized users who can access specific encrypted data and those who cannot. If your application requires storing multiple tenant’s data in single table, DB-ESDK supports configuring distinct key for each of those tenants to ensure data protection. Follow this link to view how searchable encryption works for multiple tenant databases.
While DB-ESDK provides many features to help you encrypt data in your database, in this blog post, we focus on demonstrating the ability to search on encrypted data.
How the AWS Database Encryption SDK works with DynamoDB
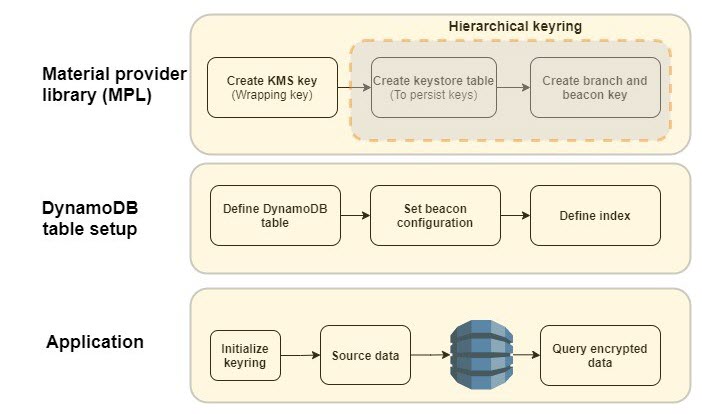
Figure 1: DB-ESDK overview
As illustrated in Figure 1, there are several steps that you must complete before you can start using the AWS Database Encryption SDK. First, you need to set up your cryptographic material provider library (MPL), which provides you with the lower level abstraction layer for managing cryptographic materials (that is, keyrings and wrapping keys) used for encryption and decryption. The MPL provides integration with AWS KMS as your keyring and allows you to use a symmetric KMS key as your wrapping key. When data needs to be encrypted, DB-ESDK uses envelope encryption and asks the keyring for encryption material. The material consists of a plaintext data key and an encrypted data key, which is encrypted with the wrapping key. DB-ESDK uses the plaintext data key to encrypt the data and stores the ciphertext data key with the encrypted data. This process is reversed for decryption.
The AWS KMS hierarchical keyring goes one step further by introducing a branch key between the wrapping keys and data keys. Because the branch key is cached, it reduces the number of network calls to AWS KMS, providing performance and cost benefits. The hierarchical keyring uses a separate DynamoDB table is referred as the keystore table that must be created in advance. The mapping of wrapping keys to branch keys to data keys is handled automatically by the MPL.
Next, you need to set up the main DynamoDB table for your application. The Java version of DB-ESDK for DynamoDB provides attribute level actions to let you define which attribute should be encrypted. To allow your application to search on encrypted attribute values, you also must configure beacons, which are truncated hashes of plaintext value that create a map between the plaintext and encrypted value and are used to perform the search. These configuration steps are done once for each DynamoDB table. When using beacons, there are tradeoffs between how efficient your queries are and how much information is indirectly revealed about the distribution of your data. You should understand the tradeoff between security and performance before deciding if beacons are right for your use case.
After the MPL and DynamoDB table are set up, you’re ready to use DB-ESDK to perform client-side encryption. To better understand the preceding steps, let’s dive deeper into an example of how this all comes together to insert data and perform searches on a DynamoDB table.
AWS Database Encryption SDK in action
Let’s review the process of setting up DB-ESDK and see it in action. For the purposes of this blog post, let’s build a simple application to add records and performs searches.
The following is a sample plaintext record that’s received by the application:
Prerequisite: For client side encryption to work, set up the integrated development environment (IDE) of your choice or set up AWS Cloud9.
Note: To focus on DB-ESDK capabilities, the following instructions omit basic configuration details for DynamoDB and AWS KMS.
Configure DB-ESDK cryptography
As mentioned previously, you must set up the MPL. For this example, you use an AWS KMS hierarchical keyring.
- Create KMS key: Create the wrapping key for your keyring. To do this, create a symmetric KMS key using the AWS Management Console or the API.
- Create keystore table: Create a DynamoDB table to serve as a keystore to hold the branch keys. The logical keystore name is cryptographically bound to the data stored in the keystore table. The logical keystore name can be the same as your DynamoDB table name, but it doesn’t have to be.
- Create keystore keys: This operation generates the active branch key and beacon key using the KMS key from step 1 and stores it in the keystore table. The branch and beacon keys will be used by DB-ESDK for encrypting attributes and generating beacons.
At this point, the one-time set up to configure the cryptography material is complete.
Set up a DynamoDB table and beacons
The second step is to set up your DynamoDB table for client-side encryption. In this step, define the attributes that you want to encrypt, define beacons to enable search on encrypted data, and set up the index to query the data. For this example, use the Java client-side encryption library for DynamoDB.
- Define DynamoDB table: Define the table schema and the attributes to be encrypted. For this blog post, lets define the schema based on the sample record that was shared previously. To do that, create a DynamoDB table called OrderInfo with order_id as the partition key and order_time as the sort key.
DB-ESDK provides the following options to define the sensitivity level for each field. Define sensitivity level for each of the attributes based on your use case.
- ENCRYPT_AND_SIGN: Encrypts and signs the attributes in each record using a unique encryption key. Choose this option for attributes with data you want to encrypt.
- SIGN_ONLY: Adds a digital signature to verify the authenticity of your data. Choose this option for attributes that you would like to protect from being altered. The partition and sort key should always be set as SIGN_ONLY.
- DO_NOTHING: Does not encrypt or sign the contents of the field and stores the data as-is. Only choose this option if the field doesn’t contain sensitive data and doesn’t need to be authenticated with the rest of your data. In this example, the partition key and sort key will be defined as “Sign_Only” attributes. All additional table attributes will be defined as “Encrypt and Sign”: email, firstname, lastname, last4creditcard and expirydate.
- Configure beacons: Beacons allow searches on encrypted fields by creating a mapping between the plaintext value of a field and the encrypted value that’s stored in your database. Beacons are generated by DB-ESDK when the data is being encrypted and written by your application. Beacons are stored in your DynamoDB table along with your encrypted data in fields labelled with the prefix aws_dbe_b_.
It’s important to note that beacons are designed to be implemented in new, unpopulated tables only. If configured on existing tables, beacons will only map to new records that are written and the older records will not have the values populated. There are two types of beacons – standard and compound. The type of beacon you configure determines the type of queries you are able to perform. You should select the type of beacon based on your queries and access patterns:
- Standard beacons: This beacon type supports querying a single source field using equality operations such as equals and not-equals. It also allows you to query a virtual (conceptual) field by concatenating one or more source fields.
- Compound beacons: This beacon type supports querying a combination of encrypted and signed or signed-only fields and performs complex operations such as begins with, contains, between, and so on. For compound beacons, you must first build standard beacons on individual fields. Next, you need to create an encrypted part list using a unique prefix for each of the standard beacons. The prefix should be a short value and helps differentiate the individual fields, simplifying the querying process. And last, you build the compound beacon by concatenating the standard beacons that will be used for searching using a split character. Verify that the split character is unique and doesn’t appear in any of the source fields’ data that the compound beacon is constructed from.
Along with identifying the right beacon type, each beacon must be configured with additional properties such as a unique name, source field, and beacon length. Continuing the previous example, let’s build beacon configurations for the two scenarios that will be demonstrated in this blog post.
Scenario 1: Identify orders by exact match on the email address.
In this scenario, search needs to be conducted on a singular attribute using equality operation.
- Beacon type: Standard beacon.
- Beacon name: The name can be the same as the encrypted field name, so let’s set it as email.
- Beacon length: For this example, set the beacon length to 15. For your own uses cases, see Choosing a beacon length.
Scenario 2: Identify orders using name (first name and last name) and credit card attributes (last four digits and expiry date).
In this scenario, multiple attributes are required to conduct a search. To satisfy the use case, one option is to create individual compound beacons on name attributes and credit card attributes. However, the name attributes are considered correlated and, as mentioned in the beacon selection guidance, we should avoid building a compound beacon on such correlated fields. Instead in this scenario we will concatenate the attributes and build a virtual field on the name attributes
- Beacon type: Compound beacon
- Beacon Configuration:
- Define a virtual field on firstname and lastname, and label it fullname.
- Define standard beacons on each of the individual fields that will be used for searching: fullname, last4creditcard, and expirydate. Follow the guidelines for setting standard beacons as explained in Scenario 1.
- For compound beacons, create an encrypted part list to concatenate the standard beacons with a unique prefix for each of the standard beacons. The prefix helps separate the individual fields. For this example, use C- for the last four digits of the credit card and E- for the expiry date.
- Build the compound beacons using their respective encrypted part list and a unique split character. For this example, use ~ as the split character.
- Beacon length: Set beacon length to 15.
- Beacon Name: Set the compound beacon name as CardCompound.
- Define index: Following DynamoDB best practices, secondary indexes are often essential to support query patterns. DB-ESDK performs searches on the encrypted fields by doing a look up on the fields with matching beacon values. Therefore, if you need to query an encrypted field, you must create an index on the corresponding beacon fields generated by the DB-ESDK library (attributes with prefix aws_dbe_b_), which will be used by your application for searches.
For this step, you will manually create a global secondary index (GSI).
Scenario 1: Create a GSI with aws_dbe_b_email as the partition key and leave the sort key empty. Set the index name as aws_dbe_b_email-index. This will allow searches using the email address attribute.
Scenario 2: Create a GSI with aws_dbe_b_FullName as the partition key and aws_dbe_b_CardCompound as the sort key. Set the index name as aws_dbe_b_VirtualNameCardCompound-index. This will allow searching based on firstname, lastname, last four digits of the credit card, and the expiry date. At this point the required DynamoDB table setup is complete.
Set up the application to insert and query data
Now that the setup is complete, you can use the DB-ESDK from your application to insert new items into your DynamoDB table. DB-ESDK will automatically fetch the data key from the keyring, perform encryption locally, and then make the put call to DynamoDB. By using beacon fields, the application can perform searches on the encrypted fields.
- Keyring initialization: Initialize the AWS KMS hierarchical keyring.
- Insert source data: For illustration purpose, lets define a method to load sample data into the OrderInfo table. By using DB-ESDK, the application will encrypt data attributes as defined in the DynamoDB table configuration steps.
- Query Data: Define a method to query data using plaintext values
Scenario 1: Identify orders associated with email address [email protected]. This query should return Order ID ABC-1001.
Scenario 2: Identify orders that were placed by John Doe using a specific credit card with the last four digits of 4567 and expiry date of 082026. This query should return Order ID ABC-1003 and ABC-1004.
Note: Compound beacons support complex string operation such as begins_with. In Scenario 2, if you had only the name attributes and last four digits of the credit card, you could still use the compound beacon for querying. You can set the values as shown below to query the beacon using the same code:
Now that you have the building blocks, let’s bring this all together and run the following steps to set up the application. For this example, a few of the input parameters have been hard coded. In your application code, replace <KMS key ARN> and <branch-key-id derived from keystore table> from Step 1 and Step 3 mentioned in the Configure DB-ESDK cryptography sections.
Conclusion
You’ve just seen how to build an application that encrypts sensitive data on client side, stores it in a DynamoDB table and performs queries on the encrypted data transparently to the application code without decrypting the entire data set. This allows your applications to realize the full potential of the encrypted data while adhering to security and compliance requirements. The code snippet used in this blog is available for reference on GitHub. You can further read the documentation of the AWS Database Encryption SDK and reference the source code at this repository. We encourage you to explore other examples of searching on encrypted fields referenced in this GitHub repository.
If you have feedback about this post, submit comments in the Comments section below. If you have questions about this post, contact AWS Support.
Want more AWS Security news? Follow us on Twitter.


 Diagram 4: S3 Bucket creation success with hooks execution


 Raymond Lai is a Senior Solutions Architect who specializes in catering to the needs of large enterprise customers. His expertise lies in assisting customers with migrating intricate enterprise systems and databases to AWS, constructing enterprise data warehousing and data lake platforms. Raymond excels in identifying and designing solutions for AI/ML use cases, and he has a particular focus on AWS Serverless solutions and Event Driven Architecture design.
 Bin Wang, PhD, is a Senior Analytic Specialist Solutions Architect at AWS, boasting over 12 years of experience in the ML industry, with a particular focus on advertising. He possesses expertise in natural language processing (NLP), recommender systems, diverse ML algorithms, and ML operations. He is deeply passionate about applying ML/DL and big data techniques to solve real-world problems.
 Aditya Shah is a Software Development Engineer at AWS. He is interested in Databases and Data warehouse engines and has worked on performance optimisations, security compliance and ACID compliance for engines like Apache Hive and Apache Spark.
 Melody Yang is a Senior Big Data Solution Architect for Amazon EMR at AWS. She is an experienced analytics leader working with AWS customers to provide best practice guidance and technical advice in order to assist their success in data transformation. Her areas of interests are open-source frameworks and automation, data engineering and DataOps.


 Aruna Govindaraju is an Amazon OpenSearch Specialist Solutions Architect and has worked with many commercial and open source search engines. She is passionate about search, relevancy, and user experience. Her expertise with correlating end-user signals with search engine behavior has helped many customers improve their search experience.
 Dagney Braun is a Principal Product Manager at AWS focused on OpenSearch.


 repeat → Answer


 Parnab Basak is a Senior Solutions Architect and a Serverless Specialist at AWS. He specializes in creating new solutions that are cloud native using modern software development practices like serverless, DevOps, and analytics. Parnab works closely in the analytics and integration services space helping customers adopt AWS services for their workflow orchestration needs.
 Chandan Rupakheti is a Solutions Architect and a Serverless Specialist at AWS. He is a passionate technical leader, researcher, and mentor with a knack for building innovative solutions in the cloud and bringing stakeholders together in their cloud journey. Outside his professional life, he loves spending time with his family and friends besides listening and playing music.
 Vinod Jayendra is a Enterprise Support Lead in ISV accounts at Amazon Web Services, where he helps customers in solving their architectural, operational, and cost optimization challenges. With a particular focus on Serverless technologies, he draws from his extensive background in application development to deliver top-tier solutions. Beyond work, he finds joy in quality family time, embarking on biking adventures, and coaching youth sports team.
 Rupesh Tiwari is a Senior Solutions Architect at AWS in New York City, with a focus on Financial Services. He has over 18 years of IT experience in the finance, insurance, and education domains, and specializes in architecting large-scale applications and cloud-native big data workloads. In his spare time, Rupesh enjoys singing karaoke, watching comedy TV series, and creating joyful moments with his family.


 Michael Hamilton is a Sr Analytics Solutions Architect focusing on helping enterprise customers modernize and simplify their analytics workloads on AWS. He enjoys mountain biking and spending time with his wife and three children when not working.
 Daniel Rozo is a Senior Solutions Architect with AWS supporting customers in the Netherlands. His passion is engineering simple data and analytics solutions and helping customers move to modern data architectures. Outside of work, he enjoys playing tennis and biking.
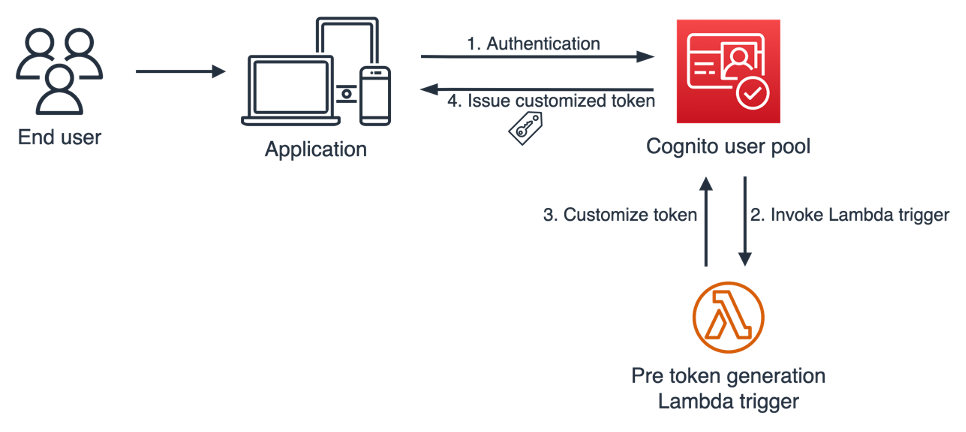


 Deepthi Mohan is a Principal PMT on the Amazon Managed Service for Apache Flink team.
 Francisco Morillo is a Streaming Solutions Architect at AWS. Francisco works with AWS customers, helping them design real-time analytics architectures using AWS services, supporting Amazon Managed Streaming for Apache Kafka (Amazon MSK) and Amazon Managed Service for Apache Flink.


 Anshu Agarwal is a Senior Software Engineer working on AWS OpenSearch at Amazon Web Services. She is passionate about solving problems related to building scalable and highly reliable systems.
 Rishab Nahata is a Software Engineer working on OpenSearch at Amazon Web Services. He is fascinated about solving problems in distributed systems. He is active contributor to OpenSearch.
 Bukhtawar Khan is a Principal Engineer working on Amazon OpenSearch Service. He is interested in distributed and autonomous systems. He is an active contributor to OpenSearch.
 Ranjith Ramachandra is an Engineering Manager working on Amazon OpenSearch Service at Amazon Web Services.


 Raghavarao Sodabathina is a Principal Solutions Architect at AWS, focusing on Data Analytics, AI/ML, and cloud security. He engages with customers to create innovative solutions that address customer business problems and to accelerate the adoption of AWS services. In his spare time, Raghavarao enjoys spending time with his family, reading books, and watching movies.
 Hang Zuo is a Senior Product Manager on the Amazon Kinesis Data Streams team at Amazon Web Services. He is passionate about developing intuitive product experiences that solve complex customer problems and enable customers to achieve their business goals.
 Shwetha Radhakrishnan is a Solutions Architect for AWS with a focus in Data Analytics. She has been building solutions that drive cloud adoption and help organizations make data-driven decisions within the public sector. Outside of work, she loves dancing, spending time with friends and family, and traveling.
 Brittany Ly is a Solutions Architect at AWS. She is focused on helping enterprise customers with their cloud adoption and modernization journey and has an interest in the security and analytics field. Outside of work, she loves to spend time with her dog and play pickleball.


 Prashant Agrawal is a Senior Search Specialist Solutions Architect with Amazon OpenSearch Service. He works closely with customers to help them migrate their workloads to the cloud and helps existing customers fine-tune their clusters to achieve better performance and save on cost. Before joining AWS, he helped various customers use OpenSearch and Elasticsearch for their search and log analytics use cases. When not working, you can find him traveling and exploring new places. In short, he likes doing Eat → Travel → Repeat.
 Satish Nandi is a Senior Product Manager with Amazon OpenSearch Service. He is focused on OpenSearch Serverless and has years of experience in networking, security and ML/AI. He holds a Bachelor degree in Computer Science and an MBA in Entrepreneurship. In his free time, he likes to fly airplanes, hang gliders and ride his motorcycle.

 Buddhike de Silva is a Senior Specialist Solutions Architect at Amazon Web Services. Buddhike helps customers run large scale streaming analytics workloads on AWS and make the best out of their cloud journey.


 Basheer Sheriff is a Senior Solutions Architect at AWS. He loves to help customers solve interesting problems leveraging new technology. He is based in Melbourne, Australia, and likes to play sports such as football and cricket.
 Shunsuke Goto is a Prototyping Engineer working at AWS. He works closely with customers to build their prototypes and also helps customers build analytics systems.