Tag Archives: Amazon EventBridge

Build real-time applications with Amazon EventBridge and AWS AppSync

Post Syndicated from James Beswick original https://aws.amazon.com/blogs/compute/build-real-time-applications-with-amazon-eventbridge-and-aws-appsync/

This post is written by Josh Kahn, Tech Leader, Serverless.

Amazon EventBridge now supports publishing events to AWS AppSync GraphQL APIs as native targets. The new integration enables builders to publish events easily to a wider variety of consumers and simplifies updating clients with near real-time data. You can use EventBridge and AWS AppSync to build resilient, subscription-based event-driven architectures across consumers.

To illustrate using EventBridge with AWS AppSync, consider a simplified airport operations scenario. In this example, airlines publish flight events (for example, boarding, push back, gate changes, and delays) to a service that maintains flight status on in-airport displays. Airlines also publish events that are useful for other entities at the airport, such as baggage handlers and maintenance, but not to passengers. This depicts a conceptual view of the system:

Conceptual view of the system

Passengers want the in-airport displays to be up-to-date and accurate. There are a number of ways to design the display application so that data remains up-to-date. Broadly, these include the application polling some API or the application subscribing to data changes.

Subscriptions for this scenario are better as the data changes are small and incremental relative to the large amount of information displayed. In a delay, for example, the display updates the status and departure time but no other details of a single flight among a larger list of flight information.

Flight board

AWS AppSync can enable clients to listen for real-time data changes through the use of GraphQL subscriptions. These are implemented using a WebSocket connection between the client and the AWS AppSync service. The display application client invokes the GraphQL subscription operation to establish a secure connection. AWS AppSync will automatically push data changes (or mutations) via the GraphQL API to subscribers using that connection.

Previously, builders could use EventBridge API Destinations to wire events published and routed through EventBridge to AWS AppSync, as described in an earlier blog post, and available in Serverless Land patterns (API Key, OAuth). The approach is useful for dealing with “out-of-band” updates in which data changes outside of an AWS AppSync mutation. Out-of-band updates generally require a NONE data source in AWS AppSync to notify subscribers of changes, as described in the AWS re:Post Knowledge Center. The addition of AWS AppSync as a target for EventBridge simplifies these use cases as you can now trigger a mutation in response to an event without additional code.

Airport Operations Events

Expanding the scenario, airport operations events look like this:

{
  "flightNum": 123,
  "carrierCode": "JK",
  "date": "2024-01-25",
  "event": "FlightDelayed",
  "message": "Delayed 15 minutes, late aircraft",
  "info": "{ \"newDepTime\": \"2024-01-25T13:15:00Z\", \"delayMinutes\": 15 }"
}

The event field identifies the type of event and if it is relevant to passengers. The event details provide further information about the event, which varies based on the type of event. The airport publishes a variety of events but the airport displays only need a subset of those changes.

AWS AppSync GraphQL APIs start with a GraphQL schema that defines the types, fields, and operations available in that API. AWS AppSync documentation provides an overview of schema and other GraphQL essentials. The partial GraphQL schema for the airport scenario is as follows:


type DelayEventInfo implements EventInfo {
	message: String
	delayMinutes: Int
	newDepTime: AWSDateTime
}

interface EventInfo {
	message: String
}

enum StatusEvent {
	FlightArrived
	FlightBoarding
	FlightCancelled
	FlightDelayed
	FlightGateChanged
	FlightLanded
	FlightPushBack
	FlightTookOff
}

type StatusUpdate {
	num: Int!
	carrier: String!
	date: AWSDate!
	event: StatusEvent!
	info: EventInfo
}

input StatusUpdateInput {
	num: Int!
	carrier: String!
	date: AWSDate!
	event: StatusEvent!
	message: String
	extra: AWSJSON
}

type Mutation {
	updateFlightStatus(input: StatusUpdateInput!): StatusUpdate!
}

type Query {
	listStatusUpdates(by: String): [StatusUpdate]
}

type Subscription {
	onFlightStatusUpdate(date: AWSDate, carrier: String): StatusUpdate
		@aws_subscribe(mutations: ["updateFlightStatus"])
}

schema {
	query: Query
	mutation: Mutation
	subscription: Subscription
}

Connect EventBridge to AWS AppSync

EventBridge allows you to filter, transform, and route events to a number of targets. The airport display service only needs events that directly impact passengers. You can define a rule in EventBridge that routes only those events (included in the preceding GraphQL schema) to the AWS AppSync target. Other events are routed elsewhere, as defined by other rules, or dropped. Details on creating EventBridge rules and the event matching pattern format can be found in EventBridge documentation.

The previous flight delayed event would be delivered using EventBridge as follows:

{
  "id": "b051312994104931b0980d1ad1c5340f",
  "detail-type": "Operations: Flight delayed",
  "source": "airport-operations",
  "time": "2024-01-25T16:58:37Z",
  "detail": {
    "flightNum": 123,
    "carrierCode": "JK",
    "date": "2024-01-25",
    "event": "FlightDelayed",
    "message": "Delayed 15 minutes, late aircraft",
    "info": "{ \"newDepTime\": \"2024-01-25T13:15:00Z\", \"delayMinutes\": 15 }"
  }
}

In this scenario, there is a specific list of events of interest, but EventBridge provides a flexible set of operations to match patterns, inspect arrays, and filter by content using prefix, numerical, or other matching. Some organizations will also allow subscribers to define their own rules on an EventBridge event bus, allowing targets to subscribe to events via self-service.

The following event pattern matches on the events needed for the airport display service:

{
  "source": [ "airport-operations" ],
  "detail": {
    "event": [ "FlightArrived", "FlightBoarding", "FlightCancelled", ... ]
  }
}

To create a new EventBridge rule, you can use the AWS Management Console or infrastructure as code. You can find the CloudFormation definition for the completed rule, with the AWS AppSync target, later in this post.

Console view

Create the AWS AppSync target

Now that EventBridge is configured to route selected events, define AWS AppSync as the target for the rule. The AWS AppSync API must support IAM authorization to be used as an EventBridge target. AWS AppSync supports multiple authorization types on a single GraphQL type, so you can also use OpenID Connect, Amazon Cognito User Pools, or other authorization methods as needed.

To configure AWS AppSync as an EventBridge target, define the target using the AWS Management Console or infrastructure as code. In the console, select the Target Type as “AWS Service” and Target as “AppSync.” Select your API. EventBridge parses the GraphQL schema and allows you to select the mutation to invoke when the rule is triggered.

When using the AWS Management Console, EventBridge will also configure the necessary AWS IAM role to invoke the selected mutation. Remember to create and associate a role with an appropriate trust policy when configuring with IaC.

EventBridge target types

EventBridge supports input transformation to customize the contents of an event before passing the information as input to the target. Configure the input transformer to extract needed values from the event using JSON path and a template in the input format expected by the AWS AppSync API. EventBridge provides a handy utility in the Console to pass and test the output of a sample event.

Target input transformer

Finally, configure the selection set to include the response from the AWS AppSync API. These are the fields that will be returned to EventBridge when the mutation is invoked. While the result returned to EventBridge is not overly useful (aside from troubleshooting), the mutation selection set will also determine the fields available to subscribers to the onFlightStatusUpdate subscription.

Configuring the selection set

Define the EventBridge to AWS AppSync rule in CloudFormation

Infrastructure as code templates, including AWS CloudFormation and AWS CDK, are useful for codifying infrastructure definitions to deploy across Regions and accounts. While you can write CloudFormation by hand, EventBridge provides a useful CloudFormation export in the AWS Management Console. You can use this feature to export the definition for a defined rule.

Export definition

This is the CloudFormation for the previous configured rule and AWS AppSync target. This snippet includes both the rule definition and the target configuration.

PassengerEventsToDisplayServiceRule:
    Type: AWS::Events::Rule
    Properties:
      Description: Route passenger related events to the display service endpoint
      EventBusName: eb-to-appsync
      EventPattern:
        source:
          - airport-operations
        detail:
          event:
            - FlightArrived
            - FlightBoarding
            - FlightCancelled
            - FlightDelayed
            - FlightGateChanged
            - FlightLanded
            - FlightPushBack
            - FlightTookOff
      Name: passenger-events-to-display-service
      State: ENABLED
      Targets:
        - Id: 12344535353263463
          Arn: <AppSync API GraphQL API ARN>
          RoleArn: <EventBridge Role ARN (defined elsewhere)>
          InputTransformer:
            InputPathsMap:
              carrier: $.detail.carrierCode
              date: $.detail.date
              event: $.detail.event
              extra: $.detail.info
              message: $.detail.message
              num: $.detail.flightNum
            InputTemplate: |-
              {
                "input": {
                  "num": <num>,
                  "carrier": <carrier>,
                  "date": <date>,
                  "event": <event>,
                  "message": "<message>",
                  "extra": <extra>
                }
              }
          AppSyncParameters:
            GraphQLOperation: >-
              mutation
              UpdateFlightStatus($input:StatusUpdateInput!){updateFlightStatus(input:$input){
                event
                date
                carrier
                num
                info {
                  __typename
                  ... on DelayEventInfo {
                    message
                    delayMinutes
                    newDepTime
                  }
                }
              }}

The ARN of the AWS AppSync API follows the form arn:aws:appsync:<AWS_REGION>:<ACCOUNT_ID>:endpoints/graphql-api/<GRAPHQL_ENDPOINT_ID>. The ARN is available in CloudFormation (see GraphQLEndpointArn return value) or can be created using the identifier found in the AWS AppSync GraphQL endpoint. The ARN included in the EventBridge execution role policy is the AWS AppSync API ARN (a different ARN).

The AppSyncParameters field includes the GraphQL operation for EventBridge to invoke on the AWS AppSync API. This must be well formatted and match the GraphQL schema. Include any fields that must be available to subscribers in the selection set.

Testing subscriptions

AWS AppSync is now configured as a target for the EventBridge rule. The real-life display application would use a GraphQL library, such as AWS Amplify, to subscribe to real-time data changes. The AWS Management Console provides a useful utility to test. Navigate to the AWS AppSync console and select Queries in the menu for your API. Enter the following query and choose Run to subscribe for data changes:

subscription MySubscription {
  onFlightStatusUpdate {
    carrier
    date
    event
    num
    info {
      __typename
      … on DelayEventInfo {
        message
        delayMinutes
        newDepTime
      }
    }
  }
}

In a separate browser tab, navigate to the EventBridge console, and choose Send events. On the Send events page, select the required event bus and set the Event source to “airport-operations.” Then enter a detail type of your choice. Finally, paste the following as the Event detail, then choose Send.

{
  "id": "b051312994104931b0980d1ad1c5340f",
  "detail-type": "Operations: Flight delayed",
  "source": "airport-operations",
  "time": "2024-01-25T16:58:37Z",
  "detail": {
    "flightNum": 123,
    "carrierCode": "JK",
    "date": "2024-01-25",
    "event": "FlightDelayed",
    "message": "Delayed 15 minutes, late aircraft",
    "info": "{ \"newDepTime\": \"2024-01-25T13:15:00Z\", \"delayMinutes\": 15 }"
  }
}

Return to the AWS AppSync tab in your browser to see the changed data in the result pane:

Result pane

Conclusion

Directly invoking AWS AppSync GraphQL API targets from EventBridge simplifies and streamlines integration between these two services, ideal for notifying a variety of subscribers of data changes in event-driven workloads. You can also take advantage of other features available from the two services. For example, use AWS AppSync enhanced subscription filtering to update only airport displays in the terminal in which they are located.

To learn more about serverless, visit Serverless Land for a wide array of reusable patterns, tutorials, and learning materials. Newly added to the pattern library is an EventBridge to AWS AppSync pattern similar to the one described in this post. Visit EventBridge documentation for more details.

For more serverless learning resources, visit Serverless Land.

Disaster recovery strategies for Amazon MWAA – Part 1

Post Syndicated from Parnab Basak original https://aws.amazon.com/blogs/big-data/disaster-recovery-strategies-for-amazon-mwaa-part-1/

In the dynamic world of cloud computing, ensuring the resilience and availability of critical applications is paramount. Disaster recovery (DR) is the process by which an organization anticipates and addresses technology-related disasters. For organizations implementing critical workload orchestration using Amazon Managed Workflows for Apache Airflow (Amazon MWAA), it is crucial to have a DR plan in place to ensure business continuity.

In this series, we explore the need for Amazon MWAA disaster recovery and prescribe solutions that will sustain Amazon MWAA environments against unintended disruptions. This lets you to define, avoid, and handle disruption risks as part of your business continuity plan. This post focuses on designing the overall DR architecture. A future post in this series will focus on implementing the individual components using AWS services.

The need for Amazon MWAA disaster recovery

Amazon MWAA, a fully managed service for Apache Airflow, brings immense value to organizations by automating workflow orchestration for extract, transform, and load (ETL), DevOps, and machine learning (ML) workloads. Amazon MWAA has a distributed architecture with multiple components such as scheduler, worker, web server, queue, and database. This makes it difficult to implement a comprehensive DR strategy.

An active Amazon MWAA environment continuously parses Airflow Directed Acyclic Graphs (DAGs), reading them from a configured Amazon Simple Storage Service (Amazon S3) bucket. DAG source unavailability due to network unreachability, unintended corruption, or deletes leads to extended downtime and service disruption.

Within Airflow, the metadata database is a core component storing configuration variables, roles, permissions, and DAG run histories. A healthy metadata database is therefore critical for your Airflow environment. As with any core Airflow component, having a backup and disaster recovery plan in place for the metadata database is essential.

Amazon MWAA deploys Airflow components to multiple Availability Zones within your VPC in your preferred AWS Region. This provides fault tolerance and automatic recovery against a single Availability Zone failure. For mission-critical workloads, being resilient to the impairments of a unitary Region through multi-Region deployments is additionally important to ensure high availability and business continuity.

Balancing between costs to maintain redundant infrastructures, complexity, and recovery time is essential for Amazon MWAA environments. Organizations aim for cost-effective solutions that minimize their Recovery Time Objective (RTO) and Recovery Point Objective (RPO) to meet their service level agreements, be economically viable, and meet their customers’ demands.

Detect disasters in the primary environment: Proactive monitoring through metrics and alarms

Prompt detection of disasters in the primary environment is crucial for timely disaster recovery. Monitoring the Amazon CloudWatch SchedulerHeartbeat metric provides insights into Airflow health of an active Amazon MWAA environment. You can add other health check metrics to the evaluation criteria, such as checking the availability of upstream or downstream systems and network reachability. Combined with CloudWatch alarms, you can send notifications when these thresholds over a number of time periods are not met. You can add alarms to dashboards to monitor and receive alerts about your AWS resources and applications across multiple Regions.

AWS publishes our most up-to-the-minute information on service availability on the Service Health Dashboard. You can check at any time to get current status information, or subscribe to an RSS feed to be notified of interruptions to each individual service in your operating Region. The AWS Health Dashboard provides information about AWS Health events that can affect your account.

By combining metric monitoring, available dashboards, and automatic alarming, you can promptly detect unavailability of your primary environment, enabling proactive measures to transition to your DR plan. It is critical to factor in incident detection, notification, escalation, discovery, and declaration into your DR planning and implementation to provide realistic and achievable objectives that provide business value.

In the following sections, we discuss two Amazon MWAA DR strategy solutions and their architecture.

DR strategy solution 1: Backup and restore

The backup and restore strategy involves generating Airflow component backups in the same or different Region as your primary Amazon MWAA environment. To ensure continuity, you can asynchronously replicate these to your DR Region, with minimal performance impact on your primary Amazon MWAA environment. In the event of a rare primary Regional impairment or service disruption, this strategy will create a new Amazon MWAA environment and recover historical data to it from existing backups. However, it’s important to note that during the recovery process, there will be a period where no Airflow environments are operational to process workflows until the new environment is fully provisioned and marked as available.

This strategy provides a low-cost and low-complexity solution that is also suitable for mitigating against data loss or corruption within your primary Region. The amount of data being backed up and the time to create a new Amazon MWAA environment (typically 20–30 minutes) affects how quickly restoration can happen. To enable infrastructure to be redeployed quickly without errors, deploy using infrastructure as code (IaC). Without IaC, it may be complex to restore an analogous DR environment, which will lead to increased recovery times and possibly exceed your RTO.

Let’s explore the setup required when your primary Amazon MWAA environment is actively running, as shown in the following figure.

Backup and Restore - Pre

The solution comprises three key components. The first component is the primary environment, where the Airflow workflows are initially deployed and actively running. The second component is the disaster monitoring component, comprised of CloudWatch and a combination of an AWS Step Functions state machine and a AWS Lambda function. The third component is for creating and storing backups of all configurations and metadata that is required to restore. This can be in the same Region as your primary or replicated to your DR Region using S3 Cross-Region Replication (CRR). For CRR, you also pay for inter-Region data transfer out from Amazon S3 to each destination Region.

The first three steps in the workflow are as follows:

  1. As part of your backup creation process, Airflow metadata is replicated to an S3 bucket using an export DAG utility, run periodically based on your RPO interval.
  2. Your existing primary Amazon MWAA environment automatically emits the status of its scheduler’s health to the CloudWatch SchedulerHeartbeat metric.
  3. A multi-step Step Functions state machine is triggered from a periodic Amazon EventBridge schedule to monitor the scheduler’s health status. As the primary step of the state machine, a Lambda function evaluates the status of the SchedulerHeartbeat metric. If the metric is deemed healthy, no action is taken.

The following figure illustrates the additional steps in the solution workflow.

Backup and Restore post

  1. When the heartbeat count deviates from the normal count for a period of time, a series of actions are initiated to recover to a new Amazon MWAA environment in the DR Region. These actions include starting creation of a new Amazon MWAA environment, replicating the primary environment configurations, and then waiting for the new environment to become available.
  2. When the environment is available, an import DAG utility is run to restore the metadata contents from the backups. Any DAG runs that were interrupted during the impairment of the primary environment need to be manually rerun to maintain service level agreements. Future DAG runs are queued to run as per their next configured schedule.

DR strategy solution 2: Active-passive environments with periodic data synchronization

The active-passive environments with periodic data synchronization strategy focuses on maintaining recurrent data synchronization between an active primary and a passive Amazon MWAA DR environment. By periodically updating and synchronizing DAG stores and metadata databases, this strategy ensures that the DR environment remains current or nearly current with the primary. The DR Region can be the same or a different Region than your primary Amazon MWAA environment. In the event of a disaster, backups are available to revert to a previous known good state to minimize data loss or corruption.

This strategy provides low RTO and RPO with frequent synchronization, allowing quick recovery with minimal data loss. The infrastructure costs and code deployments are compounded to maintain both the primary and DR Amazon MWAA environments. Your DR environment is available immediately to run DAGs on.

The following figure illustrates the setup required when your primary Amazon MWAA environment is actively running.

Active Passive pre

The solution comprises four key components. Similar to the backup and restore solution, the first component is the primary environment, where the workflow is initially deployed and is actively running. The second component is the disaster monitoring component, consisting of CloudWatch and a combination of a Step Functions state machine and Lambda function. The third component creates and stores backups for all configurations and metadata required for the database synchronization. This can be in the same Region as your primary or replicated to your DR Region using Amazon S3 Cross-Region Replication. As mentioned earlier, for CRR, you also pay for inter-Region data transfer out from Amazon S3 to each destination Region. The last component is a passive Amazon MWAA environment that has the same Airflow code and environment configurations as the primary. The DAGs are deployed in the DR environment using the same continuous integration and continuous delivery (CI/CD) pipeline as the primary. Unlike the primary, DAGs are kept in a paused state to not cause duplicate runs.

The first steps of the workflow are similar to the backup and restore strategy:

  1. As part of your backup creation process, Airflow metadata is replicated to an S3 bucket using an export DAG utility, run periodically based on your RPO interval.
  2. Your existing primary Amazon MWAA environment automatically emits the status of its scheduler’s health to CloudWatch SchedulerHeartbeat metric.
  3. A multi-step Step Functions state machine is triggered from a periodic Amazon EventBridge schedule to monitor scheduler health status. As the primary step of the state machine, a Lambda function evaluates the status of the SchedulerHeartbeat metric. If the metric is deemed healthy, no action is taken.

The following figure illustrates the final steps of the workflow.

Active Passive post

  1. When the heartbeat count deviates from the normal count for a period of time, DR actions are initiated.
  2. As a first step, a Lambda function triggers an import DAG utility to restore the metadata contents from the backups to the passive Amazon MWAA DR environment. When the imports are complete, the same DAG can un-pause the other Airflow DAGs, making them active for future runs. Any DAG runs that were interrupted during the impairment of the primary environment need to be manually rerun to maintain service level agreements. Future DAG runs are queued to run as per their next configured schedule.

Best practices to improve resiliency of Amazon MWAA

To enhance the resiliency of your Amazon MWAA environment and ensure smooth disaster recovery, consider implementing the following best practices:

  • Robust backup and restore mechanisms – Implementing comprehensive backup and restore mechanisms for Amazon MWAA data is essential. Regularly deleting existing metadata based on your organization’s retention policies reduces backup times and makes your Amazon MWAA environment more performant.
  • Automation using IaC – Using automation and orchestration tools such as AWS CloudFormation, the AWS Cloud Development Kit (AWS CDK), or Terraform can streamline the deployment and configuration management of Amazon MWAA environments. This ensures consistency, reproducibility, and faster recovery during DR scenarios.
  • Idempotent DAGs and tasks – In Airflow, a DAG is considered idempotent if rerunning the same DAG with the same inputs multiple times has the same effect as running it only once. Designing idempotent DAGs and keeping tasks atomic decreases recovery time from failures when you have to manually rerun an interrupted DAG in your recovered environment.
  • Regular testing and validation – A robust Amazon MWAA DR strategy should include regular testing and validation exercises. By simulating disaster scenarios, you can identify any gaps in your DR plans, fine-tune processes, and ensure your Amazon MWAA environments are fully recoverable.

Conclusion

In this post, we explored the challenges for Amazon MWAA disaster recovery and discussed best practices to improve resiliency. We examined two DR strategy solutions: backup and restore and active-passive environments with periodic data synchronization. By implementing these solutions and following best practices, you can protect your Amazon MWAA environments, minimize downtime, and mitigate the impact of disasters. Regular testing, validation, and adaptation to evolving requirements are crucial for an effective Amazon MWAA DR strategy. By continuously evaluating and refining your disaster recovery plans, you can ensure the resilience and uninterrupted operation of your Amazon MWAA environments, even in the face of unforeseen events.

For additional details and code examples on Amazon MWAA, refer to the Amazon MWAA User Guide and the Amazon MWAA examples GitHub repo.


About the Authors

Parnab Basak is a Senior Solutions Architect and a Serverless Specialist at AWS. He specializes in creating new solutions that are cloud native using modern software development practices like serverless, DevOps, and analytics. Parnab works closely in the analytics and integration services space helping customers adopt AWS services for their workflow orchestration needs.

Chandan Rupakheti is a Solutions Architect and a Serverless Specialist at AWS. He is a passionate technical leader, researcher, and mentor with a knack for building innovative solutions in the cloud and bringing stakeholders together in their cloud journey. Outside his professional life, he loves spending time with his family and friends besides listening and playing music.

Vinod Jayendra is a Enterprise Support Lead in ISV accounts at Amazon Web Services, where he helps customers in solving their architectural, operational, and cost optimization challenges. With a particular focus on Serverless technologies, he draws from his extensive background in application development to deliver top-tier solutions. Beyond work, he finds joy in quality family time, embarking on biking adventures, and coaching youth sports team.

Rupesh Tiwari is a Senior Solutions Architect at AWS in New York City, with a focus on Financial Services. He has over 18 years of IT experience in the finance, insurance, and education domains, and specializes in architecting large-scale applications and cloud-native big data workloads. In his spare time, Rupesh enjoys singing karaoke, watching comedy TV series, and creating joyful moments with his family.

AWS Weekly Roundup—Amazon Route53, Amazon EventBridge, Amazon SageMaker, and more – January 15, 2024

Post Syndicated from Marcia Villalba original https://aws.amazon.com/blogs/aws/aws-weekly-roundup-amazon-route53-amazon-eventbridge-amazon-sagemaker-and-more-january-15-2024/

We are in January, the start of a new year, and I imagine many of you have made a new year resolution to learn something new. If you want to learn something new and get a free Amazon Web Services (AWS) Learning Badge, check out the new Events and Workflows Learning Path. This learning path will teach you everything you need to know about AWS Step Functions, Amazon EventBridge, event-driven architectures, and serverless, and when you finish the learning path, you can take an assessment. If you pass the assessment, you get an AWS Learning Badge, credited by Credly, that you can share in your résumé and social media profiles.

Events and workflows learning path badge

Last Week’s Launches
Here are some launches that got my attention during the previous week.

Amazon Route 53 – Now you can enable Route 53 Resolver DNS Firewall to filter DNS traffic based on the query type contained in the question section of the DNS query format. In addition, Route 53 now supports geoproximity routing as an additional routing policy for DNS records. Expand and reduce the geographic area from which traffic is routed to a resource by changing the record’s bias value. This is really helpful for industries that need to deliver highly responsive digital experiences.

Amazon CloudWatch LogsCloudWatch Logs now support creating account-level subscription filters. This capability allows you to forward all the logs groups from an account to other services like Amazon OpenSearch Service or Amazon Kinesis Data Firehose.

Amazon Elastic Container Service (Amazon ECS) Amazon ECS now integrates with Amazon Elastic Block Store (Amazon EBS), allowing you to provision and attach EBS volumes to Amazon ECS tasks running on both AWS Fargate and Amazon Elastic Cloud Compute (Amazon EC2). Read the blog post Channy wrote where he shows this feature in action.

Amazon EventBridgeEventBridge now supports AWS AppSync as a target of EventBridge buses. This enables you to stream real-time updates from your backend applications to your front-end clients. For example, you can get notifications in your mobile application from an order you did when the order status changes on the backend.

Amazon SageMakerSageMaker now supports M7i, C7i, and R7i instances for machine learning (ML) inference. These instances are powered by custom 4th generation Intel Xeon scalable processors and deliver up to 15 percent better price performance than their previous generations.

For a full list of AWS announcements, be sure to keep an eye on the What’s New at AWS page.

Other AWS News
Some other updates and news that you may have missed:

If you are a serverless enthusiast, this week, the AWS Compute Blog published the Serverless ICYMI (in case you missed it) quarterly recap for the last quarter of 2023. This post compiles the announcements made during the months of October, November, and December, with all the relevant content that was produced by AWS Developer Advocates during that time. In addition to that blog post, you can learn about ServerlessVideo, a new demo application that we launched at AWS re:Invent 2023.

ServerlessVideo

This week there were also a couple of really interesting blog posts that explain how to solve very common challenges that customers face. The first one is the blog post in the AWS Security Blog that explains how to customize access tokens in Amazon Cognito user pools. And the second one is from the AWS Database Blog, which explains how to effectively sort data with Amazon DynamoDB.

The Official AWS Podcast – Listen each week for updates on the latest AWS news and deep dives into exciting use cases. There are also official AWS podcasts in several languages. Check out the ones in FrenchGermanItalian, and Spanish.

AWS open source newsletter – This is a newsletter curated by my colleague Ricardo to bring you the latest open source projects, posts, events, and more.

For our customers in Turkey, on January 1, 2024, AWS Turkey Pazarlama Teknoloji ve Danışmanlık Hizmetleri Limited Şirketi (AWS Turkey) replaced AWS EMEA SARL (AWS Europe) as the contracting party and service provider to customers in Türkiye. This enables AWS customers in Türkiye to transact in their local currency (Turkish Lira) and with a local bank. For more information on AWS Turkey, visit the FAQ page.

Upcoming AWS Events
The beginning of the year is the season of AWS re:Invent recaps, which are happening all around the globe during the next two months. You can check the recaps page to find the one closest to you.

You can browse all upcoming AWS led in-person and virtual events, as well as developer-focused events such as AWS DevDay.

That’s all for this week. Check back next Monday for another Week in Review!

— Marcia

This post is part of our Weekly Roundup series. Check back each week for a quick roundup of interesting news and announcements from AWS!

Enable metric-based and scheduled scaling for Amazon Managed Service for Apache Flink

Post Syndicated from Francisco Morillo original https://aws.amazon.com/blogs/big-data/enable-metric-based-and-scheduled-scaling-for-amazon-managed-service-for-apache-flink/

Thousands of developers use Apache Flink to build streaming applications to transform and analyze data in real time. Apache Flink is an open source framework and engine for processing data streams. It’s highly available and scalable, delivering high throughput and low latency for the most demanding stream-processing applications. Monitoring and scaling your applications is critical to keep your applications running successfully in a production environment.

Amazon Managed Service for Apache Flink is a fully managed service that reduces the complexity of building and managing Apache Flink applications. Amazon Managed Service for Apache Flink manages the underlying Apache Flink components that provide durable application state, metrics, logs, and more.

In this post, we show a simplified way to automatically scale up and down the number of KPUs (Kinesis Processing Units; 1 KPU is 1 vCPU and 4 GB of memory) of your Apache Flink applications with Amazon Managed Service for Apache Flink. We show you how to scale by using metrics such as CPU, memory, backpressure, or any custom metric of your choice. Additionally, we show how to perform scheduled scaling, allowing you to adjust your application’s capacity at specific times, particularly when dealing with predictable workloads. We also share an AWS CloudFormation utility to help you implement auto scaling quickly with your Amazon Managed Service for Apache Flink applications.

Metric-based scaling

This section describes how to implement a scaling solution for Amazon Managed Service for Apache Flink based on Amazon CloudWatch metrics. Amazon Managed Service for Apache Flink comes with an auto scaling option out of the box that scales out when container CPU utilization is above 75% for 15 minutes. This works well for many use cases; however, for some applications, you may need to scale based on a different metric, or trigger the scaling action at a certain point in time or by a different factor. You can customize your scaling policies and save costs by right-sizing your Amazon Managed Apache Flink applications the deploying this solution.

To perform metric-based scaling, we use CloudWatch alarms, Amazon EventBridge, AWS Step Functions, and AWS Lambda. You can choose from metrics coming from the source such as Amazon Kinesis Data Streams or Amazon Managed Streaming for Apache Kafka (Amazon MSK), or metrics from the Amazon Managed Service for Apache Flink application. You can find these components in the CloudFormation template in the GitHub repo.

The following diagram shows how to scale an Amazon Managed Service for Apache Flink application in response to a CloudWatch alarm.

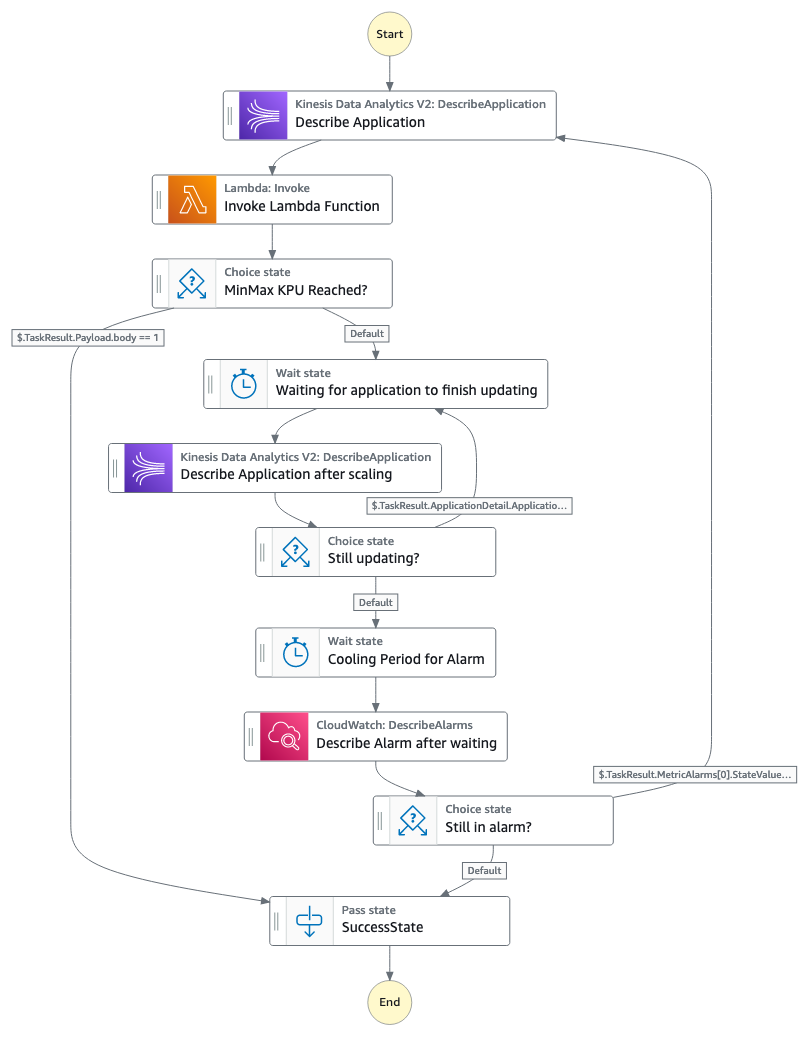
This solution uses the metric selected and creates two CloudWatch alarms that, depending on the threshold you use, trigger a rule in EventBridge to start running a Step Functions state machine. The following diagram illustrates the state machine workflow.

Note: Amazon Kinesis Data Analytics was renamed to Amazon Managed Service for Apache Flink August 2023

The Step Functions workflow consists of the following steps:

  1. The state machine describes the Amazon Managed Service for Apache Flink application, which will provide information related to the current number of KPUs in the application, as well if the application is being updated or is it running.
  2. The state machine invokes a Lambda function that, depending on which alarm was triggered, will scale the application up or down, following the parameters set in the CloudFormation template. When scaling the application, it will use the increase factor (either add/subtract or multiple/divide based on that factor) defined in the CloudFormation template. You can have different factors for scaling in or out. If you want to take a more cautious approach to scaling, you can use add/subtract and use an increase factor for scaling in/out of 1.
  3. If the application has reached the maximum or minimum number of KPUs set in the parameters of the CloudFormation template, the workflow stops. Keep in mind that Amazon Managed Service for Apache Flink applications have a default maximum of 64 KPUs (you can request to increase this limit). Do not specify a maximum value above 64 KPUs if you have not requested to increase the quota, because the scaling solution will get stuck by failing to update.
  4. If the workflow continues, because the allocated KPUs haven’t reached the maximum or minimum values, the workflow will wait for a period of time you specify, and then describe the application and see if it has finished updating.
  5. The workflow will continue to wait until the application has finished updating. When the application is updated, the workflow will wait for a period of time you specify in the CloudFormation template, to allow the metric to fall within the threshold and have the CloudWatch rule change from ALARM state to OK.
  6. If the metric is still in ALARM state, the workflow will start again and continue to scale the application either up or down. If the metric is in OK state, the workflow will stop.

For applications that read from a Kinesis Data Streams source, you can use the metric millisBehindLatest. If using a Kafka source, you can use records lag max for scaling events. These metrics capture how far behind your application is from the head of the stream. You can also use a custom metric that you have registered in your Apache Flink applications.

The sample CloudFormation template allows you to select one of the following metrics:

  • Amazon Managed Service for Apache Flink application metrics – Requires an application name:
    • ContainerCPUUtilization – Overall percentage of CPU utilization across task manager containers in the Flink application cluster.
    • ContainerMemoryUtilization – Overall percentage of memory utilization across task manager containers in the Flink application cluster.
    • BusyTimeMsPerSecond – Time in milliseconds the application is busy (neither idle nor back pressured) per second.
    • BackPressuredTimeMsPerSecond – Time in milliseconds the application is back pressured per second.
    • LastCheckpointDuration – Time in milliseconds it took to complete the last checkpoint.
  • Kinesis Data Streams metrics – Requires the data stream name:
    • MillisBehindLatest – The number of milliseconds the consumer is behind the head of the stream, indicating how far behind the current time the consumer is.
    • IncomingRecords – The number of records successfully put to the Kinesis data stream over the specified time period. If no records are coming, this metric will be null and you won’t be able to scale down.
  • Amazon MSK metrics – Requires the cluster name, topic name, and consumer group name):
    • MaxOffsetLag – The maximum offset lag across all partitions in a topic.
    • SumOffsetLag – The aggregated offset lag for all the partitions in a topic.
    • EstimatedMaxTimeLag – The time estimate (in seconds) to drain MaxOffsetLag.
  • Custom metrics – Metrics you can define as part of your Apache Flink applications. Most common metrics are counters (continuously increase) or gauges (can be updated with last value). For this solution, you need to add the kinesisAnalytics dimension to the metric group. You also need to provide the custom metric name as a parameter in the CloudFormation template. If you need to use more dimensions in your custom metric, you need to modify the CloudWatch alarm so it’s able to use your specific metric. For more information on custom metrics, see Using Custom Metrics with Amazon Managed Service for Apache Flink.

The CloudFormation template deploys the resources as well as the auto scaling code. You only need to specify the name of the Amazon Managed Service for Apache Flink application, the metric to which you want to scale your application in or out, and the thresholds for triggering an alarm. The solution by default will use the average aggregation for metrics and a period duration of 60 seconds for each data point. You can configure the evaluation periods and data points to alarm when defining the CloudFormation template.

Scheduled scaling

This section describes how to implement a scaling solution for Amazon Managed Service for Apache Flink based on a schedule. To perform scheduled scaling, we use EventBridge and Lambda, as illustrated in the following figure.

These components are available in the CloudFormation template in the GitHub repo.

The EventBridge scheduler is triggered based on the parameters set when deploying the CloudFormation template. You define the KPU of the applications when running at peak times, as well as the KPU for non-peak times. The application runs with those KPU parameters depending on the time of day.

As with the previous example for metric-based scaling, the CloudFormation template deploys the resources and scaling code required. You only need to specify the name of the Amazon Managed Service for Apache Flink application and the schedule for the scaler to modify the application to the set number of KPUs.

Considerations for scaling Flink applications using metric-based or scheduled scaling

Be aware of the following when considering these solutions:

  • When scaling Amazon Managed Service for Apache Flink applications in or out, you can choose to either increase the overall application parallelism or modify the parallelism per KPU. The latter allows you to set the number of parallel tasks that can be scheduled per KPU. This sample only updates the overall parallelism, not the parallelism per KPU.
  • If SnapshotsEnabled is set to true in ApplicationSnapshotConfiguration, Amazon Managed Service for Apache Flink will automatically pause the application, take a snapshot, and then restore the application with the updated configuration whenever it is updated or scaled. This process may result in downtime for the application, depending on the state size, but there will be no data loss. When using metric-based scaling, you have to choose a minimum and a maximum threshold of KPU the application can have. Depending on by how much you perform the scaling, if the new desired KPU is bigger or lower than your thresholds, the solution will update the KPUs to be equal to your thresholds.
  • When using metric-based scaling, you also have to choose a cooling down period. This is the amount of time you want your application to wait after being updated, to see if the metric has gone from ALARM status to OK status. This value depends on how long are you willing to wait before another scaling event to occur.
  • With the metric-based scaling solution, you are limited to choosing the metrics that are listed in the CloudFormation template. However, you can modify the alarms to use any available metric in CloudWatch.
  • If your application is required to run without interruptions for periods of time, we recommend using scheduled scaling, to limit scaling to non-critical times.

Summary

In this post, we covered how you can enable custom scaling for Amazon Managed Service for Apache Flink applications using enhanced monitoring features from CloudWatch integrated with Step Functions and Lambda. We also showed how you can configure a schedule to scale an application using EventBridge. Both of these samples and many more can be found in the GitHub repo.


About the Authors

Deepthi Mohan is a Principal PMT on the Amazon Managed Service for Apache Flink team.

Francisco Morillo is a Streaming Solutions Architect at AWS. Francisco works with AWS customers, helping them design real-time analytics architectures using AWS services, supporting Amazon Managed Streaming for Apache Kafka (Amazon MSK) and Amazon Managed Service for Apache Flink.

AWS Weekly Roundup — AWS Lambda, AWS Amplify, Amazon OpenSearch Service, Amazon Rekognition, and more — December 18, 2023

Post Syndicated from Donnie Prakoso original https://aws.amazon.com/blogs/aws/aws-weekly-roundup-aws-lambda-aws-amplify-amazon-opensearch-service-amazon-rekognition-and-more-december-18-2023/

My memories of Amazon Web Services (AWS) re:Invent 2023 are still fresh even when I’m currently wrapping up my activities in Jakarta after participating in AWS Community Day Indonesia. It was a great experience, from delivering chalk talks and having thoughtful discussions with AWS service teams, to meeting with AWS Heroes, AWS Community Builders, and AWS User Group leaders. AWS re:Invent brings the global AWS community together to learn, connect, and be inspired by innovation. For me, that spirit of connection is what makes AWS re:Invent always special.

Here’s a quick look of my highlights at AWS re:Invent and AWS Community Day Indonesia:

If you missed AWS re:Invent, you can watch the keynotes and sessions on demand. Also, check out the AWS News Editorial Team’s Top announcements of AWS re:Invent 2023 for all the major launches.

Recent AWS launches
Here are some of the launches that caught my attention in the past two weeks:

Query MySQL and PostgreSQL with AWS Amplify – In this post, Channy wrote how you can now connect your MySQL and PostgreSQL databases to AWS Amplify with just a few clicks. It generates a GraphQL API to query your database tables using AWS CDK.

Migration Assistant for Amazon OpenSearch Service – With this self-service solution, you can smoothly migrate from your self-managed clusters to Amazon OpenSearch Service managed clusters or serverless collections.

AWS Lambda simplifies connectivity to Amazon RDS and RDS Proxy – Now you can connect your AWS Lambda to Amazon RDS or RDS proxy using the AWS Lambda console. With a guided workflow, this improvement helps to minimize complexities and efforts to quickly launch a database instance and correctly connect a Lambda function.

New no-code dashboard application to visualize IoT data – With this announcement, you can now visualize and interact with operational data from AWS IoT SiteWise using a new open source Internet of Things (IoT) dashboard.

Amazon Rekognition improves Face Liveness accuracy and user experience – This launch provides higher accuracy in detecting spoofed faces for your face-based authentication applications.

AWS Lambda supports additional concurrency metrics for improved quota monitoring – Add CloudWatch metrics for your Lambda quotas, to improve visibility into concurrency limits.

AWS Malaysia now supports 3D-Secure authentication – This launch enables 3DS2 transaction authentication required by banks and payment networks, facilitating your secure online payments.

Announcing AWS CloudFormation template generation for Amazon EventBridge Pipes – With this announcement, you can now streamline the deployment of your EventBridge resources with CloudFormation templates, accelerating event-driven architecture (EDA) development.

Enhanced data protection for CloudWatch Logs – With the enhanced data protection, CloudWatch Logs helps identify and redact sensitive data in your logs, preventing accidental exposure of personal data.

Send SMS via Amazon SNS in Asia Pacific – With this announcement, now you can use SMS messaging across Asia Pacific from the Jakarta Region.

Lambda adds support for Python 3.12 – This launch brings the latest Python version to your Lambda functions.

CloudWatch Synthetics upgrades Node.js runtime – Now you can use Node.js 16.1 runtimes for your canary functions.

Manage EBS Volumes for your EC2 fleets – This launch simplifies attaching and managing EBS volumes across your EC2 fleets.

See you next year!
This is the last AWS Weekly Roundup for this year, and we’d like to thank you for being our wonderful readers. We’ll be back to share more launches for you on January 8, 2024.

Happy holidays!

Donnie

Introducing support for read-only management events in Amazon EventBridge

Post Syndicated from Eric Johnson original https://aws.amazon.com/blogs/compute/introducing-support-for-read-only-management-events-in-amazon-eventbridge/

This post is written by Pawan Puthran, Principal Specialist TAM, Serverless and Heeki Park, Principal Solutions Architect, Serverless

Today, AWS is announcing support for read-only management events in Amazon EventBridge. This feature enables customers to build rich event-driven responses from any action taken on AWS infrastructure to detect security vulnerabilities or identify suspicious activity in near real-time. You can now gain insight into all activity across all your AWS accounts and respond to those events as is appropriate.

Overview

EventBridge is a serverless event bus used to decouple event producers and consumers. Event producers publish events onto an event bus, which then uses rules to determine where to send those events. The rules determine the downstream targets that receive and process the events, and EventBridge routes the events accordingly.

EventBridge allows customers to monitor, audit, and react, in near real-time, to changes in their AWS environments through events generated by AWS CloudTrail for AWS API calls. CloudTrail records actions taken by a user, role, or an AWS service as events in a trail. Events include actions taken in the AWS Management Console, AWS Command Line Interface (CLI), and AWS SDKs and APIs.

Previously, only mutating API calls are published from CloudTrail to EventBridge for control plane changes. Events for mutating API calls include those that create, update, or delete resources. Control plane changes are also referred to as management events. EventBridge now supports non-mutating or read-only API calls for management events at no additional cost. These include those that list, get, or describe resources.

CloudTrail events in EventBridge enable you to build rich event-driven responses from any action taken on AWS infrastructure in real time. Previously, customers and partners often used a polling model to iterate over a batch of CloudTrail logs from Amazon S3 buckets to detect issues, making it slower to respond. The launch of read-only management events enables you to detect and remediate issues in near real-time and thus improve the overall security posture.

Enabling read-only management events

You can start receiving read-only management events if a CloudTrail is configured in your account and if the event selector for that CloudTrail is configured with ReadWriteType of either All or ReadOnly. This ensures that the read-only management events are logged in the CloudTrail and are then passed to EventBridge.

For example, you can receive an alert if a production account lists resources from an IP address outside of your VPC. Another example could be if an entity, such as a principal (AWS account root user, IAM role, or IAM user), calls the ListInstanceProfilesForRole or DescribeInstances APIs without any prior record of doing so. A malicious actor could use stolen credentials for conducting this reconnaissance to find more valuable credentials or determine the capabilities of the credentials they have.

To enable read-only management events with an EventBridge rule, in addition to the existing mutating events, use the new ENABLED_WITH_ALL_CLOUDTRAIL_MANAGEMENT_EVENTS state when creating the rule.

Resources:
  SampleMgmtRule:
    Type: 'AWS::Events::Rule'
    Properties:
      Description: 'Example for enabling read-only management events'
      State: ENABLED_WITH_ALL_CLOUDTRAIL_MANAGEMENT_EVENTS
      EventPattern:
        source:
          - aws.s3
        detail:
          - AWS API Call via CloudTrail
      Targets:
        - Arn: 'arn:aws:sns:us-east-1:123456789012:notificationTopic'
          Id: 'NotificationTarget'

You can also create a rule on an event bus to specify a particular API action by using the eventName attribute under the detail key:

aws events put-rule --name "SampleTestRule" \
--event-pattern '{"detail": {"eventName": ["ListBuckets"]}}' \
--state ENABLED_WITH_ALL_CLOUDTRAIL_MANAGEMENT_EVENTS --region us-east-1

Common scenarios and use-cases

The following section describes a couple of the scenarios where you can set up EventBridge rules and take actions on non-mutating or read-only management events.

Detecting anomalous Secrets Manager GetSecretValue API Calls

Consider the security team of your organization that wants a notification whenever GetSecretValue API calls for AWS Secrets Manager are made through the CLI. They can then investigate if these calls are made by entities outside their organization or by an unauthorized user and take corrective actions to deny such requests.

When the application calls the GetSecretValue API to retrieve the secrets via a CLI, it generates an event like this:

{
    "version": "0",
    "id": "d3368cc1-e6d6-e4bf-e58e-030f03b6eae3",
    "detail-type": "AWS API Call via CloudTrail",
    "source": "aws.secretsmanager",
    "account": "111111111111",
    "time": "2023-11-08T19:58:38Z",
    "region": "us-east-1",
    "resources": [],
    "detail": {
        "eventVersion": "1.08",
        "userIdentity": {
            "type": "IAMUser",
            "principalId": "AAAAAAAAAAAAA",
            "arn": "arn:aws:iam:: 111111111111:user/USERNAME"
            // ... additional detail fields
        },
        "eventTime": "2023-11-08T19:58:38Z",
        "eventSource": "secretsmanager.amazonaws.com",
        "eventName": "GetSecretValue",
        "awsRegion": "us-east-1",
        "userAgent": "aws-cli/2.13.15 Python/3.11.4 Darwin/22.6.0 exe/x86_64 prompt/off command/secretsmanager.get-secret-value"
        // ... additional detail fields
    }
}

You set the following event pattern on the rule to filter incoming events to specific consumers. This example also uses the recently launched wildcard filter for event matching.

{
    "source": [
        "aws.secretsmanager"
    ],
    "detail-type": [
        "AWS API Call via CloudTrail"
    ],
    "detail": {
        "eventName": [
            "GetSecretValue"
        ],
        "userAgent": [
            {
                "wildcard": "aws-cli/*"
            }
        ]
    }
}

You can create a rule matching a combination of these event properties. In this case, you are matching for aws.secretsmanager as source, AWS API Call via CloudTrail as detail-type, GetSecretValue as detail.eventName and wildcard pattern on detail.userAgent for aws-cli/*. You can filter detail.userAgent with a wildcard to catch events that come from a particular application or user.

You can then route these events to a target like an Amazon CloudWatch Logs stream to record the change. You can also route them to Amazon SNS to get notified via email subscription. You can alternatively route them to an AWS Lambda function in which you perform custom business logic.

Creating an EventBridge rule for read-only management events

  1. Create a rule on the default event bus using the new state ENABLED_WITH_ALL_CLOUDTRAIL_MANAGEMENT_EVENTS.
    aws events put-rule --name "monitor-secretsmanager" \
    --event-pattern '{"source": ["aws.secretsmanager"], "detail-type": ["AWS API Call via CloudTrail"], "detail": {"eventName": ["GetSecretValue"], "userAgent": [{ "wildcard": "aws-cli/*"} ]}}' \
    --state ENABLED_WITH_ALL_CLOUDTRAIL_MANAGEMENT_EVENTS --region us-east-1

    Rule details

    Rule details

  2. Configure a target. In this case, the target service is CloudWatch Logs but you can configure any of the supported targets.
    aws events put-targets --rule monitor-secretsmanager --targets Id=1,Arn=arn:aws:logs:us-east-1:ACCOUNT_ID:log-group:/aws/events/getsecretvaluelogs --region us-east-1

    Target details

    Target details

You can then use CloudWatch Log Insights to search and analyze log data using the CloudWatch Log Insights query syntax where you can retrieve the user who performed these calls.

Identifying suspicious data exfiltration behavior

Consider the security or data perimeter team who wants to secure data residing in Amazon S3 buckets. The team requires notifications whenever API calls to list S3 buckets or to list S3 objects are made.

When a user or application calls the ListBuckets API to discover the available buckets, it generates the following CloudTrail event:

{
    "version": "0",
    "id": "345ca690-6510-85b2-ff02-090493a33cf1",
    "detail-type": "AWS API Call via CloudTrail",
    "source": "aws.s3",
    "account": "111111111111",
    "time": "2023-11-14T17:25:30Z",
    "region": "us-east-1",
    "resources": [],
    "detail": {
        "eventVersion": "1.09",
        "userIdentity": {
            "type": "IAMUser",
            "principalId": "principal-identity-uuid",
            "arn": "arn:aws:iam::111111111111:user/exploited-user",
            "accountId": "111111111111",
            "accessKeyId": "AAAABBBBCCCCDDDDEEEE",
            "userName": "exploited-user"
        },
        "eventTime": "2023-11-14T17:25:30Z",
        "eventSource": "s3.amazonaws.com",
        "eventName": "ListBuckets",
        "awsRegion": "us-east-1",
        "sourceIPAddress": "11.22.33.44",
        "userAgent": "[aws-cli/2.13.29 Python/3.11.6 Darwin/22.6.0 exe/x86_64 prompt/off command/s3api.list-buckets]",
        "requestParameters": {
            "Host": "s3.us-east-1.amazonaws.com"
        },
        "readOnly": true,
        "eventType": "AwsApiCall",
        "managementEvent": true
        // additional detail fields
    }
}

In this scenario, you can create an EventBridge rule matching for aws.s3 for the source field, and ListBuckets for the eventName.

{
    "source": [
        "aws.s3"
    ],
    "detail-type": [
        "AWS API Call via CloudTrail"
    ],
    "detail": {
        "eventName": [
            "ListBuckets "
        ]
    }
}

However, listing objects alone might only be the beginning of a potential data exfiltration attempt. You may also want to check for ListObjects or ListObjectsV2 as the next action, followed by a large number of GetObject API calls. You can create the following rule to match those actions.

{
    "source": [
        "aws.s3"
    ],
    "detail-type": [
        "AWS API Call via CloudTrail"
    ],
    "detail": {
        "eventName": [
            "ListObjects",
            "ListObjectsV2",
            "GetObject"
        ]
    }
}

You could potentially forward this log information to your central security logging solution or use anomaly detection machine learning models to evaluate these events to determine the appropriate response to these events.

Configuring cross-account and cross-Region event routing

You can also create rules to receive the read-only events to cross account or cross-Region to centralize your AWS events into one Region or one AWS account for auditing and monitoring purposes. For example, capture all workload events from multiple Regions in eu-west-1 for compliance reporting.

Cross Account example for default event bus and custom event bus

Cross Account example for default event bus and custom event bus

To do this, create a rule using the new ENABLED_WITH_ALL_CLOUDTRAIL_MANAGEMENT_EVENTS state on the default bus of the source account or the Region, targeting either default event bus or a custom event bus of the target account or Region. You must also ensure you have a rule configured with ENABLED_WITH_ALL_CLOUDTRAIL_MANAGEMENT_EVENTS to be able to invoke the targets in the destination account or Region.

Cross-Region setup for CloudTrail read-only events

Cross-Region setup for CloudTrail read-only events

Conclusion

This blog shows how customers can build rich event-driven responses with the newly launched support for read-only events. You can now observe events as potential signals of reconnaissance and data exfiltration activities from any action taken on AWS infrastructure in near real time. You can also use the cross-Region and cross-account functionality to deliver the read-only events to a centralized AWS account or Region, enhancing the capability for auditing and monitoring across all your AWS environments.

For more serverless learning resources, visit Serverless Land.

Introducing the AWS Integrated Application Test Kit (IATK)

Post Syndicated from James Beswick original https://aws.amazon.com/blogs/compute/aws-integrated-application-test-kit/

This post is written by Dan Fox, Principal Specialist Solutions Architect, and Brian Krygsman, Senior Solutions Architect.

Today, AWS announced the public preview launch of the AWS Integrated Application Test Kit (IATK). AWS IATK is a software library that helps you write automated tests for cloud-based applications. This blog post presents several initial features of AWS IATK, and then shows working examples using an example video processing application. If you are getting started with serverless testing, learn more at serverlessland.com/testing.

Overview

When you create applications composed of serverless services like AWS Lambda, Amazon EventBridge, or AWS Step Functions, many of your architecture components cannot be deployed to your desktop, but instead only exist in the AWS Cloud. In contrast to working with applications deployed locally, these types of applications benefit from cloud-based strategies for performing automated tests. For its public preview launch, AWS IATK helps you implement some of these strategies for Python applications. AWS IATK will support other languages in future launches.

Locating resources for tests

When you write automated tests for cloud resources, you need the physical IDs of your resources. The physical ID is the name AWS assigns to a resource after creation. For example, to send requests to Amazon API Gateway you need the physical ID, which forms the API endpoint.

If you deploy cloud resources in separate infrastructure as code stacks, you might have difficulty locating physical IDs. In CloudFormation, you create the logical IDs of the resources in your template, as well as the stack name. With IATK, you can get the physical ID of a resource if you provide the logical ID and stack name. You can also get stack outputs by providing the stack name. These convenient methods simplify locating resources for the tests that you write.

Creating test harnesses for event driven architectures

To write integration tests for event driven architectures, establish logical boundaries by breaking your application into subsystems. Your subsystems should be simple enough to reason about, and contain understandable inputs and outputs. One useful technique for testing subsystems is to create test harnesses. Test harnesses are resources that you create specifically for testing subsystems.

For example, an integration test can begin a subsystem process by passing an input test event to it. IATK can create a test harness for you that listens to Amazon EventBridge for output events. (Under the hood, the harness is composed of an EventBridge Rule that forwards the output event to Amazon Simple Queue Service.) Your integration test then queries the test harness to examine the output and determine if the test passes or fails. These harnesses help you create integration tests in the cloud for event driven architectures.

Establishing service level agreements to test asynchronous features

If you write a synchronous service, your automated tests make requests and expect immediate responses. When your architecture is asynchronous, your service accepts a request and then performs a set of actions at a later time. How can you test for the success of an activity if it does not have a specified duration?

Consider creating reasonable timeouts for your asynchronous systems. Document timeouts as service level agreements (SLAs). You may decide to publish your SLAs externally or to document them as internal standards. IATK contains a polling feature that allows you to establish timeouts. This feature helps you to test that your asynchronous systems complete tasks in a timely manner.

Using AWS X-Ray for detailed testing

If you want to gain more visibility into the interior details of your application, instrument with AWS X-Ray. With AWS X-Ray, you trace the path of an event through multiple services. IATK provides conveniences that help you set the AWS X-Ray sampling rate, get trace trees, and assert for trace durations. These features help you observe and test your distributed systems in greater detail.

Learn more about testing asynchronous architectures at aws-samples/serverless-test-samples.

Overview of the example application

To demonstrate the features of IATK, this post uses a portion of a serverless video application designed with a plugin architecture. A core development team creates the primary application. Distributed development teams throughout the organization create the plugins. One AWS CloudFormation stack deploys the primary application. Separate stacks deploy each plugin.

Communications between the primary application and the plugins are managed by an EventBridge bus. Plugins pull application lifecycle events off the bus and must put completion notification events back on the bus within 20 seconds. For testing, the core team has created an AWS Step Functions workflow that mimics the production process by emitting properly formatted example lifecycle events. Developers run this test workflow in development and test environments to verify that their plugins are communicating properly with the event bus.

The following demonstration shows an integration test for the example application that validates plugin behavior. In the integration test, IATK locates the Step Functions workflow. It creates a test harness to listen for the event completion notification to be sent by the plugin. The test then runs the workflow to begin the lifecycle process and start plugin actions. Then IATK uses a polling mechanism with a timeout to verify that the plugin complies with the 20 second service level agreement. This is the sequence of processing:

Sequence of processing

  1. The integration test starts an execution of the test workflow.
  2. The workflow puts a lifecycle event onto the bus.
  3. The plugin pulls the lifecycle event from the bus.
  4. When the plugin is complete, it puts a completion event onto the bus.
  5. The integration test polls for the completion event to determine if the test passes within the SLA.

Deploying and testing the example application

Follow these steps to review this application, build it locally, deploy it in your AWS account, and test it.

Downloading the example application

  1. Open your terminal and clone the example application from GitHub with the following command or download the code. This repository also includes other example patterns for testing serverless applications.
    git clone https://github.com/aws-samples/serverless-test-samples
  2. The root of the IATK example application is in python-test-samples/integrated-application-test-kit. Change to this directory:
    cd serverless-test-samples/python-test-samples/integrated-application-test-kit

Reviewing the integration test

Before deploying the application, review how the integration test uses the IATK by opening plugins/2-postvalidate-plugins/python-minimal-plugin/tests/integration/test_by_polling.py in your text editor. The test class instantiates the IATK at the top of the file.

iatk_client = aws_iatk.AwsIatk(region=aws_region)

In the setUp() method, the test class uses IATK to fetch CloudFormation stack outputs. These outputs are references to deployed cloud components like the plugin tester AWS Step Functions workflow:

stack_outputs = self.iatk_client.get_stack_outputs(
    stack_name=self.plugin_tester_stack_name,
    output_names=[
        "PluginLifecycleWorkflow",
        "PluginSuccessEventRuleName"
    ],
)

The test class attaches a listener to the default event bus using an Event Rule provided in the stack outputs. The test uses this listener later to poll for events.

add_listener_output = self.iatk_client.add_listener(
    event_bus_name="default",
    rule_name=self.existing_rule_name
)

The test class cleans up the listener in the tearDown() method.

self.iatk_client.remove_listeners(
    ids=[self.listener_id]
)

Once the configurations are complete, the method test_minimal_plugin_event_published_polling() implements the actual test.

The test first initializes the trigger event.

trigger_event = {
    "eventHook": "postValidate",
    "pluginTitle": "PythonMinimalPlugin"
}

Next, the test starts an execution of the plugin tester Step Functions workflow. It uses the plugin_tester_arn that was fetched during setUp.

self.step_functions_client.start_execution(
    stateMachineArn=self.plugin_tester_arn,
    input=json.dumps(trigger_event)
)

The test polls the listener, waiting for the plugin to emit events. It stops polling once it hits the SLA timeout or receives the maximum number of messages.

poll_output = self.iatk_client.poll_events(
    listener_id=self.listener_id,
    wait_time_seconds=self.SLA_TIMEOUT_SECONDS,
    max_number_of_messages=1,
)

Finally, the test asserts that it receives the right number of events, and that they are well-formed.

self.assertEqual(len(poll_output.events), 1)
self.assertEqual(received_event["source"], "video.plugin.PythonMinimalPlugin")
self.assertEqual(received_event["detail-type"], "plugin-complete")

Installing prerequisites

You need the following prerequisites to build this example:

Build and deploy the example application components

  1. Use AWS SAM to build and deploy the plugin tester to your AWS account. The plugin tester is the Step Functions workflow shown in the preceding diagram. During the build process, you can add the --use-container flag to the build command to instruct AWS SAM to create the application in a provided container. You can accept or override the default values during the deploy process. You will use “Stack Name” and “AWS Region” later to run the integration test.
    cd plugins/plugin_tester # Move to the plugin tester directory
    
    sam build --use-container # Build the plugin tester
    

    sam build

  2. Deploy the tester:
    sam deploy --guided # Deploy the plugin tester

    Deploy the tester

  3. Once the plugin tester is deployed, use AWS SAM to deploy the plugin.
    cd ../2-postvalidate-plugins/python-minimal-plugin # Move to the plugin directory
    
    sam build --use-container # Build the plugin

    Deploy the plugin

  4. Deploy the plugin:
    sam deploy --guided # Deploy the plugin

Running the test

You can run tests written with IATK using standard Python test runners like unittest and pytest. The example application test uses unittest.

    1. Use a virtual environment to organize your dependencies. From the root of the example application, run:
      python3 -m venv .venv # Create the virtual environment
      source .venv/bin/activate # Activate the virtual environment
      
    2. Install the dependencies, including the IATK:
      cd tests 
      pip3 install -r requirements.txt
      
    3. Run the test, providing the required environment variables from the earlier deployments. You can find correct values in the samconfig.toml file of the plugin_tester directory.
      samconfig.toml

      cd integration
      
      PLUGIN_TESTER_STACK_NAME=video-plugin-tester \
      AWS_REGION=us-west-2 \
      python3 -m unittest ./test_by_polling.py

You should see output as unittest runs the test.

Open the Step Functions console in your AWS account, then choose the PluginLifecycleWorkflow-<random value> workflow to validate that the plugin tester successfully ran. A recent execution shows a Succeeded status:

Recent execution status

Review other IATK features

The example application includes examples of other IATK features like generating mock events and retrieving AWS X-Ray traces.

Cleaning up

Use AWS SAM to clean up both the plugin and the plugin tester resources from your AWS account.

  1. Delete the plugin resources:
    cd ../.. # Move to the plugin directory
    sam delete # Delete the plugin

    Deleting resources

  2. Delete the plugin tester resources:
    cd ../../plugin_tester # Move to the plugin tester directory
    sam delete # Delete the plugin tester

    Deleting the tester

The temporary test harness resources that IATK created during the test are cleaned up when the tearDown method runs. If there are problems during teardown, some resources may not be deleted. IATK adds tags to all resources that it creates. You can use these tags to locate the resources then manually remove them. You can also add your own tags.

Conclusion

The AWS Integrated Application Test Kit is a software library that provides conveniences to help you write automated tests for your cloud applications. This blog post shows some of the features of the initial Python version of the IATK.

To learn more about automated testing for serverless applications, visit serverlessland.com/testing. You can also view code examples at serverlessland.com/testing/patterns or at the AWS serverless-test-samples repository on GitHub.

For more serverless learning resources, visit Serverless Land.

Introducing shared VPC support on Amazon MWAA

Post Syndicated from John Jackson original https://aws.amazon.com/blogs/big-data/introducing-shared-vpc-support-on-amazon-mwaa/

In this post, we demonstrate automating deployment of Amazon Managed Workflows for Apache Airflow (Amazon MWAA) using customer-managed endpoints in a VPC, providing compatibility with shared, or otherwise restricted, VPCs.

Data scientists and engineers have made Apache Airflow a leading open source tool to create data pipelines due to its active open source community, familiar Python development as Directed Acyclic Graph (DAG) workflows, and extensive library of pre-built integrations. Amazon MWAA is a managed service for Airflow that makes it easy to run Airflow on AWS without the operational burden of having to manage the underlying infrastructure. For each Airflow environment, Amazon MWAA creates a single-tenant service VPC, which hosts the metadatabase that stores states and the web server that provides the user interface. Amazon MWAA further manages Airflow scheduler and worker instances in a customer-owned and managed VPC, in order to schedule and run tasks that interact with customer resources. Those Airflow containers in the customer VPC access resources in the service VPC via a VPC endpoint.

Many organizations choose to centrally manage their VPC using AWS Organizations, allowing a VPC in an owner account to be shared with resources in a different participant account. However, because creating a new route outside of a VPC is considered a privileged operation, participant accounts can’t create endpoints in owner VPCs. Furthermore, many customers don’t want to extend the security privileges required to create VPC endpoints to all users provisioning Amazon MWAA environments. In addition to VPC endpoints, customers also wish to restrict data egress via Amazon Simple Queue Service (Amazon SQS) queues, and Amazon SQS access is a requirement in the Amazon MWAA architecture.

Shared VPC support for Amazon MWAA adds the ability for you to manage your own endpoints within your VPCs, adding compatibility to shared and otherwise restricted VPCs. Specifying customer-managed endpoints also provides the ability to meet strict security policies by explicitly restricting VPC resource access to just those needed by your Amazon MWAA environments. This post demonstrates how customer-managed endpoints work with Amazon MWAA and provides examples of how to automate the provisioning of those endpoints.

Solution overview

Shared VPC support for Amazon MWAA allows multiple AWS accounts to create their Airflow environments into shared, centrally managed VPCs. The account that owns the VPC (owner) shares the two private subnets required by Amazon MWAA with other accounts (participants) that belong to the same organization from AWS Organizations. After the subnets are shared, the participants can view, create, modify, and delete Amazon MWAA environments in the subnets shared with them.

When users specify the need for a shared, or otherwise policy-restricted, VPC during environment creation, Amazon MWAA will first create the service VPC resources, then enter a pending state for up to 72 hours, with an Amazon EventBridge notification of the change in state. This allows owners to create the required endpoints on behalf of participants based on endpoint service information from the Amazon MWAA console or API, or programmatically via an AWS Lambda function and EventBridge rule, as in the example in this post.

After those endpoints are created on the owner account, the endpoint service in the single-tenant Amazon MWAA VPC will detect the endpoint connection event and resume environment creation. Should there be an issue, you can cancel environment creation by deleting the environment during this pending state.

This feature also allows you to remove the create, modify, and delete VPCE privileges from the AWS Identity and Access Management (IAM) principal creating Amazon MWAA environments, even when not using a shared VPC, because that permission will instead be imposed on the IAM principal creating the endpoint (the Lambda function in our example). Furthermore, the Amazon MWAA environment will provide the SQS queue Amazon Resource Name (ARN) used by the Airflow Celery Executor to queue tasks (the Celery Executor Queue), allowing you to explicitly enter those resources into your network policy rather than having to provide a more open and generalized permission.

In this example, we create the VPC and Amazon MWAA environment in the same account. For shared VPCs across accounts, the EventBridge rule and Lambda function would exist in the owner account, and the Amazon MWAA environment would be created in the participant account. See Sending and receiving Amazon EventBridge events between AWS accounts for more information.

Prerequisites

You should have the following prerequisites:

  • An AWS account
  • An AWS user in that account, with permissions to create VPCs, VPC endpoints, and Amazon MWAA environments
  • An Amazon Simple Storage Service (Amazon S3) bucket in that account, with a folder called dags

Create the VPC

We begin by creating a restrictive VPC using an AWS CloudFormation template, in order to simulate creating the necessary VPC endpoint and modifying the SQS endpoint policy. If you want to use an existing VPC, you can proceed to the next section.

  1. On the AWS CloudFormation console, choose Create stack and choose With new resources (standard).
  2. Under Specify template, choose Upload a template file.
  3. Now we edit our CloudFormation template to restrict access to Amazon SQS. In cfn-vpc-private-bjs.yml, edit the SqsVpcEndoint section to appear as follows:
   SqsVpcEndoint:
     Type: AWS::EC2::VPCEndpoint
     Properties:
       ServiceName: !Sub "com.amazonaws.${AWS::Region}.sqs"
       VpcEndpointType: Interface
       VpcId: !Ref VPC
       PrivateDnsEnabled: true
       SubnetIds:
        - !Ref PrivateSubnet1
        - !Ref PrivateSubnet2
       SecurityGroupIds:
        - !Ref SecurityGroup
       PolicyDocument:
        Statement:
         - Effect: Allow
           Principal: '*'
           Action: '*'
           Resource: []

This additional policy document entry prevents Amazon SQS egress to any resource not explicitly listed.

Now we can create our CloudFormation stack.

  1. On the AWS CloudFormation console, choose Create stack.
  2. Select Upload a template file.
  3. Choose Choose file.
  4. Browse to the file you modified.
  5. Choose Next.
  6. For Stack name, enter MWAA-Environment-VPC.
  7. Choose Next until you reach the review page.
  8. Choose Submit.

Create the Lambda function

We have two options for self-managing our endpoints: manual and automated. In this example, we create a Lambda function that responds to the Amazon MWAA EventBridge notification. You could also use the EventBridge notification to send an Amazon Simple Notification Service (Amazon SNS) message, such as an email, to someone with permission to create the VPC endpoint manually.

First, we create a Lambda function to respond to the EventBridge event that Amazon MWAA will emit.

  1. On the Lambda console, choose Create function.
  2. For Name, enter mwaa-create-lambda.
  3. For Runtime, choose Python 3.11.
  4. Choose Create function.
  5. For Code, in the Code source section, for lambda_function, enter the following code:
    import boto3
    import json
    import logging
    
    logger = logging.getLogger()
    logger.setLevel(logging.INFO)
    
    def lambda_handler(event, context):
        if event['detail']['status']=="PENDING":
            detail=event['detail']
            name=detail['name']
            celeryExecutorQueue=detail['celeryExecutorQueue']
            subnetIds=detail['networkConfiguration']['subnetIds']
            securityGroupIds=detail['networkConfiguration']['securityGroupIds']
            databaseVpcEndpointService=detail['databaseVpcEndpointService']
    
            # MWAA does not need to store the VPC ID, but we can get it from the subnets
            client = boto3.client('ec2')
            response = client.describe_subnets(SubnetIds=subnetIds)
            logger.info(response['Subnets'][0]['VpcId'])  
            vpcId=response['Subnets'][0]['VpcId']
            logger.info("vpcId: " + vpcId)       
            
            webserverVpcEndpointService=None
            if detail['webserverAccessMode']=="PRIVATE_ONLY":
                webserverVpcEndpointService=event['detail']['webserverVpcEndpointService']
            
            response = client.describe_vpc_endpoints(
                VpcEndpointIds=[],
                Filters=[
                    {"Name": "vpc-id", "Values": [vpcId]},
                    {"Name": "service-name", "Values": ["*.sqs"]},
                    ],
                MaxResults=1000
            )
            sqsVpcEndpoint=None
            for r in response['VpcEndpoints']:
                if subnetIds[0] in r['SubnetIds'] or subnetIds[0] in r['SubnetIds']:
                    # We are filtering describe by service name, so this must be SQS
                    sqsVpcEndpoint=r
                    break
            
            if sqsVpcEndpoint:
                logger.info("Found SQS endpoint: " + sqsVpcEndpoint['VpcEndpointId'])
    
                logger.info(sqsVpcEndpoint)
                pd = json.loads(sqsVpcEndpoint['PolicyDocument'])
                for s in pd['Statement']:
                    if s['Effect']=='Allow':
                        resource = s['Resource']
                        logger.info(resource)
                        if '*' in resource:
                            logger.info("'*' already allowed")
                        elif celeryExecutorQueue in resource: 
                            logger.info("'"+celeryExecutorQueue+"' already allowed")                
                        else:
                            s['Resource'].append(celeryExecutorQueue)
                            logger.info("Updating SQS policy to " + str(pd))
            
                            client.modify_vpc_endpoint(
                                VpcEndpointId=sqsVpcEndpoint['VpcEndpointId'],
                                PolicyDocument=json.dumps(pd)
                                )
                        break
            
            # create MWAA database endpoint
            logger.info("creating endpoint to " + databaseVpcEndpointService)
            endpointName=name+"-database"
            response = client.create_vpc_endpoint(
                VpcEndpointType='Interface',
                VpcId=vpcId,
                ServiceName=databaseVpcEndpointService,
                SubnetIds=subnetIds,
                SecurityGroupIds=securityGroupIds,
                TagSpecifications=[
                    {
                        "ResourceType": "vpc-endpoint",
                        "Tags": [
                            {
                                "Key": "Name",
                                "Value": endpointName
                            },
                        ]
                    },
                ],           
            )
            logger.info("created VPCE: " + response['VpcEndpoint']['VpcEndpointId'])
                
            # create MWAA web server endpoint (if private)
            if webserverVpcEndpointService:
                endpointName=name+"-webserver"
                logger.info("creating endpoint to " + webserverVpcEndpointService)
                response = client.create_vpc_endpoint(
                    VpcEndpointType='Interface',
                    VpcId=vpcId,
                    ServiceName=webserverVpcEndpointService,
                    SubnetIds=subnetIds,
                    SecurityGroupIds=securityGroupIds,
                    TagSpecifications=[
                        {
                            "ResourceType": "vpc-endpoint",
                            "Tags": [
                                {
                                    "Key": "Name",
                                    "Value": endpointName
                                },
                            ]
                        },
                    ],                  
                )
                logger.info("created VPCE: " + response['VpcEndpoint']['VpcEndpointId'])
    
        return {
            'statusCode': 200,
            'body': json.dumps(event['detail']['status'])
        }

  6. Choose Deploy.
  7. On the Configuration tab of the Lambda function, in the General configuration section, choose Edit.
  8. For Timeout, increate to 5 minutes, 0 seconds.
  9. Choose Save.
  10. In the Permissions section, under Execution role, choose the role name to edit the permissions of this function.
  11. For Permission policies, choose the link under Policy name.
  12. Choose Edit and add a comma and the following statement:
    {
    		"Sid": "Statement1",
    		"Effect": "Allow",
    		"Action": 
    		[
    			"ec2:DescribeVpcEndpoints",
    			"ec2:CreateVpcEndpoint",
    			"ec2:ModifyVpcEndpoint",
                "ec2:DescribeSubnets",
    			"ec2:CreateTags"
    		],
    		"Resource": 
    		[
    			"*"
    		]
    }

The complete policy should look similar to the following:

{
	"Version": "2012-10-17",
	"Statement": [
		{
			"Effect": "Allow",
			"Action": "logs:CreateLogGroup",
			"Resource": "arn:aws:logs:us-east-1:112233445566:*"
		},
		{
			"Effect": "Allow",
			"Action": [
				"logs:CreateLogStream",
				"logs:PutLogEvents"
			],
			"Resource": [
				"arn:aws:logs:us-east-1:112233445566:log-group:/aws/lambda/mwaa-create-lambda:*"
			]
		},
		{
			"Sid": "Statement1",
			"Effect": "Allow",
			"Action": [
				"ec2:DescribeVpcEndpoints",
				"ec2:CreateVpcEndpoint",
				"ec2:ModifyVpcEndpoint",
               	"ec2:DescribeSubnets",
				"ec2:CreateTags"
			],
			"Resource": [
				"*"
			]
		}
	]
}
  1. Choose Next until you reach the review page.
  2. Choose Save changes.

Create an EventBridge rule

Next, we configure EventBridge to send the Amazon MWAA notifications to our Lambda function.

  1. On the EventBridge console, choose Create rule.
  2. For Name, enter mwaa-create.
  3. Select Rule with an event pattern.
  4. Choose Next.
  5. For Creation method, choose User pattern form.
  6. Choose Edit pattern.
  7. For Event pattern, enter the following:
    {
      "source": ["aws.airflow"],
      "detail-type": ["MWAA Environment Status Change"]
    }

  8. Choose Next.
  9. For Select a target, choose Lambda function.

You may also specify an SNS notification in order to receive a message when the environment state changes.

  1. For Function, choose mwaa-create-lambda.
  2. Choose Next until you reach the final section, then choose Create rule.

Create an Amazon MWAA environment

Finally, we create an Amazon MWAA environment with customer-managed endpoints.

  1. On the Amazon MWAA console, choose Create environment.
  2. For Name, enter a unique name for your environment.
  3. For Airflow version, choose the latest Airflow version.
  4. For S3 bucket, choose Browse S3 and choose your S3 bucket, or enter the Amazon S3 URI.
  5. For DAGs folder, choose Browse S3 and choose the dags/ folder in your S3 bucket, or enter the Amazon S3 URI.
  6. Choose Next.
  7. For Virtual Private Cloud, choose the VPC you created earlier.
  8. For Web server access, choose Public network (Internet accessible).
  9. For Security groups, deselect Create new security group.
  10. Choose the shared VPC security group created by the CloudFormation template.

Because the security groups of the AWS PrivateLink endpoints from the earlier step are self-referencing, you must choose the same security group for your Amazon MWAA environment.

  1. For Endpoint management, choose Customer managed endpoints.
  2. Keep the remaining settings as default and choose Next.
  3. Choose Create environment.

When your environment is available, you can access it via the Open Airflow UI link on the Amazon MWAA console.

Clean up

Cleaning up resources that are not actively being used reduces costs and is a best practice. If you don’t delete your resources, you can incur additional charges. To clean up your resources, complete the following steps:

  1. Delete your Amazon MWAA environment, EventBridge rule, and Lambda function.
  2. Delete the VPC endpoints created by the Lambda function.
  3. Delete any security groups created, if applicable.
  4. After the above resources have completed deletion, delete the CloudFormation stack to ensure that you have removed all of the remaining resources.

Summary

This post described how to automate environment creation with shared VPC support in Amazon MWAA. This gives you the ability to manage your own endpoints within your VPC, adding compatibility to shared, or otherwise restricted, VPCs. Specifying customer-managed endpoints also provides the ability to meet strict security policies by explicitly restricting VPC resource access to just those needed by their Amazon MWAA environments. To learn more about Amazon MWAA, refer to the Amazon MWAA User Guide. For more posts about Amazon MWAA, visit the Amazon MWAA resources page.


About the author

John Jackson has over 25 years of software experience as a developer, systems architect, and product manager in both startups and large corporations and is the AWS Principal Product Manager responsible for Amazon MWAA.

Converting Apache Kafka events from Avro to JSON using EventBridge Pipes

Post Syndicated from Pascal Vogel original https://aws.amazon.com/blogs/compute/converting-apache-kafka-events-from-avro-to-json-using-eventbridge-pipes/

This post is written by Pascal Vogel, Solutions Architect, and Philipp Klose, Global Solutions Architect.

Event streaming with Apache Kafka has become an important element of modern data-oriented and event-driven architectures (EDAs), unlocking use cases such as real-time analytics of user behavior, anomaly and fraud detection, and Internet of Things event processing. Stream producers and consumers in Kafka often use schema registries to ensure that all components follow agreed-upon event structures when sending (serializing) and processing (deserializing) events to avoid application bugs and crashes.

A common schema format in Kafka is Apache Avro, which supports rich data structures in a compact binary format. To integrate Kafka with other AWS and third-party services more easily, AWS offers Amazon EventBridge Pipes, a serverless point-to-point integration service. However, many downstream services expect JSON-encoded events, requiring custom, and repetitive schema validation and conversion logic from Avro to JSON in each downstream service.

This blog post shows how to reliably consume, validate, convert, and send Avro events from Kafka to AWS and third-party services using EventBridge Pipes, allowing you to reduce custom deserialization logic in downstream services. You can also use EventBridge event buses as targets in Pipes to filter and distribute events from Pipes to multiple targets, including cross-account and cross-Region delivery.

This blog describes two scenarios:

  1. Using Amazon Managed Streaming for Apache Kafka (Amazon MSK) and AWS Glue Schema Registry.
  2. Using Confluent Cloud and the Confluent Schema Registry.

See the associated GitHub repositories for Glue Schema Registry or Confluent Schema Registry for full source code and detailed deployment instructions.

Kafka event streaming and schema validation on AWS

To build event streaming applications with Kafka on AWS, you can use Amazon MSK, offerings such as Confluent Cloud, or self-hosted Kafka on Amazon Elastic Compute Cloud (Amazon EC2) instances.

To avoid common issues in event streaming and event-driven architectures, such as data inconsistencies and incompatibilities, it is a recommended practice to define and share event schemas between event producers and consumers. In Kafka, schema registries are used to manage, evolve, and enforce schemas for event producers and consumers. The AWS Glue Schema Registry provides a central location to discover, manage, and evolve schemas. In the case of Confluent Cloud, the Confluent Schema Registry serves the same role. Both the Glue Schema Registry and the Confluent Schema Registry support common schema formats such as Avro, Protobuf, and JSON.

To integrate Kafka with AWS services, third-party services, and your own applications, you can use EventBridge Pipes. EventBridge Pipes helps you create point-to-point integrations between event sources and targets with optional filtering, transformation, and enrichment. EventBridge Pipes reduces the amount of integration code that you have to write and maintain when building EDAs.

Many AWS and third-party services expect JSON-encoded payloads (events) as input, meaning they cannot directly consume Avro or Protobuf payloads. To replace repetitive Avro-to-JSON validation and conversion logic in each consumer, you can use the EventBridge Pipes enrichment step. This solution uses an AWS Lambda function in the enrichment step to deserialize and validate Kafka events with a schema registry, including error handling with dead-letter queues, and convert events to JSON before passing them to downstream services.

Solution overview

Architecture overview of the solution

The solution presented in this blog post consists of the following key elements:

  1. The source of the pipe is a Kafka cluster deployed using MSK or Confluent Cloud. EventBridge Pipes reads events from the Kafka stream in batches and sends them to the enrichment function (see here for an example event).
  2. The enrichment step (Lambda function) deserializes and validates the events against the configured schema registry (Glue or Confluent), converts events from Avro to JSON with integrated error handling, and returns them to the pipe.
  3. The target of this example solution is an EventBridge custom event bus that is invoked by EventBridge Pipes with JSON-encoded events returned by the enrichment Lambda function. EventBridge Pipes supports a variety of other targets, including Lambda, AWS Step Functions, Amazon API Gateway, API destinations, and more, enabling you to build EDAs without writing integration code.
  4. In this sample solution, the event bus sends all events to Amazon CloudWatch Logs via an EventBridge rule. You can extend the example to invoke additional EventBridge targets.

Optionally, you can add OpenAPI 3 or JSONSchema Draft 4 schemas for your events in the EventBridge schema registry by either manually generating it from the Avro schema or using EventBridge schema discovery. This allows you to download code bindings for the JSON-converted events for various programming languages, such as JavaScript, Python, and Java, to correctly use them in your EventBridge targets.

The remainder of this blog post describes this solution for the Glue and Confluent schema registries with code examples.

EventBridge Pipes with the Glue Schema Registry

This section describes how to implement event schema validation and conversion from Avro to JSON using EventBridge Pipes and the Glue Schema Registry. You can find the source code and detailed deployment instructions on GitHub.

Prerequisites

You need an Amazon MSK serverless cluster running and the Glue Schema registry configured. This example includes a Avro schema and a Glue Schema Registry. See the following AWS blog post for an introduction to schema validation with the Glue Schema Registry: Validate, evolve, and control schemas in Amazon MSK and Amazon Kinesis Data Streams with AWS Glue Schema Registry.

EventBridge Pipes configuration

Use the AWS Cloud Development Kit (AWS CDK) template provided in the GitHub repository to deploy:

  1. An EventBridge pipe that connects to your existing Amazon MSK Serverless Kafka topic as the source via AWS Identity and Access Management (IAM) authentication.
  2. EventBridge Pipes reads events from your Kafka topic using the Amazon MSK source type.
  3. An enrichment Lambda function in Java to perform event deserialization, validation, and conversion from Avro to JSON.
  4. An Amazon Simple Queue Service (Amazon SQS) dead letter queue to hold events for which deserialization failed.
  5. An EventBridge custom event bus as the pipe target. An EventBridge rule sends all incoming events into a CloudWatch Logs log group.

For MSK-based sources, EventBridge supports configuration parameters, such as batch window, batch size, and starting position, which you can set using the parameters of the CfnPipe class in the example CDK stack.

The example EventBridge pipe consumes events from Kafka in batches of 10 because it is targeting an EventBridge event bus, which has a max batch size of 10. See batching and concurrency in the EventBridge Pipes User Guide to choose an optimal configuration for other targets.

EventBridge Pipes with the Confluent Schema Registry

This section describes how to implement event schema validation and conversion from Avro to JSON using EventBridge Pipes and the Confluent Schema Registry. You can find the source code and detailed deployment instructions on GitHub.

Prerequisites

To set up this solution, you need a Kafka stream running on Confluent Cloud as well as the Confluent Schema Registry set up. See the corresponding Schema Registry tutorial for Confluent Cloud to set up a schema registry for your Confluent Kafka stream.

To connect to your Confluent Cloud Kafka cluster, you need an API key for Confluent Cloud and Confluent Schema Registry. AWS Secrets Manager is used to securely store your Confluent secrets.

EventBridge Pipes configuration

Use the AWS CDK template provided in the GitHub repository to deploy:

  1. An EventBridge pipe that connects to your existing Confluent Kafka topic as the source via an API secret stored in Secrets Manager.
  2. EventBridge Pipes reads events from your Confluent Kafka topic using the self-managed Apache Kafka stream source type, which includes all non-MSK Kafka clusters.
  3. An enrichment Lambda function in Python to perform event deserialization, validation, and conversion from Avro to JSON.
  4. An SQS dead letter queue to hold events for which deserialization failed.
  5. An EventBridge custom event bus as the pipe target. An EventBridge rule writes all incoming events into a CloudWatch Logs log group.

For self-managed Kafka sources, EventBridge supports configuration parameters, such as batch window, batch size, and starting position, which you can set using the parameters of the CfnPipe class in the example CDK stack.

The example EventBridge pipe consumes events from Kafka in batches of 10 because it is targeting an EventBridge event bus, which has a max batch size of 10. See batching and concurrency in the EventBridge Pipes User Guide to choose an optimal configuration for other targets.

Enrichment Lambda functions

Both of the solutions described previously include an enrichment Lambda function for schema validation and conversion from Avro to JSON.

The Java Lambda function integrates with the Glue Schema Registry using the AWS Glue Schema Registry Library. The Python Lambda function integrates with the Confluent Schema Registry using the confluent-kafka library and uses Powertools for AWS Lambda (Python) to implement Serverless best practices such as logging and tracing.

The enrichment Lambda functions perform the following tasks:

  1. In the events polled from the Kafka stream by the EventBridge pipe, the key and value of the event are base64 encoded. Therefore, for each event in the batch passed to the function, the key and the value are decoded.
  2. The event key is assumed to be serialized by the producer as a string type.
  3. The event value is deserialized using the Glue Schema registry Serde (Java) or the confluent-kafka AvroDeserializer (Python).
  4. The function then returns the successfully converted JSON events to the EventBridge pipe, which then invokes the target for each of them.
  5. Events for which Avro deserialization failed are sent to the SQS dead letter queue.

Conclusion

This blog post shows how to implement event consumption, Avro schema validation, and conversion to JSON using Amazon EventBridge Pipes, Glue Schema Registry, and Confluent Schema Registry.

The source code for the presented example is available in the AWS Samples GitHub repository for Glue Schema Registry and Confluent Schema Registry. For more patterns, visit the Serverless Patterns Collection.

For more serverless learning resources, visit Serverless Land.

Introducing logging support for Amazon EventBridge Pipes

Post Syndicated from David Boyne original https://aws.amazon.com/blogs/compute/introducing-logging-support-for-amazon-eventbridge-pipes/

Today, AWS is announcing support for logging with EventBridge Pipes. Amazon EventBridge Pipes is a point to point integration solution that connects event producers and consumers with optional filter, transform, and enrichment steps. EventBridge Pipes reduces the amount of integration code builders must write and maintain when building event-driven applications. Popular integrations include connecting Amazon Kinesis streams together with filtering, Amazon DynamoDB direct integrations with Amazon EventBridge, and Amazon SQS integrations with AWS Step Functions.

Amazon EventBridge Pipes

EventBridge Pipes logging introduces insights into different stages of the pipe execution. It expands on the Amazon CloudWatch metrics support, and provides you with additional methods for troubleshooting and debugging.

You can now gain insights into various successful and failure scenarios within the pipe execution steps. When event transformation or enrichment succeeds or fails, you can use logs to delve deeper and initiate troubleshooting for any issues with their configured pipes.

EventBridge Pipes execution steps

Understanding pipes execution steps can assist you in selecting the appropriate log level, which determines how much information is logged.

A pipe execution is an event or batch of events received by a pipe that travel from the source to the target. As events travel through a pipe, they can be filtered, transformed, or enriched using AWS Step Functions, AWS Lambda, Amazon API Gateway, and EventBridge API Destinations.

A pipe execution consists of two main stages: the enrichment and target. Both of these stages encompass transformation and invocation steps.

You can use input transformers, enabling modification to the payload of the event before the events undergo enrichment or get dispatched to the downstream target. This gives you fine-grained control over the manipulation of event data during the execution of their configured pipes.

When the pipe execution starts, the execution enters the enrichment stage. If you don’t configure an enrichment stage, the execution proceeds to the target stage.

At the pipe execution, transformation, enrichment, and target phases EventBridge can log information to help debug or troubleshoot. Pipes logs can include payloads, errors, transformations, AWS requests, and AWS responses.

To learn more about pipe executions, read this documentation.

Configuring log levels with EventBridge Pipes

When logging is enabled for your pipe, EventBridge produces a log entry for every execution step and sends these logs to the specified log destinations.

EventBridge Pipes supports three log destinations: Amazon CloudWatch Logs, Amazon Kinesis Data Firehose stream, and Amazon S3. The records sent can be customized by configuring the log level of the pipe (OFF, ERROR, INFO, TRACE).

  • OFF – EventBridge does not send any records.
  • ERROR – EventBridge sends records related to errors generated during the pipe execution. Examples include Execution Failed, Execution Timeout and Enrichment Failures.
  • INFO – EventBridge sends records related to errors and selected information performed during pipe execution. Examples include Execution Started, Execution Succeeded and Enrichment Stage Succeeded.
  • TRACE – EventBridge sends any record generated during any step in the pipe execution.

The ERROR log level proves beneficial in gaining insights into the reasons behind a failed pipe execution. Pipe executions may encounter failure due to various reasons, such as timeouts, enrichment failure, transformation failure, or target invocation failure. Enabling ERROR logging allows you to learn more about the specific cause of the pipe error, facilitating the resolution of the issue.

The INFO log level supplements ERROR information with additional details. It not only informs about errors but also provides insights into the commencement of the pipe execution, entry into the enrichment phase, progression into the transformation phase, and the initiation and successful completion of the target stage.

For a more in-depth analysis, you can use the TRACE log level to obtain comprehensive insights into a pipe execution. This encompasses all supported pipe logs, offering a detailed view beyond the INFO and ERROR logs. The TRACE log level reveals crucial information, such as skipped pipe execution stages and the initiation of transformation and enrichment processes.

For more details on the log levels and what logs are sent, you can read the documentation.

Including execution data with EventBridge Pipes logging

To help with further debugging, you can choose to include execution data within the pipe logs. This data comprises event payloads, AWS requests, and responses sent to and received from configured enrichment and target components.

You can also use the execution data to gain further insights into the payloads, requests, and responses sent to AWS services during the execution of the pipe.

Incorporating execution data can enhance understanding of the pipe execution, providing deeper insights and aiding in the debugging of any encountered issues.

Execution data within a log contains three parts:

  • payload: The content of the event itself. The payload of the event may contain sensitive information and EventBridge makes no attempt to redact the contents. Including execution data is optional and can be turned off.
  • awsRequest: The request sent to the enrichment or target in serialized JSON format. For API destinations this includes the HTTP request sent to that endpoint.
  • awsResponse: The response returned by the enrichment or target in JSON format. For API Destinations, this is the response returned from the configured endpoint.

The payload of the event is populated when the event itself can be updated. These stages include the initial pipe execution, enrichment phase, and target phase. The awsRequest and awsResponse are both generated at the final steps of enrichment and targeting.

For more information on log levels and execution data, visit this documentation.

Getting started with EventBridge Pipes logs

This example creates a pipe with logging enabled and includes execution data. The pipe connects two Amazon SQS queues using an input transformer on the target with no enrichment step. The input transformer customizes the payload of the event before reaching the target.

  1. Creating the source and target queues
# Create a queue for the source
aws sqs create-queue --queue-name pipe-source

# Create a queue for the target
aws sqs create-queue --queue-name pipe-target

2. Navigate to EventBridge Pipes and choose Create pipe.

3. Select SQS as the Source and select pipe-source as the SQS Queue.

4. Skip the filter and enrichment phase and add a new Target. Select SQS as the Target service and pipe-target as the Queue.

5. Open Target Input Transformer section and enter the transformer code into the Transformer field.

{

  "body": "Favorite food is <$.body>"

}

6. Choose Pipe settings to configure the log group for the new pipe.

7. Verify that CloudWatch Logs is set as the log destination, and select Trace as the log level. Check the “Include execution data” check box. This logs all traces to the new CloudWatch log group and includes the SQS messages that are sent on the pipe.

8. Choose Create Pipe.

9. Send an SQS message to the source queue.

# Get the Queue URL

aws sqs get-queue-url --queue-name pipe-source

# Send a message to the queue using the URL

aws sqs send-message --queue-url {QUEUE_URL} --message-body "pizza"

10. All trace logs are shown in the monitoring tab, use CloudWatch Logs section for more information.

Conclusion

EventBridge Pipes enables point-to-point integration between event producers and consumers. With logging support for EventBridge Pipes, you can now gain insights into various stages of the pipe execution. Pipe log destinations can be configured to CloudWatch Logs, Kinesis Data Firehose, and Amazon S3.

EventBridge Pipes supports three log levels. The ERROR log level configures EventBridge to send records related to errors to the log destination. The INFO log level configures EventBridge to send records related to errors and selected information during the pipe execution. The TRACE log level sends any record generated to the log destination, useful for debugging and gaining further insights.

You can include execution data in the logs, which includes the event itself, and AWS requests and responses made to AWS services configured in the pipe. This can help you gain further insights into the pipe execution. Read the documentation to learn more about EventBridge Pipes Logs.

For more serverless learning resources, visit Serverless Land.

The serverless attendee’s guide to AWS re:Invent 2023

Post Syndicated from Marcia Villalba original https://aws.amazon.com/blogs/compute/the-serverless-attendees-guide-to-aws-reinvent-2023/

AWS re:Invent 2023 is fast approaching, bringing together tens of thousands of Builders in Las Vegas in November. However, even if you can’t attend in person, you can catch up with sessions on-demand.

Breakout sessions are lecture-style 60-minute informative sessions presented by AWS experts, customers, or partners. These sessions cover beginner (100 level) topics to advanced and expert (300–400 level) topics. The sessions are recorded and uploaded a few days after to the AWS Events YouTube channel.

This post shares the “must watch” breakout sessions related to serverless architectures and services.

Sessions related to serverless architecture

SVS401

SVS401 | Best practices for serverless developers
Provides architectural best practices, optimizations, and useful shortcuts that experts use to build secure, high-scale, and high-performance serverless applications.

Chris Munns, Startup Tech Leader, AWS
Julian Wood, Principal Developer Advocate, AWS

SVS305 | Refactoring to serverless
Shows how you can refactor your application to serverless with real-life examples.

Gregor Hohpe, Senior Principal Evangelist, AWS
Sindhu Pillai, Senior Solutions Architect, AWS

SVS308 | Building low-latency, event-driven applications
Explores building serverless web applications for low-latency and event-driven support. Marvel Snap share how they achieve low-latency in their games using serverless technology.

Marcia Villalba, Principal Developer Advocate, AWS
Brenna Moore, Second Dinner

SVS309 | Improve productivity by shifting more responsibility to developers
Learn about approaches to accelerate serverless development with faster feedback cycles, exploring best practices and tools. Watch a live demo featuring an improved developer experience for building serverless applications while complying with enterprise governance requirements.

Heeki Park, Principal Solutions Architect, AWS
Sam Dengler, Capital One

GBL203-ES | Building serverless-first applications with MAPFRE
This session is delivered in Spanish. Learn what modern, serverless-first applications are and how to implement them with services such as AWS Lambda or AWS Fargate. Find out how MAPFRE have adopted and implemented a serverless strategy.

Jesus Bernal, Senior Solutions Architect, AWS
Iñigo Lacave, MAPFRE
Mat Jovanovic, MAPFRE

Sessions related to AWS Lambda

BOA311

BOA311 | Unlocking serverless web applications with AWS Lambda Web Adapter
Learn about the AWS Lambda Web Adapter and how it integrates with familiar frameworks and tools. Find out how to migrate existing web applications to serverless or create new applications using AWS Lambda.

Betty Zheng, Senior Developer Advocate, AWS
Harold Sun, Senior Solutions Architect, AWS

OPN305 | The pragmatic serverless Python developer
Covers an opinionated approach to setting up a serverless Python project, including testing, profiling, deployments, and operations. Learn about many open source tools, including Powertools for AWS Lambda—a toolkit that can help you implement serverless best practices and increase developer velocity.

Heitor Lessa, Principal Solutions Architect, AWS
Ran Isenberg, CyberArk

XNT301 | Build production-ready serverless .NET apps with AWS Lambda
Explores development and architectural best practices when building serverless applications with .NET and AWS Lambda, including when to run ASP.NET on Lambda, code structure, and using native AOT to massively increase performance.

James Eastham, Senior Cloud Architect, AWS
Craig Bossie, Solutions Architect, AWS

COM306 | “Rustifying” serverless: Boost AWS Lambda performance with Rust
Discover how to deploy Rust functions using AWS SAM and cargo-lambda, facilitating a smooth development process from your local machine. Explore how to integrate Rust into Python Lambda functions effortlessly using tools like PyO3 and maturin, along with the AWS SDK for Rust. Uncover how Rust can optimize Lambda functions, including the development of Lambda extensions, all without requiring a complete rewrite of your existing code base.

Efi Merdler-Kravitz, Cloudex

COM305 | Demystifying and mitigating AWS Lambda cold starts
Examines the Lambda initialization process at a low level, using benchmarks comparing common architectural patterns, and then benchmarking various RAM configurations and payload sizes. Next, measure and discuss common mistakes that can increase initialization latency, explore and understand proactive initialization, and learn several strategies you can use to thaw your AWS Lambda cold starts.

AJ Stuyvenberg, Datadog

Sessions related to event-driven architecture

API302

API302 | Building next gen applications with event driven architecture
Learn about common integration patterns and discover how you can use AWS messaging services to connect microservices and coordinate data flow using minimal custom code. Learn and plan for idempotency, handling duplicating events and building resiliency into your architectures.

Eric Johnson, Principal Developer Advocate, AWS

API303 | Navigating the journey of serverless event-driven architecture
Learn about the journey businesses undertake when adopting EDAs, from initial design and implementation to ongoing operation and maintenance. The session highlights the many benefits EDAs can offer organizations and focuses on areas of EDA that are challenging and often overlooked. Through a combination of patterns, best practices, and practical tips, this session provides a comprehensive overview of the opportunities and challenges of implementing EDAs and helps you understand how you can use them to drive business success.

David Boyne, Senior Developer Advocate, AWS

API309 | Advanced integration patterns and trade-offs for loosely coupled apps
In this session, learn about common design trade-offs for distributed systems, how to navigate them with design patterns, and how to embed those patterns in your cloud automation.

Dirk Fröhner, Principal Solutions Architect, AWS
Gregor Hohpe, Senior Principal Evangelist, AWS

SVS205 | Getting started building serverless event-driven applications
Learn about the process of prototyping a solution from concept to a fully featured application that uses Amazon API Gateway, AWS Lambda, Amazon EventBridge, AWS Step Functions, Amazon DynamoDB, AWS Application Composer, and more. Learn why serverless is a great tool set for experimenting with new ideas and how the extensibility and modularity of serverless applications allow you to start small and quickly make your idea a reality.

Emily Shea, Head of Application Integration Go-to-Market, AWS
Naren Gakka, Solutions Architect, AWS

API206 | Bringing workloads together with event-driven architecture
Attend this session to learn the steps to bring your existing container workloads closer together using event-driven architecture with minimal code changes and a high degree of reusability. Using a real-life business example, this session walks through a demo to highlight the power of this approach.

Dhiraj Mahapatro, Principal Solutions Architect, AWS
Nicholas Stumpos, JPMorgan Chase & Co

COM301 | Advanced event-driven patterns with Amazon EventBridge
Gain an understanding of the characteristics of EventBridge and how it plays a pivotal role in serverless architectures. Learn the primary elements of event-driven architecture and some of the best practices. With real-world use cases, explore how the features of EventBridge support implementing advanced architectural patterns in serverless.

Sheen Brisals, The LEGO Group

Sessions related to serverless APIs

SVS301

SVS301 | Building APIs: Choosing the best API solution and strategy for your workloads
Learn about access patterns and how to evaluate the best API technology for your applications. The session considers the features and benefits of Amazon API Gateway, AWS AppSync, Amazon VPC Lattice, and other options.

Josh Kahn, Tech Leader Serverless, AWS
Arthi Jaganathan, Principal Solutions Architect, AWS

SVS323 | I didn’t know Amazon API Gateway did that
This session provides an introduction to Amazon API Gateway and the problems it solves. Learn about the moving parts of API Gateway and how it works, including common and not-so-common use cases. Discover why you should use API Gateway and what it can do.

Eric Johnson, Principal Developer Advocate, AWS

FWM201 | What’s new with AWS AppSync for enterprise API developers
Join this session to learn about all the exciting new AWS AppSync features released this year that make it even more seamless for API developers to realize the benefits of GraphQL for application development.

Michael Liendo, Senior Developer Advocate, AWS
Brice Pellé, Principal Product Manager, AWS

FWM204 | Implement real-time event patterns with WebSockets and AWS AppSync
Learn how the PGA Tour uses AWS AppSync to deliver real-time event updates to their app users; review new features, like enhanced filtering options and native integration with Amazon EventBridge; and provide a sneak peek at what’s coming next.

Ryan Yanchuleff, Senior Solutions Architect, AWS
Bill Fine, Senior Product Manager, AWS
David Provan, PGA Tour

Sessions related to AWS Step Functions

API401

API401 | Advanced workflow patterns and business processes with AWS Step Functions
Learn about architectural best practices and repeatable patterns for building workflows and cost optimizations, and discover handy cheat codes that you can use to build secure, high-scale, high-performance serverless applications

Ben Smith, Principal Developer Advocate, AWS

BOA304 | Using AI and serverless to automate video production
Learn how to use Step Functions to build workflows using AI services and how to use Amazon EventBridge real-time events.

Marcia Villalba, Principal Developer Advocate, AWS

SVS204 | Building Serverlesspresso: Creating event-driven architectures
This session explores the design decisions that were made when building Serverlesspresso, how new features influenced the development process, and lessons learned when creating a production-ready application using this approach. Explore useful patterns and options for extensibility that helped in the design of a robust, scalable solution that costs about one dollar per day to operate. This session includes examples you can apply to your serverless applications and complex architectural challenges for larger applications.

James Beswick, Senior Manager Developer Advocacy, AWS

API310 | Scale interactive data analysis with Step Functions Distributed Map
Learn how to build a data processing or other automation once and readily scale it to thousands of parallel processes with serverless technologies. Explore how this approach simplifies development and error handling while improving speed and lowering cost. Hear from an AWS customer that refactored an existing machine learning application to use Distributed Map and the lessons they learned along the way.

Adam Wagner, Principal Solutions Architect, AWS
Roberto Iturralde, Vertex Pharmaceuticals

Sessions related to handling data using serverless services and serverless databases

SVS307

SVS307 | Scaling your serverless data processing with Amazon Kinesis and Kafka
Explore how to build scalable data processing applications using AWS Lambda. Learn practical insights into integrating Lambda with Amazon Kinesis and Apache Kafka using their event-driven models for real-time data streaming and processing.

Julian Wood, Principal Developer Advocate, AWS

DAT410 | Advanced data modeling with Amazon DynamoDB
This session shows you advanced techniques to get the most out of DynamoDB. Learn how to “think in DynamoDB” by learning the DynamoDB foundations and principles for data modeling. Learn practical strategies and DynamoDB features to handle difficult use cases in your application.

Alex De Brie – Independent consultant

COM308 | Serverless data streaming: Amazon Kinesis Data Streams and AWS Lambda
Explore the intricacies of creating scalable, production-ready data streaming architectures using Kinesis Data Streams and Lambda. Delve into tips and best practices essential to navigating the challenges and pitfalls inherent to distributed systems that arise along the way, and observe how AWS services work and interact.

Anahit Pogosova, Solita

Additional resources

If you are attending the event, there are many chalk talks, workshops, and other sessions to visit. See ServerlessLand for a full list of all the serverless sessions and also the Serverless Hero, Danielle Heberling’s Serverless re:Invent attendee guide for her top picks.

Visit us in the AWS Village in the Expo Hall where you can find the Serverless and Containers booth and enjoy a free cup of coffee at Serverlesspresso.

For more serverless learning resources, visit Serverless Land.

Enhanced Amazon CloudWatch metrics for Amazon EventBridge

Post Syndicated from James Beswick original https://aws.amazon.com/blogs/compute/enhanced-amazon-cloudwatch-metrics-for-amazon-eventbridge/

This post is written by Vaibhav Shah, Sr. Solutions Architect.

Customers use event-driven architectures to orchestrate and automate their event flows from producers to consumers. Amazon EventBridge acts as a serverless event router for various targets based on event rules. It decouples the producers and consumers, allowing customers to build asynchronous architectures.

EventBridge provides metrics to enable you to monitor your events. Some of the metrics include: monitoring the number of partner events ingested, the number of invocations that failed permanently, and the number of times a target is invoked by a rule in response to an event, or the number of events that matched with any rule.

In response to customer requests, EventBridge has added additional metrics that allow customers to monitor their events and provide additional visibility. This blog post explains these new capabilities.

What’s new?

EventBridge has new metrics mainly around the API, events, and invocations metrics. These metrics give you insights into the total number of events published, successful events published, failed events, number of events matched with any or specific rule, events rejected because of throttling, latency, and invocations based metrics.

This allows you to track the entire span of event flow within EventBridge and quickly identify and resolve issues as they arise.

EventBridge now has the following metrics:

Metric Description Dimensions and Units
PutEventsLatency The time taken per PutEvents API operation

None

Units: Milliseconds

PutEventsRequestSize The size of the PutEvents API request in bytes

None

Units: Bytes

MatchedEvents Number of events that matched with any rule, or a specific rule None
RuleName,
EventBusName,
EventSourceName

Units: Count

ThrottledRules The number of times rule execution was throttled.

None, RuleName

Unit: Count

PutEventsApproximateCallCount Approximate total number of calls in PutEvents API calls.

None

Units: Count

PutEventsApproximateThrottledCount Approximate number of throttled requests in PutEvents API calls.

None

Units: Count

PutEventsApproximateFailedCount Approximate number of failed PutEvents API calls.

None

Units: Count

PutEventsApproximateSuccessCount Approximate number of successful PutEvents API calls.

None

Units: Count

PutEventsEntriesCount The number of event entries contained in a PutEvents request.

None

Units: Count

PutEventsFailedEntriesCount The number of event entries contained in a PutEvents request that failed to be ingested.

None

Units: Count

PutPartnerEventsApproximateCallCount Approximate total number of calls in PutPartnerEvents API calls. (visible in Partner’s account)

None

Units: Count

PutPartnerEventsApproximateThrottledCount Approximate number of throttled requests in PutPartnerEvents API calls. (visible in Partner’s account)

None

Units: Count

PutPartnerEventsApproximateFailedCount Approximate number of failed PutPartnerEvents API calls. (visible in Partner’s account)

None

Units: Count

PutPartnerEventsApproximateSuccessCount Approximate number of successful PutPartnerEvents API calls. (visible in Partner’s account)

None

Units: Count

PutPartnerEventsEntriesCount The number of event entries contained in a PutPartnerEvents request.

None

Units: Count

PutPartnerEventsFailedEntriesCount The number of event entries contained in a PutPartnerEvents request that failed to be ingested.

None

Units: Count

PutPartnerEventsLatency The time taken per PutPartnerEvents API operation (visible in Partner’s account)

None

Units: Milliseconds

InvocationsCreated Number of times a target is invoked by a rule in response to an event. One invocation attempt represents a single count for this metric.

None

Units: Count

InvocationAttempts Number of times EventBridge attempted invoking a target.

None

Units: Count

SuccessfulInvocationAttempts Number of times target was successfully invoked.

None

Units: Count

RetryInvocationAttempts The number of times a target invocation has been retried.

None

Units: Count

IngestiontoInvocationStartLatency The time to process events, measured from when an event is ingested by EventBridge to the first invocation of a target. None,
RuleName,
EventBusName

Units: Milliseconds

IngestiontoInvocationCompleteLatency The time taken from event Ingestion to completion of the first successful invocation attempt None,
RuleName,
EventBusName

Units: Milliseconds

Use-cases for these metrics

These new metrics help you improve observability and monitoring of your event-driven applications. You can proactively monitor metrics that help you understand the event flow, invocations, latency, and service utilization. You can also set up alerts on specific metrics and take necessary actions, which help improve your application performance, proactively manage quotas, and improve resiliency.

Monitor service usage based on Service Quotas

The PutEventsApproximateCallCount metric in the events family helps you identify the approximate number of events published on the event bus using the PutEvents API action. The PutEventsApproximateSuccessfulCount metric shows the approximate number of successful events published on the event bus.

Similarly, you can monitor throttled and failed events count with PutEventsApproximateThrottledCount and PutEventsApproximateFailedCount respectively. These metrics allow you to monitor if you are reaching your quota for PutEvents. You can use a CloudWatch alarm and set a threshold close to your account quotas. If that is triggered, send notifications using Amazon SNS to your operations team. They can work to increase the Service Quotas.

You can also set an alarm on the PutEvents throttle limit in transactions per second service quota.

  1. Navigate to the Service Quotas console. On the left pane, choose AWS services, search for EventBridge, and select Amazon EventBridge (CloudWatch Events).
  2. In the Monitoring section, you can monitor the percentage utilization of the PutEvents throttle limit in transactions per second.
    Monitor the percentage utilization of PutEvents
  3. Go to the Alarms tab, and choose Create alarm. In Alarm threshold, choose 80% of the applied quota value from the dropdown. Set the Alarm name to PutEventsThrottleAlarm, and choose Create.
    Create alarm
  4. To be notified if this threshold is breached, navigate to Amazon CloudWatch Alarms console and choose PutEventsThrottleAlarm.
  5. Select the Actions dropdown from the top right corner, and choose Edit.
  6. On the Specify metric and conditions page, under Conditions, make sure that the Threshold type is selected as Static and the % Utilization selected as Greater/Equal than 80. Choose Next.
    Specify metrics and conditions
  7. Configure actions to send notifications to an Amazon SNS topic and choose Next.
    7.	Configure actions to send notifications.
  8. The Alarm name should be already set to PutEventsThrottleAlarm. Choose Next, then choose Update alarm.
    Add name and description

This helps you get notified when the percentage utilization of PutEvents throttle limit in transactions per second reaches close to the threshold set. You can then request Service Quota increases if required.

Similarly, you can also create CloudWatch alarms on percentage utilization of Invocations throttle limit in transactions per second against the service quota.

Invocations throttle limit in transactions per second

Enhanced observability

The PutEventsLatency metric shows the time taken per PutEvents API operation. There are two additional metrics, IngestiontoInvocationStartLatency metric and IngestiontoInvocationCompleteLatency metric. The first metric shows the time to process events measured from when the events are first ingested by EventBridge to the first invocation of a target. The second shows the time taken from event ingestion to completion of the first successful invocation attempt.

This helps identify latency-related issues from the time of ingestion until the time it reaches the target based on the RuleName. If there is high latency, these two metrics give you visibility into this issue, allowing you to take appropriate action.

Enhanced observability

You can set a threshold around these metrics, and if the threshold is triggered, the defined actions can help recover from potential failures. One of the defined actions here can be to send events generated later to EventBridge in the secondary Region using EventBridge global endpoints.

Sometimes, events are not delivered to the target specified in the rule. This can be because the target resource is unavailable, you don’t have permission to invoke the target, or there are network issues. In such scenarios, EventBridge retries to send these events to the target for 24 hours or up to 185 times, both of which are configurable.

The new RetryInvocationAttempts metric shows the number of times the EventBridge has retried to invoke the target. The retries are done when requests are throttled, target service having availability issues, network issues, and service failures. This provides additional observability to the customers and can be used to trigger a CloudWatch alarm to notify teams if the desired threshold is crossed. If the retries are exhausted, store the failed events in the Amazon SQS dead-letter queues to process failed events for the later time.

In addition to these, EventBridge supports additional dimensions like DetailType, Source, and RuleName to MatchedEvents metrics. This helps you monitor the number of matched events coming from different sources.

  1. Navigate to the Amazon CloudWatch. On the left pane, choose Metrics, and All metrics.
  2. In the Browse section, select Events, and Source.
  3. From the Graphed metrics tab, you can monitor matched events coming from different sources.Graphed metrics tab

Failover events to secondary Region

The PutEventsFailedEntriesCount metric shows the number of events that failed ingestion. Monitor this metric and set a CloudWatch alarm. If it crosses a defined threshold, you can then take appropriate action.

Also, set an alarm on the PutEventsApproximateThrottledCount metric, which shows the number of events that are rejected because of throttling constraints. For these event ingestion failures, the client must resend the failed events to the event bus again, allowing you to process every single event critical for your application.

Alternatively, send events to EventBridge service in the secondary Region using Amazon EventBridge global endpoints to improve resiliency of your event-driven applications.

Conclusion

This blog shows how to use these new metrics to improve the visibility of event flows in your event-driven applications. It helps you monitor the events more effectively, from invocation until the delivery to the target. This improves observability by proactively alerting on key metrics.

For more serverless learning resources, visit Serverless Land.

Sending and receiving webhooks on AWS: Innovate with event notifications

Post Syndicated from James Beswick original https://aws.amazon.com/blogs/compute/sending-and-receiving-webhooks-on-aws-innovate-with-event-notifications/

This post is written by Daniel Wirjo, Solutions Architect, and Justin Plock, Principal Solutions Architect.

Commonly known as reverse APIs or push APIs, webhooks provide a way for applications to integrate to each other and communicate in near real-time. It enables integration for business and system events.

Whether you’re building a software as a service (SaaS) application integrating with your customer workflows, or transaction notifications from a vendor, webhooks play a critical role in unlocking innovation, enhancing user experience, and streamlining operations.

This post explains how to build with webhooks on AWS and covers two scenarios:

  • Webhooks Provider: A SaaS application that sends webhooks to an external API.
  • Webhooks Consumer: An API that receives webhooks with capacity to handle large payloads.

It includes high-level reference architectures with considerations, best practices and code sample to guide your implementation.

Sending webhooks

To send webhooks, you generate events, and deliver them to third-party APIs. These events facilitate updates, workflows, and actions in the third-party system. For example, a payments platform (provider) can send notifications for payment statuses, allowing ecommerce stores (consumers) to ship goods upon confirmation.

AWS reference architecture for a webhook provider

The architecture consists of two services:

  • Webhook delivery: An application that delivers webhooks to an external endpoint specified by the consumer.
  • Subscription management: A management API enabling the consumer to manage their configuration, including specifying endpoints for delivery, and which events for subscription.

AWS reference architecture for a webhook provider

Considerations and best practices for sending webhooks

When building an application to send webhooks, consider the following factors:

Event generation: Consider how you generate events. This example uses Amazon DynamoDB as the data source. Events are generated by change data capture for DynamoDB Streams and sent to Amazon EventBridge Pipes. You then simplify the DynamoDB response format by using an input transformer.

With EventBridge, you send events in near real time. If events are not time-sensitive, you can send multiple events in a batch. This can be done by polling for new events at a specified frequency using EventBridge Scheduler. To generate events from other data sources, consider similar approaches with Amazon Simple Storage Service (S3) Event Notifications or Amazon Kinesis.

Filtering: EventBridge Pipes support filtering by matching event patterns, before the event is routed to the target destination. For example, you can filter for events in relation to status update operations in the payments DynamoDB table to the relevant subscriber API endpoint.

Delivery: EventBridge API Destinations deliver events outside of AWS using REST API calls. To protect the external endpoint from surges in traffic, you set an invocation rate limit. In addition, retries with exponential backoff are handled automatically depending on the error. An Amazon Simple Queue Service (SQS) dead-letter queue retains messages that cannot be delivered. These can provide scalable and resilient delivery.

Payload Structure: Consider how consumers process event payloads. This example uses an input transformer to create a structured payload, aligned to the CloudEvents specification. CloudEvents provides an industry standard format and common payload structure, with developer tools and SDKs for consumers.

Payload Size: For fast and reliable delivery, keep payload size to a minimum. Consider delivering only necessary details, such as identifiers and status. For additional information, you can provide consumers with a separate API. Consumers can then separately call this API to retrieve the additional information.

Security and Authorization: To deliver events securely, you establish a connection using an authorization method such as OAuth. Under the hood, the connection stores the credentials in AWS Secrets Manager, which securely encrypts the credentials.

Subscription Management: Consider how consumers can manage their subscription, such as specifying HTTPS endpoints and event types to subscribe. DynamoDB stores this configuration. Amazon API Gateway, Amazon Cognito, and AWS Lambda provide a management API for operations.

Costs: In practice, sending webhooks incurs cost, which may become significant as you grow and generate more events. Consider implementing usage policies, quotas, and allowing consumers to subscribe only to the event types that they need.

Monetization: Consider billing consumers based on their usage volume or tier. For example, you can offer a free tier to provide a low-friction access to webhooks, but only up to a certain volume. For additional volume, you charge a usage fee that is aligned to the business value that your webhooks provide. At high volumes, you offer a premium tier where you provide dedicated infrastructure for certain consumers.

Monitoring and troubleshooting: Beyond the architecture, consider processes for day-to-day operations. As endpoints are managed by external parties, consider enabling self-service. For example, allow consumers to view statuses, replay events, and search for past webhook logs to diagnose issues.

Advanced Scenarios: This example is designed for popular use cases. For advanced scenarios, consider alternative application integration services noting their Service Quotas. For example, Amazon Simple Notification Service (SNS) for fan-out to a larger number of consumers, Lambda for flexibility to customize payloads and authentication, and AWS Step Functions for orchestrating a circuit breaker pattern to deactivate unreliable subscribers.

Receiving webhooks

To receive webhooks, you require an API to provide to the webhook provider. For example, an ecommerce store (consumer) may rely on notifications provided by their payment platform (provider) to ensure that goods are shipped in a timely manner. Webhooks present a unique scenario as the consumer must be scalable, resilient, and ensure that all requests are received.

AWS reference architecture for a webhook consumer

In this scenario, consider an advanced use case that can handle large payloads by using the claim-check pattern.

AWS reference architecture for a webhook consumer

At a high-level, the architecture consists of:

  • API: An API endpoint to receive webhooks. An event-driven system then authorizes and processes the received webhooks.
  • Payload Store: S3 provides scalable storage for large payloads.
  • Webhook Processing: EventBridge Pipes provide an extensible architecture for processing. It can batch, filter, enrich, and send events to a range of processing services as targets.

Considerations and best practices for receiving webhooks

When building an application to receive webhooks, consider the following factors:

Scalability: Providers typically send events as they occur. API Gateway provides a scalable managed endpoint to receive events. If unavailable or throttled, providers may retry the request, however, this is not guaranteed. Therefore, it is important to configure appropriate rate and burst limits. Throttling requests at the entry point mitigates impact on downstream services, where each service has its own quotas and limits. In many cases, providers are also aware of impact on downstream systems. As such, they send events at a threshold rate limit, typically up to 500 transactions per second (TPS).

Considerations and best practices for receiving webhooks

In addition, API Gateway allows you to validate requests, monitor for any errors, and protect against distributed denial of service (DDoS). This includes Layer 7 and Layer 3 attacks, which are common threats to webhook consumers given public exposure.

Authorization and Verification: Providers can support different authorization methods. Consider a common scenario with Hash-based Message Authentication Code (HMAC), where a shared secret is established and stored in Secrets Manager. A Lambda function then verifies integrity of the message, processing a signature in the request header. Typically, the signature contains a timestamped nonce with an expiry to mitigate replay attacks, where events are sent multiple times by an attacker. Alternatively, if the provider supports OAuth, consider securing the API with Amazon Cognito.

Payload Size: Providers may send a variety of payload sizes. Events can be batched to a single larger request, or they may contain significant information. Consider payload size limits in your event-driven system. API Gateway and Lambda have limits of 10 Mb and 6 Mb. However, DynamoDB and SQS are limited to 400kb and 256kb (with extension for large messages) which can represent a bottleneck.

Instead of processing the entire payload, S3 stores the payload. It is then referenced in DynamoDB, via its bucket name and object key. This is known as the claim-check pattern. With this approach, the architecture supports payloads of up to 6mb, as per the Lambda invocation payload quota.

Considerations and best practices for receiving webhooks

Idempotency: For reliability, many providers prioritize delivering at-least-once, even if it means not guaranteeing exactly once delivery. They can transmit the same request multiple times, resulting in duplicates. To handle this, a Lambda function checks against the event’s unique identifier against previous records in DynamoDB. If not already processed, you create a DynamoDB item.

Ordering: Consider processing requests in its intended order. As most providers prioritize at-least-once delivery, events can be out of order. To indicate order, events may include a timestamp or a sequence identifier in the payload. If not, ordering may be on a best-efforts basis based on when the webhook is received. To handle ordering reliably, select event-driven services that ensure ordering. This example uses DynamoDB Streams and EventBridge Pipes.

Flexible Processing: EventBridge Pipes provide integrations to a range of event-driven services as targets. You can route events to different targets based on filters. Different event types may require different processors. For example, you can use Step Functions for orchestrating complex workflows, Lambda for compute operations with less than 15-minute execution time, SQS to buffer requests, and Amazon Elastic Container Service (ECS) for long-running compute jobs. EventBridge Pipes provide transformation to ensure only necessary payloads are sent, and enrichment if additional information is required.

Costs: This example considers a use case that can handle large payloads. However, if you can ensure that providers send minimal payloads, consider a simpler architecture without the claim-check pattern to minimize cost.

Conclusion

Webhooks are a popular method for applications to communicate, and for businesses to collaborate and integrate with customers and partners.

This post shows how you can build applications to send and receive webhooks on AWS. It uses serverless services such as EventBridge and Lambda, which are well-suited for event-driven use cases. It covers high-level reference architectures, considerations, best practices and code sample to assist in building your solution.

For standards and best practices on webhooks, visit the open-source community resources Webhooks.fyi and CloudEvents.io.

For more serverless learning resources, visit Serverless Land.

Serverless ICYMI Q3 2023

Post Syndicated from Benjamin Smith original https://aws.amazon.com/blogs/compute/serverless-icymi-q3-2023/

Welcome to the 23rd edition of the AWS Serverless ICYMI (in case you missed it) quarterly recap. Every quarter, we share all the most recent product launches, feature enhancements, blog posts, webinars, live streams, and other interesting things that you might have missed!

In case you missed our last ICYMI, check out what happened last quarter here.

AWS announces the general availability of Amazon Bedrock

Amazon Web Services (AWS) unveils five generative artificial intelligence (AI) innovations to democratize generative AI applications. Amazon Bedrock, now generally available, enables experimentation with top foundation models (FMs) and allows customization with proprietary data.

It supports creating managed agents for complex tasks without code and ensures security and privacy. Amazon Titan Embeddings, another FM, is generally available for various language-related use cases. Meta’s Llama 2, coming soon, enhances dialogue scenarios.

The upcoming Amazon CodeWhisperer customization capability enables secure customization using private code bases. Generative BI authoring capabilities in Amazon QuickSight simplify visualization creation for business analysts.

AWS Lambda

AWS Lambda now detects and stops recursive loops in Lambda functions. AWS Lambda now detects and halts functions caught in recursive or infinite loops, guarding against unexpected costs. Lambda identifies recursive behavior, discontinuing requests after 16 invocations. The feature addresses pitfalls stemming from misconfiguration or coding bugs, introducing detailed error messaging, and allowing users to set maximum limits on retry intervals. Notifications about recursive occurrences are relayed through the AWS Health Dashboard, emails, and CloudWatch Alarms for streamlined troubleshooting. Lambda uses AWS X-Ray trace headers for invocation tracking, requiring supported AWS SDK versions.

AWS simplifies writing .NET 6 Lambda functions. The Lambda Annotations Framework for .NET. A new programming model makes the experience of writing Lambda functions in C# feel more natural for .NET developers by using C# source generator technology. This streamlines the development workflow for .NET developers, making it easier to create serverless applications using the latest version of the .NET framework.

AWS Lambda and Amazon EventBridge Pipes now support enhanced filtering. Additional filtering capabilities include the ability to match against characters at the end of a value (suffix filtering), ignore case sensitivity (equals-ignore-case), and have a single rule match if any conditions across multiple separate fields are true (OR matching).

AWS Lambda Functions powered by AWS Graviton2 are now available in 6 additional Regions. Graviton2 processors are known for their performance benefits, and this expansion provides users with more choices for running serverless workloads.

AWS Lambda adds support for Python 3.11 allowing developers to take advantage of the latest features and improvements in the Python programming language for their serverless functions.

AWS Step Functions

AWS Step Functions enhances Workflow Studio, focusing on an Advanced Starter Template and Code Mode for efficient AWS Step Functions workflow creation. Users benefit from streamlined design-to-code transitions, pasting Amazon States Language (ASL) definitions directly into Workflow Studio, speeding up adjustments. Enhanced workflow execution and configuration allow direct execution and setting adjustments within Workflow Studio, improving user experience.

AWS Step Functions launches enhanced error handling This update helps users to identify errors with precision and refine retry strategies. Step Functions now enables detailed error messages in Fail states and precise control over retry intervals. Use the new maximum limits and jitter functionality to ensure efficient and controlled retries, preventing service overload in recovery scenarios.

AWS Step Functions distributed map is now available in the AWS GovCloud (US) Regions. This release highlights the availability of the distributed map feature in Step Functions specifically tailored for the AWS GovCloud (US) Regions. The distributed map feature is a powerful capability for orchestrating parallel and distributed processing in serverless workflows.

AWS SAM

AWS SAM CLI announces local testing and debugging support on Terraform projects.

Developers can now use AWS SAM CLI to locally test and debug AWS Lambda functions and Amazon API Gateway defined in their Terraform projects. AWS SAM CLI reads infrastructure resource information from the Terraform application, allowing users to start Lambda functions and API Gateway endpoints locally in a Docker container.

This update enables faster development cycles for Terraform users, who can use AWS SAM CLI commands like `AWS SAM local start-api`, `sam local start-lambda`, and `sam local invoke`, along with `sam local generate` for generating mock test events.

Amazon EventBridge

Amazon EventBridge Scheduler adds schedule deletion after completion. This feature offers enhanced functionality by supporting the automatic deletion of schedules upon completion of their last invocation. It is applicable to various scheduling types, including one-time, cron, and rate schedules with an end date. Amazon EventBridge Scheduler, a centralized and highly scalable service, enables the creation, execution, and management of schedules.

With the ability to schedule millions of tasks invoking over 270 AWS services and 6,000 API operations. This update streamlines the process of managing completed schedules. The automatic deletion feature reduces the need for manual intervention or custom code, saving time and simplifying scalability for users leveraging EventBridge Scheduler.

Amazon EventBridge Pipes now available in three additional Regions. This update extends the availability of Amazon EventBridge Pipes, a powerful event-routing service, to three additional Regions.

Amazon EventBridge API Destinations is now available in additional Regions. Providing users with more options for building scalable and decoupled applications.

Amazon EventBridge Schema Registry and Schema Discovery now in additional Regions. This expansion allows you to discover and store event structure – or schema – in a shared, central location. You can download code bindings for those schemas for Java, Python, TypeScript, and Golang so it’s easier to use events as objects in your code.

Amazon SNS

To enhance message privacy and security, Amazon Simple Notification Service (SNS) implemented Message Data Protection, allowing users to de-identify outbound messages via redaction or masking. Amazon SNS FIFO topics now support message delivery to Amazon SQS Standard queues. This provides users with increased flexibility in managing message delivery and ordering.

Expanding its monitoring capabilities, Amazon SNS introduced Additional Usage Metrics in Amazon CloudWatch. This enhancement allows users to gain more comprehensive insights into the performance and utilization of their SNS resources. SNS extended its global SMS sending capabilities to Israel (Tel Aviv), providing users in that Region with additional options for SMS notifications. SNS also expanded its reach by supporting Mobile Push Notifications in twelve new AWS Regions. This expansion aligns with the growing demand for mobile notification capabilities, offering a broader coverage for users across diverse Regions.

Amazon SQS

Amazon Simple Queue Service (SQS) introduced a number of updates. Attribute-Based Access Control (ABAC) was implemented for scalable access permissions, while message data protection can now de-identify outbound messages via redaction or masking. SQS FIFO topics now support message delivery to Amazon SQS Standard queues, providing enhanced flexibility. Addressing throughput demands, SQS increased the quota for FIFO High Throughput mode. JSON protocol support was previewed, offering improved message format flexibility. These updates underscore SQS’s commitment to advanced security and flexibility.

Amazon API Gateway

Amazon API Gateway undergoes a console refresh, aligning with Cloudscape Design System guidelines. Notable enhancements include improved usability, sortable tables, enhanced API key management, and direct API deployment from the Resource view. The update introduces dark mode, accessibility improvements, and visual alignment with HTTP APIs and AWS Services.

GOTO EDA day Nashville 2023

Join GOTO EDA Day in Nashville on October 26 for insights on event-driven architectures. Learn from industry leaders at Music City Center with talks, panels, and Hands-On Labs. Limited tickets available.

Serverless blog posts

July 2023

July 5- Implementing AWS Lambda error handling patterns

July 6 – Implementing AWS Lambda error handling patterns

July 7 – Understanding AWS Lambda’s invoke throttling limits

July 10 – Detecting and stopping recursive loops in AWS Lambda functions

July 11 – Implementing patterns that exit early out of a parallel state in AWS Step Functions

July 26 – Migrating AWS Lambda functions from the Go1.x runtime to the custom runtime on Amazon Linux 2

July 27 – Python 3.11 runtime now available in AWS Lambda

August 2023

August 2 – Automatically delete schedules upon completion with Amazon EventBridge Scheduler

August 7 – Using response streaming with AWS Lambda Web Adapter to optimize performance

August 15 – Integrating IBM MQ with Amazon SQS and Amazon SNS using Apache Camel

August 15 – Implementing the transactional outbox pattern with Amazon EventBridge Pipes

August 23 – Protecting an AWS Lambda function URL with Amazon CloudFront and Lambda@Edge

August 29 – Enhancing file sharing using Amazon S3 and AWS Step Functions

August 31 – Enhancing Workflow Studio with new features for streamlined authoring

September 2023

September 5 – AWS SAM support for HashiCorp Terraform now generally available

September 14 – Building a secure webhook forwarder using an AWS Lambda extension and Tailscale

September 18 – Building resilient serverless applications using chaos engineering

September 19 – Implementing idempotent AWS Lambda functions with Powertools for AWS Lambda (TypeScript)

September 19 – Centralizing management of AWS Lambda layers across multiple AWS Accounts

September 26 – Architecting for scale with Amazon API Gateway private integrations

September 26 – Visually design your application with AWS Application Composer

Videos

Serverless Office Hours – Tues 10AM PT

July 2023

July 4 – Benchmarking Lambda cold starts

July 11 – Lambda testing: AWS SAM remote invoke

July 18 – Using DynamoDB global tables

July 25 – Serverless observability with SLIC-watch

August 2023

August 1 – Step Functions versions and aliases

August 8 – Deploying Lambda with EKS and Crossplane / Managing Lambda with Kubernetes

August 15 – Serverless caching with Momento

September 2023

September 5 – Run any web app on Lambda

September 12 – Building an API platform on AWS

September 19 – Idempotency: exactly once processing

September 26 – AWS Amplify Studio + GraphQL

FooBar Serverless YouTube channel

July 2023

July 27 – Generative AI and Serverless to create a new story everyday

August 2023

August 3Getting started with Data Streaming

August 10 – Amazon Kinesis Data Streams – Shards? Provisioned? On-demand? What does all this mean?

August 17 – Put and consume events with AWS Lambda, Amazon Kinesis Data Stream and Event Source Mapping

August 24 – Create powerful data pipelines with Amazon Kinesis and EventBridge Pipes

August 31 – New Step Functions versions and alias!

September 2023

September 7 – Amazon Kinesis Data Firehose – What is this service for?

September 14 – Kinesis Data Firehose with AWS CDK – Lambda transformations

September 21 – Advanced Event Source Mapping configuration | AWS Lambda and Amazon Kinesis Data Streams

September 28 – Data Streaming Patterns

Still looking for more?

The Serverless landing page has more information. The Lambda resources page contains case studies, webinars, whitepapers, customer stories, reference architectures, and even more Getting Started tutorials.

You can also follow the Serverless Developer Advocacy team on Twitter to see the latest news, follow conversations, and interact with the team.

Filtering events in Amazon EventBridge with wildcard pattern matching

Post Syndicated from James Beswick original https://aws.amazon.com/blogs/compute/filtering-events-in-amazon-eventbridge-with-wildcard-pattern-matching/

This post is written by Rajdeep Banerjee, Sr PSA, and Brian Krygsman, Sr. Solutions Architect.

Amazon EventBridge recently announced support for wildcard filters in rule event patterns. An EventBridge event bus is a serverless event router that helps you decouple your event-driven systems. You can route events between your systems, AWS services, or third-party SaaS services. You attach a rule to your event bus to define logic for routing events from producers to consumers.

You set an event pattern on the rule to filter incoming events to specific consumers. The new wildcard filter lets you build more flexible event matching patterns to reduce rule management and optimize your event consumers. This shows how these EventBridge attributes work together.

How EventBridge features work together

Wildcard filters use the wildcard character (*) to match zero, single, or multiple characters in a string value. For example, a filter string like "*.png"  matches strings that end with ".png".

You can also use multiple wildcard characters in a filter. For example, a filter string like "*Title*" matches string values that include "Title" in the middle. When using wildcard filters, be careful to avoid matching more events than you intend.

This blog post describes how you can use wildcard filters in example scenarios. For more information about event-driven architectures, visit Serverless Land.

Wildcard pattern matching in S3 Event Notifications

Applications must often perform an action when new data is available. One example can be to process trading data uploaded to your Amazon S3 bucket. The data may be stored in individual folders depending on the date, time, and stock symbol. Business rules may dictate that when stock XYZ receives a file, it must send a notification to a downstream system.

This is the typical folder structure in an S3 bucket:

s3 folder structure

S3 can send an event to EventBridge when an object is written to a bucket. The S3 event includes the object key (for example, 2023-10-01/T13:22:22Z/XYZ/filename.ext). When any object is uploaded to the XYZ folder, you can use an EventBridge rule to send these events to a downstream service like an Amazon SQS.

Before this launch, you would first send the event to an AWS Lambda function. Existing prefix and suffix filters alone are insufficient because of the extra date and time folders. The function would run your code to inspect the object path for the stock symbol. Your code would then forward events to SQS when they matched.

With the new wildcard patterns in EventBridge rules, the logic is simpler. You no longer need to create a Lambda function to run custom matching code. You can instead use wildcard characters in the rule’s filter pattern, matching against portions of the S3 object key.

  1. To use this, start with creating a new rule in the EventBridge console:
    Define rule detail
  2. Choose Next. Keep the standard parameters and move to the Event pattern section. Here you can use a JSON-based event pattern.
    {
      "source": ["aws.s3"],
      "detail": {
        "bucket": {
          "name": ["intraday-trading-data"]
        },
        "object": {
          "key": [{
            "wildcard": "*/XYZ/*"
          }]
        }
      }
    }
    
  3. This pattern looks for Event Notifications from a specific bucket. The pattern then filters the events further by the object keys that match "*/XYZ/*". The rule filters out notifications from other stock symbols, listening to only “XYZ“ data, irrespective of date and time of the data feed.
  4. To use an SQS queue for the filtered event target, you must provide resource-based policies for EventBridge to send messages to the queue.
    Select target(s)
  5. Choose Next and review the rule details before saving.
  6. Before testing, enable S3 event notifications to EventBridge in the S3 console:
    Enable S3 event notifications to EventBridge in the S3 console
  7. To test the new wildcard pattern, upload any sample CSV file in the XYZ folder to launch the Event Notifications.
    Upload CSV
  8. You can monitor EventBridge CloudWatch metrics to check if the rule is invoked from the S3 upload. The SQS CloudWatch metrics show if messages are received from the EventBridge rule.
    CloudWatch metrics

Filtering based on Amazon Resource Name (ARN)

Customers often need to perform actions when AWS Identity and Access Management (IAM) policies are added to specific roles. You can achieve this by creating custom EventBridge rules, which filter the event to match or create multiple rules to achieve the same effect. With the newly introduced wildcard filter, the task to invoke an action is simplified.

Consider an IAM role with fine-grained IAM policies attached. You may need to ensure any new policy attached to this role must be from a specific ARNs. This action can be implemented like this.

When you attach a new IAM policy to a role, it generates an event like this:

{
    "version": "0",
    "id": "0b85984e-ec53-84ba-140e-9e0cff7f05b4",
    "detail-type": "AWS API Call via CloudTrail",
    "source": "aws.iam",
    "account": "123456789012",
    "time": "2023-10-07T20:23:28Z",
    "region": "us-east-1",
    "resources": [],
    "detail": {
        "eventVersion": "1.08",
        "userIdentity": {
            "arn": "arn:aws:sts::123456789012:assumed-role/Admin/UserName",
            // ... additional detail fields
        },
        "eventTime": "2023-10-07T20:23:28Z",
        "eventSource": "iam.amazonaws.com",
        "eventName": "AttachRolePolicy",
        // ... additional detail fields

    }
}

You can create a rule matching against a combination of these event properties. You can filter detail.userIdentity.arn with a wildcard to catch events that come from a particular ARN. You can then route these events to a target like an Amazon CloudWatch Logs stream to record the change. You can also route them to Amazon Simple Notification Service (SNS). You can use the SNS notification to start a review and ensure that the newly attached policies are well-crafted as part of your reconciliation and audit process. The filter looks like this:

{
  "source": ["aws.iam"],
  "detail-type": ["AWS API Call via CloudTrail"],
  "detail": {
    "eventSource": ["iam.amazonaws.com"],
    "eventName": ["AttachRolePolicy"],
    "userIdentity": {
      "arn": [{
        "wildcard": "arn:aws:sts::123456789012:assumed-role/*/*"
      }]
    }
  }
}

Filtering custom events

You can use EventBridge to build your own event-driven systems with loosely coupled, scalable application services. When building event-driven applications in AWS, you can publish events to the default event bus, or create a custom event bus. You define the structure of events emitted from your services.

This structure is known as the event schema. When you attach rules to your bus to route events from producers to consumers, you match against values from properties in your event schema. Wildcard filters allow you to match property values that are unknown ahead of time, or across multiple value variants.

Consider an ecommerce application as an example. You may have several decoupled services working together, like a shopping cart service, an inventory service, and others. Each of these services emits events onto your event bus as your customers shop.

Events may include errors, to record problems customers encounter using your system. You can use a single rule with a wildcard filter to match all error events and send them to a common target. This allows you to simplify observability across your services.

This is the event flow:

Event flow

Your shopping cart service may emit a timeout error event:

{
  "version": "0",
  "id": "24a4b957-570d-590b-c213-2a72e5dc4c66",
  "detail-type": "shopping.cart.error.timeout",
  "source": "com.mybusiness.shopping.cart",
  "account": "123456789012",
  "time": "2023-10-06T03:28:44Z",
  "region": "us-west-2",
  "resources": [],
  "detail": {
    "message": "Operation timed out.",
    "related-entity": {
      "entity-type": "order",
      "id": "123"
    },
    // ... additional detail fields
  }
}

The detail-type property of the example event determines what type of event this is. Other services may emit error events with different prefixes in detail-type. Other error types might have different suffixes in detail-type.

For example, an inventory service may emit an out-of-stock error event like this:

{
  "version": "0",
  "id": "e456f480-cc1e-47fa-8399-ab2e54116958",
  "detail-type": "shopping.inventory.error.outofstock",
  "source": "com.mybusiness.shopping.inventory",
  "account": "123456789012",
  "time": "2023-10-06T03:28:44Z",
  "region": "us-west-2",
  "resources": [],
  "detail": {
    "message": "Product cannot be added to a cart. Out of stock.",
    "related-entity": {
      "entity-type": "product",
      "id": "456"
    }
    // ... additional detail fields
  }
}

To route these events to a common target like an Amazon CloudWatch Logs stream, you can create a rule with a wildcard filter matching against detail-type. You can combine this with a prefix filter on source that filters events down to only services from your shopping system. The filter looks like this:

{
  "source": [{
    "prefix": "com.mybusiness.shopping."
  }],
  "detail-type": [{
    "wildcard": "*.error.*"
  }]
}

Without a wildcard filter you would need to create a more complex matching pattern, possibly across multiple rules.

Conclusion

Wildcard filters in EventBridge rules help simplify your event driven applications by ensuring the correct events are passed on to your targets. The new feature reduces the need for custom code, which was required previously. Try EventBridge rules with wildcard filters and experience the benefits of this new feature in your event-driven serverless applications.

For more serverless learning resources, visit Serverless Land.

Build event-driven architectures with Amazon MSK and Amazon EventBridge

Post Syndicated from Florian Mair original https://aws.amazon.com/blogs/big-data/build-event-driven-architectures-with-amazon-msk-and-amazon-eventbridge/

Based on immutable facts (events), event-driven architectures (EDAs) allow businesses to gain deeper insights into their customers’ behavior, unlocking more accurate and faster decision-making processes that lead to better customer experiences. In EDAs, modern event brokers, such as Amazon EventBridge and Apache Kafka, play a key role to publish and subscribe to events. EventBridge is a serverless event bus that ingests data from your own apps, software as a service (SaaS) apps, and AWS services and routes that data to targets. Although there is overlap in their role as the backbone in EDAs, both solutions emerged from different problem statements and provide unique features to solve specific use cases. With a solid understanding of both technologies and their primary use cases, developers can create easy-to-use, maintainable, and evolvable EDAs.

If the use case is well defined and directly maps to one event bus, such as event streaming and analytics with streaming events (Kafka) or application integration with simplified and consistent event filtering, transformation, and routing on discrete events (EventBridge), the decision for a particular broker technology is straightforward. However, organizations and business requirements are often more complex and beyond the capabilities of one broker technology. In almost any case, choosing an event broker should not be a binary decision. Combining complementary broker technologies and embracing their unique strengths is a solid approach to build easy-to-use, maintainable, and evolvable EDAs. To make the integration between Kafka and EventBridge even smoother, AWS open-sourced the EventBridge Connector based on Apache Kafka. This allows you to consume from on-premises Kafka deployments and avoid point-to-point communication, while using the existing knowledge and toolset of Kafka Connect.

Streaming applications enable stateful computations over unbound datasets. This allows real-time use cases such as anomaly detection, event-time computations, and much more. These applications can be built using frameworks such as Apache Flink, Apache Spark, or Kafka Streams. Although some of those frameworks support sending events to downstream systems other than Apache Kafka, there is no standardized way of doing so across frameworks. It would require each application owner to build their own logic to send events downstream. In an EDA, the preferred way to handle such a scenario is to publish events to an event bus and then send them downstream.

There are two ways to send events from Apache Kafka to EventBridge: the preferred method using Amazon EventBridge Pipes or the EventBridge sink connector for Kafka Connect. In this post, we explore when to use which option and how to build an EDA using the EventBridge sink connector and Amazon Managed Streaming for Apache Kafka (Amazon MSK).

EventBridge sink connector vs. EventBridge Pipes

EventBridge Pipes connects sources to targets with a point-to-point integration, supporting event filtering, transformations, enrichment, and event delivery to over 14 AWS services and external HTTPS-based targets using API Destinations. This is the preferred and most easy method to send events from Kafka to EventBridge as it simplifies the setup and operations with a delightful developer experience.

Alternatively, under the following circumstances you might want to choose the EventBridge sink connector to send events from Kafka directly to EventBridge Event Buses:

  • You are have already invested in processes and tooling around the Kafka Connect framework as the platform of your choice to integrate with other systems and services
  • You need to integrate with a Kafka-compatible schema registry e.g., the AWS Glue Schema Registry, supporting Avro and Protobuf data formats for event serialization and deserialization
  • You want to send events from on-premises Kafka environments directly to EventBridge Event Buses

Overview of solution

In this post, we show you how to use Kafka Connect and the EventBridge sink connector to send Avro-serialized events from Amazon Managed Streaming for Apache Kafka (Amazon MSK) to EventBridge. This enables a seamless and consistent data flow from Apache Kafka to dozens of supported EventBridge AWS and partner targets, such as Amazon CloudWatch, Amazon SQS, AWS Lambda, and HTTPS targets like Salesforce, Datadog, and Snowflake using EventBridge API destinations. The following diagram illustrates the event-driven architecture used in this blog post based on Amazon MSK and EventBridge.

Architecture Diagram

The workflow consists of the following steps:

  1. The demo application generates credit card transactions, which are sent to Amazon MSK using the Avro format.
  2. An analytics application running on Amazon Elastic Container Service (Amazon ECS) consumes the transactions and analyzes them if there is an anomaly.
  3. If an anomaly is detected, the application emits a fraud detection event back to the MSK notification topic.
  4. The EventBridge connector consumes the fraud detection events from Amazon MSK in Avro format.
  5. The connector converts the events to JSON and sends them to EventBridge.
  6. In EventBridge, we use JSON filtering rules to filter our events and send them to other services or another Event Bus. In this example, fraud detection events are sent to Amazon CloudWatch Logs for auditing and introspection, and to a third-party SaaS provider to showcase how easy it is to integrate with third-party APIs, such as Salesforce.

Prerequisites

For this walkthrough, you should have the following prerequisites:

Deploy the AWS CDK stack

This walkthrough requires you to deploy an AWS CDK stack to your account. You can deploy the full stack end to end or just the required resources to follow along with this post.

  1. In your terminal, run the following command:
    git clone https://github.com/awslabs/eventbridge-kafka-connector/

  2. Navigate to the cdk directory:
    cd eventbridge-kafka-connector/cdk

  3. Deploy the AWS CDK stack based on your preferences:
  4. If you want to see the complete setup explained in this post, run the following command:
    cdk deploy —context deployment=FULL

  5. If you want to deploy the connector on your own but have the required resources already, including the MSK cluster, AWS Identity and Access Management (IAM) roles, security groups, data generator, and so on, run the following command:
    cdk deploy —context deployment=PREREQ

Deploy the EventBridge sink connector on Amazon MSK Connect

If you deployed the CDK stack in FULL mode, you can skip this section and move on to Create EventBridge rules.

The connector needs an IAM role that allows reading the data from the MSK cluster and sending records downstream to EventBridge.

Upload connector code to Amazon S3

Complete the following steps to upload the connector code to Amazon Simple Storage Service (Amazon S3):

  1. Navigate to the GitHub repo.
  2. Download the release 1.0.0 with the AWS Glue Schema Registry dependencies included.
  3. On the Amazon S3 console, choose Buckets in the navigation pane.
  4. Choose Create bucket.
  5. For Bucket name, enter eventbridgeconnector-bucket-${AWS_ACCOUNT_ID}.

As Because S3 buckets must be globally unique, replace ${AWS_ACCOUNT_ID} with your actual AWS account ID. For example, eventbridgeconnector-bucket-123456789012.

  1. Open the bucket and choose Upload.
  2. Select the .jar file that you downloaded from the GitHub repository and choose Upload.

S3 File Upload Console

Create a custom plugin

We now have our application code in Amazon S3. As a next step, we create a custom plugin in Amazon MSK Connect. Complete the following steps:

  1. On the Amazon MSK console, choose Custom plugins in the navigation pane under MSK Connect.
  2. Choose Create custom plugin.
  3. For S3 URI – Custom plugin object, browse to the file named kafka-eventbridge-sink-with-gsr-dependencies.jar in the S3 bucket eventbridgeconnector-bucket-${AWS_ACCOUNT_ID} for the EventBridge connector.
  4. For Custom plugin name, enter msk-eventBridge-sink-plugin-v1.
  5. Enter an optional description.
  6. Choose Create custom plugin.

MSK Connect Plugin Screen

  1. Wait for plugin to transition to the status Active.

Create a connector

Complete the following steps to create a connector in MSK Connect:

  1. On the Amazon MSK console, choose Connectors in the navigation pane under MSK Connect.
  2. Choose Create connector.
  3. Select Use existing custom plugin and under Custom plugins, select the plugin msk-eventBridge-sink-plugin-v1 that you created earlier.
  4. Choose Next.
  5. For Connector name, enter msk-eventBridge-sink-connector.
  6. Enter an optional description.
  7. For Cluster type, select MSK cluster.
  8. For MSK clusters, select the cluster you created earlier.
  9. For Authentication, choose IAM.
  10. Under Connector configurations, enter the following settings (for more details on the configuration, see the GitHub repository):
    auto.offset.reset=earliest
    connector.class=software.amazon.event.kafkaconnector.EventBridgeSinkConnector
    topics=notifications
    aws.eventbridge.connector.id=avro-test-connector
    aws.eventbridge.eventbus.arn=arn:aws:events:us-east-1:123456789012:event-bus/eventbridge-sink-eventbus
    aws.eventbridge.region=us-east-1
    tasks.max=1
    key.converter=org.apache.kafka.connect.storage.StringConverter
    value.converter=com.amazonaws.services.schemaregistry.kafkaconnect.AWSKafkaAvroConverter
    value.converter.region=us-east-1
    value.converter.registry.name=default-registry
    value.converter.avroRecordType=GENERIC_RECORD

  11. Make sure to replace aws.eventbridge.eventbus.arn, aws.eventbridge.region, and value.converter.region with the values from the prerequisite stack.
  12. In the Connector capacity section, select Autoscaled for Capacity type.
  13. Leave the default value of 1 for MCU count per worker.
  14. Keep all default values for Connector capacity.
  15. For Worker configuration, select Use the MSK default configuration.
  16. Under Access permissions, choose the custom IAM role KafkaEventBridgeSinkStack-connectorRole, which you created during the AWS CDK stack deployment.
  17. Choose Next.
  18. Choose Next again.
  19. For Log delivery, select Deliver to Amazon CloudWatch Logs.
  20. For Log group, choose /aws/mskconnect/eventBridgeSinkConnector.
  21. Choose Next.
  22. Under Review and Create, validate all the settings and choose Create connector.

The connector will be now in the state Creating. It can take up to several minutes for the connector to transition into the status Running.

Create EventBridge rules

Now that the connector is forwarding events to EventBridge, we can use EventBridge rules to filter and send events to other targets. Complete the following steps to create a rule:

  1. On the EventBridge console, choose Rules in the navigation pane.
  2. Choose Create rule.
  3. Enter eb-to-cloudwatch-logs-and-webhook for Name.
  4. Select eventbridge-sink-eventbus for Event bus.
  5. Choose Next.
  6. Select Custom pattern (JSON editor), choose Insert, and replace the event pattern with the following code:
    {
      "detail": {
        "value": {
          "eventType": ["suspiciousActivity"],
          "source": ["transactionAnalyzer"]
        }
      },
      "detail-type": [{
        "prefix": "kafka-connect-notification"
      }]
    }
    

  7. Choose Next.
  8. For Target 1, select CloudWatch log group and enter kafka-events for Log Group.
  9. Choose Add another target.
  10. (Optional: Create an API destination) For Target 2, select EventBridge API destination for Target types.
  11. Select Create a new API destination.
  12. Enter a descriptive name for Name.
  13. Add the URL and enter it as API destination endpoint. (This can be the URL of your Datadog, Salesforce, etc. endpoint)
  14. Select POST for HTTP method.
  15. Select Create a new connection for Connection.
  16. For Connection Name, enter a name.
  17. Select Other as Destination type and select API Key as Authorization Type.
  18. For API key name and Value, enter your keys.
  19. Choose Next.
  20. Validate your inputs and choose Create rule.

EventBridge Rule

The following screenshot of the CloudWatch Logs console shows several events from EventBridge.

CloudWatch Logs

Run the connector in production

In this section, we dive deeper into the operational aspects of the connector. Specifically, we discuss how the connector scales and how to monitor it using CloudWatch.

Scale the connector

Kafka connectors scale through the number of tasks. The code design of the EventBridge sink connector doesn’t limit the number of tasks that it can run. MSK Connect provides the compute capacity to run the tasks, which can be from Provisioned or Autoscaled type. During the deployment of the connector, we choose the capacity type Autoscaled and 1 MCU per worker (which represents 1vCPU and 4GiB of memory). This means MSK Connect will scale the infrastructure to run tasks but not the number of tasks. The number of tasks is defined by the connector. By default, the connector will start with the number of tasks defined in tasks.max in the connector configuration. If this value is higher than the partition count of the processed topic, the number of tasks will be set to the number of partitions during the Kafka Connect rebalance.

Monitor the connector

MSK Connect emits metrics to CloudWatch for monitoring by default. Besides MSK Connect metrics, the offset of the connector should also be monitored in production. Monitoring the offset gives insights if the connector can keep up with the data produced in the Kafka cluster.

Clean up

To clean up your resources and avoid ongoing charges, complete the following the steps:

  1. On the Amazon MSK console, choose Connectors in the navigation pane under MSK Connect.
  2. Select the connectors you created and choose Delete.
  3. Choose Clusters in the navigation pane.
  4. Select the cluster you created and choose Delete on the Actions menu.
  5. On the EventBridge console, choose Rules in the navigation pane.
  6. Choose the event bus eventbridge-sink-eventbus.
  7. Select all the rules you created and choose Delete.
  8. Confirm the removal by entering delete, then choose Delete.

If you deployed the AWS CDK stack with the context PREREQ, delete the .jar file for the connector.

  1. On the Amazon S3 console, choose Buckets in the navigation pane.
  2. Navigate to the bucket where you uploaded your connector and delete the kafka-eventbridge-sink-with-gsr-dependencies.jar file.

Independent from the chosen deployment mode, all other AWS resources can be deleted by using AWS CDK or AWS CloudFormation. Run cdk destroy from the repository directory to delete the CloudFormation stack.

Alternatively, on the AWS CloudFormation console, select the stack KafkaEventBridgeSinkStack and choose Delete.

Conclusion

In this post, we showed how you can use MSK Connect to run the AWS open-sourced Kafka connector for EventBridge, how to configure the connector to forward a Kafka topic to EventBridge, and how to use EventBridge rules to filter and forward events to CloudWatch Logs and a webhook.

To learn more about the Kafka connector for EventBridge, refer to Amazon EventBridge announces open-source connector for Kafka Connect, as well as the MSK Connect Developer Guide and the code for the connector on the GitHub repo.


About the Authors

Florian Mair is a Senior Solutions Architect and data streaming expert at AWS. He is a technologist that helps customers in Germany succeed and innovate by solving business challenges using AWS Cloud services. Besides working as a Solutions Architect, Florian is a passionate mountaineer, and has climbed some of the highest mountains across Europe.

Benjamin Meyer is a Senior Solutions Architect at AWS, focused on Games businesses in Germany to solve business challenges by using AWS Cloud services. Benjamin has been an avid technologist for 7 years, and when he’s not helping customers, he can be found developing mobile apps, building electronics, or tending to his cacti.

Simplify operational data processing in data lakes using AWS Glue and Apache Hudi

Post Syndicated from Ravi Itha original https://aws.amazon.com/blogs/big-data/simplify-operational-data-processing-in-data-lakes-using-aws-glue-and-apache-hudi/

The Analytics specialty practice of AWS Professional Services (AWS ProServe) helps customers across the globe with modern data architecture implementations on the AWS Cloud. A modern data architecture is an evolutionary architecture pattern designed to integrate a data lake, data warehouse, and purpose-built stores with a unified governance model. It focuses on defining standards and patterns to integrate data producers and consumers and move data between data lakes and purpose-built data stores securely and efficiently. Out of the many data producer systems that feed data to a data lake, operational databases are most prevalent, where operational data is stored, transformed, analyzed, and finally used to enhance business operations of an organization. With the emergence of open storage formats such as Apache Hudi and its native support from AWS Glue for Apache Spark, many AWS customers have started adding transactional and incremental data processing capabilities to their data lakes.

AWS has invested in native service integration with Apache Hudi and published technical contents to enable you to use Apache Hudi with AWS Glue (for example, refer to Introducing native support for Apache Hudi, Delta Lake, and Apache Iceberg on AWS Glue for Apache Spark, Part 1: Getting Started). In AWS ProServe-led customer engagements, the use cases we work on usually come with technical complexity and scalability requirements. In this post, we discuss a common use case in relation to operational data processing and the solution we built using Apache Hudi and AWS Glue.

Use case overview

AnyCompany Travel and Hospitality wanted to build a data processing framework to seamlessly ingest and process data coming from operational databases (used by reservation and booking systems) in a data lake before applying machine learning (ML) techniques to provide a personalized experience to its users. Due to the sheer volume of direct and indirect sales channels the company has, its booking and promotions data are organized in hundreds of operational databases with thousands of tables. Of those tables, some are larger (such as in terms of record volume) than others, and some are updated more frequently than others. In the data lake, the data to be organized in the following storage zones:

  1. Source-aligned datasets – These have an identical structure to their counterparts at the source
  2. Aggregated datasets – These datasets are created based on one or more source-aligned datasets
  3. Consumer-aligned datasets – These are derived from a combination of source-aligned, aggregated, and reference datasets enriched with relevant business and transformation logics, usually fed as inputs to ML pipelines or any consumer applications

The following are the data ingestion and processing requirements:

  1. Replicate data from operational databases to the data lake, including insert, update, and delete operations.
  2. Keep the source-aligned datasets up to date (typically within the range of 10 minutes to a day) in relation to their counterparts in the operational databases, ensuring analytics pipelines refresh consumer-aligned datasets for downstream ML pipelines in a timely fashion. Moreover, the framework should consume compute resources as optimally as possible per the size of the operational tables.
  3. To minimize DevOps and operational overhead, the company wanted to templatize the source code wherever possible. For example, to create source-aligned datasets in the data lake for 3,000 operational tables, the company didn’t want to deploy 3,000 separate data processing jobs. The smaller the number of jobs and scripts, the better.
  4. The company wanted the ability to continue processing operational data in the secondary Region in the rare event of primary Region failure.

As you can guess, the Apache Hudi framework can solve the first requirement. Therefore, we will put our emphasis on the other requirements. We begin with a Data lake reference architecture followed by an overview of operational data processing framework. By showing you our open-source solution on GitHub, we delve into framework components and walk through their design and implementation aspects. Finally, by testing the framework, we summarize how it meets the aforementioned requirements.

Data lake reference architecture

Let’s begin with a big picture: a data lake solves a variety of analytics and ML use cases dealing with internal and external data producers and consumers. The following diagram represents a generic data lake architecture. To ingest data from operational databases to an Amazon Simple Storage Service (Amazon S3) staging bucket of the data lake, either AWS Database Migration Service (AWS DMS) or any AWS partner solution from AWS Marketplace that has support for change data capture (CDC) can fulfill the requirement. AWS Glue is used to create source-aligned and consumer-aligned datasets and separate AWS Glue jobs to do feature engineering part of ML engineering and operations. Amazon Athena is used for interactive querying and AWS Lake Formation is used for access controls.

Data Lake Reference Architecture

Operational data processing framework

The operational data processing (ODP) framework contains three components: File Manager, File Processor, and Configuration Manager. Each component runs independently to solve a portion of the operational data processing use case. We have open-sourced this framework on GitHub—you can clone the code repo and inspect it while we walk you through the design and implementation of the framework components. The source code is organized in three folders, one for each component, and if you customize and adopt this framework for your use case, we recommend promoting these folders as separate code repositories in your version control system. Consider using the following repository names:

  1. aws-glue-hudi-odp-framework-file-manager
  2. aws-glue-hudi-odp-framework-file-processor
  3. aws-glue-hudi-odp-framework-config-manager

With this modular approach, you can independently deploy the components to your data lake environment by following your preferred CI/CD processes. As illustrated in the preceding diagram, these components are deployed in conjunction with a CDC solution.

Component 1: File Manager

File Manager detects files emitted by a CDC process such as AWS DMS and tracks them in an Amazon DynamoDB table. As shown in the following diagram, it consists of an Amazon EventBridge event rule, an Amazon Simple Queue Service (Amazon SQS) queue, an AWS Lambda function, and a DynamoDB table. The EventBridge rule uses Amazon S3 Event Notifications to detect the arrival of CDC files in the S3 bucket. The event rule forwards the object event notifications to the SQS queue as messages. The File Manager Lambda function consumes those messages, parses the metadata, and inserts the metadata to the DynamoDB table odpf_file_tracker. These records will then be processed by File Processor, which we discuss in the next section.

ODPF Component: File Manager

Component 2: File Processor

File Processor is the workhorse of the ODP framework. It processes files from the S3 staging bucket, creates source-aligned datasets in the raw S3 bucket, and adds or updates metadata for the datasets (AWS Glue tables) in the AWS Glue Data Catalog.

We use the following terminology when discussing File Processor:

  1. Refresh cadence – This represents the data ingestion frequency (for example, 10 minutes). It usually goes with AWS Glue worker type (one of G.1X, G.2X, G.4X, G.8X, G.025X, and so on) and batch size.
  2. Table configuration – This includes the Hudi configuration (primary key, partition key, pre-combined key, and table type (Copy on Write or Merge on Read)), table data storage mode (historical or current snapshot), S3 bucket used to store source-aligned datasets, AWS Glue database name, AWS Glue table name, and refresh cadence.
  3. Batch size – This numeric value is used to split tables into smaller batches and process their respective CDC files in parallel. For example, a configuration of 50 tables with a 10-minute refresh cadence and a batch size of 5 results in a total of 10 AWS Glue job runs, each processing CDC files for 5 tables.
  4. Table data storage mode – There are two options:
    • Historical – This table in the data lake stores historical updates to records (always append).
    • Current snapshot – This table in the data lake stores latest versioned records (upserts) with the ability to use Hudi time travel for historical updates.
  5. File processing state machine – It processes CDC files that belong to tables that share a common refresh cadence.
  6. EventBridge rule association with the file processing state machine – We use a dedicated EventBridge rule for each refresh cadence with the file processing state machine as target.
  7. File processing AWS Glue job – This is a configuration-driven AWS Glue extract, transform, and load (ETL) job that processes CDC files for one or more tables.

File Processor is implemented as a state machine using AWS Step Functions. Let’s use an example to understand this. The following diagram illustrates running File Processor state machine with a configuration that includes 18 operational tables, a refresh cadence of 10 minutes, a batch size of 5, and an AWS Glue worker type of G.1X.

ODP framework component: File Processor

The workflow includes the following steps:

  1. The EventBridge rule triggers the File Processor state machine every 10 minutes.
  2. Being the first state in the state machine, the Batch Manager Lambda function reads configurations from DynamoDB tables.
  3. The Lambda function creates four batches: three of them will be mapped to five operational tables each, and the fourth one is mapped to three operational tables. Then it feeds the batches to the Step Functions Map state.
  4. For each item in the Map state, the File Processor Trigger Lambda function will be invoked, which in turn runs the File Processor AWS Glue job.
  5. Each AWS Glue job performs the following actions:
    • Checks the status of an operational table and acquires a lock when it is not processed by any other job. The odpf_file_processing_tracker DynamoDB table is used for this purpose. When a lock is acquired, it inserts a record in the DynamoDB table with the status updating_table for the first time; otherwise, it updates the record.
    • Processes the CDC files for the given operational table from the S3 staging bucket and creates a source-aligned dataset in the S3 raw bucket. It also updates technical metadata in the AWS Glue Data Catalog.
    • Updates the status of the operational table to completed in the odpf_file_processing_tracker table. In case of processing errors, it updates the status to refresh_error and logs the stack trace.
    • It also inserts this record into the odpf_file_processing_tracker_history DynamoDB table along with additional details such as insert, update, and delete row counts.
    • Moves the records that belong to successfully processed CDC files from odpf_file_tracker to the odpf_file_tracker_history table with file_ingestion_status set to raw_file_processed.
    • Moves to the next operational table in the given batch.
    • Note: a failure to process CDC files for one of the operational tables of a given batch does not impact the processing of other operational tables.

Component 3: Configuration Manager

Configuration Manager is used to insert configuration details to the odpf_batch_config and odpf_raw_table_config tables. To keep this post concise, we provide two architecture patterns in the code repo and leave the implementation details to you.

Solution overview

Let’s test the ODP framework by replicating data from 18 operational tables to a data lake and creating source-aligned datasets with 10-minute refresh cadence. We use Amazon Relational Database Service (Amazon RDS) for MySQL to set up an operational database with 18 tables, upload the New York City Taxi – Yellow Trip Data dataset, set up AWS DMS to replicate data to Amazon S3, process the files using the framework, and finally validate the data using Amazon Athena.

Create S3 buckets

For instructions on creating an S3 bucket, refer to Creating a bucket. For this post, we create the following buckets:

  1. odpf-demo-staging-EXAMPLE-BUCKET – You will use this to migrate operational data using AWS DMS
  2. odpf-demo-raw-EXAMPLE-BUCKET – You will use this to store source-aligned datasets
  3. odpf-demo-code-artifacts-EXAMPLE-BUCKET – You will use this to store code artifacts

Deploy File Manager and File Processor

Deploy File Manager and File Processor by following instructions from this README and this README, respectively.

Set up Amazon RDS for MySQL

Complete the following steps to set up Amazon RDS for MySQL as the operational data source:

  1. Provision Amazon RDS for MySQL. For instructions, refer to Create and Connect to a MySQL Database with Amazon RDS.
  2. Connect to the database instance using MySQL Workbench or DBeaver.
  3. Create a database (schema) by running the SQL command CREATE DATABASE taxi_trips;.
  4. Create 18 tables by running the SQL commands in the ops_table_sample_ddl.sql script.

Populate data to the operational data source

Complete the following steps to populate data to the operational data source:

  1. To download the New York City Taxi – Yellow Trip Data dataset for January 2021 (Parquet file), navigate to NYC TLC Trip Record Data, expand 2021, and choose Yellow Taxi Trip records. A file called yellow_tripdata_2021-01.parquet will be downloaded to your computer.
  2. On the Amazon S3 console, open the bucket odpf-demo-staging-EXAMPLE-BUCKET and create a folder called nyc_yellow_trip_data.
  3. Upload the yellow_tripdata_2021-01.parquet file to the folder.
  4. Navigate to the bucket odpf-demo-code-artifacts-EXAMPLE-BUCKET and create a folder called glue_scripts.
  5. Download the file load_nyc_taxi_data_to_rds_mysql.py from the GitHub repo and upload it to the folder.
  6. Create an AWS Identity and Access Management (IAM) policy called load_nyc_taxi_data_to_rds_mysql_s3_policy. For instructions, refer to Creating policies using the JSON editor. Use the odpf_setup_test_data_glue_job_s3_policy.json policy definition.
  7. Create an IAM role called load_nyc_taxi_data_to_rds_mysql_glue_role. Attach the policy created in the previous step.
  8. On the AWS Glue console, create a connection for Amazon RDS for MySQL. For instructions, refer to Adding a JDBC connection using your own JDBC drivers and Setting up a VPC to connect to Amazon RDS data stores over JDBC for AWS Glue. Name the connection as odpf_demo_rds_connection.
  9. In the navigation pane of the AWS Glue console, choose Glue ETL jobs, Python Shell script editor, and Upload and edit an existing script under Options.
  10. Choose the file load_nyc_taxi_data_to_rds_mysql.py and choose Create.
  11. Complete the following steps to create your job:
    • Provide a name for the job, such as load_nyc_taxi_data_to_rds_mysql.
    • For IAM role, choose load_nyc_taxi_data_to_rds_mysql_glue_role.
    • Set Data processing units to 1/16 DPU.
    • Under Advanced properties, Connections, select the connection you created earlier.
    • Under Job parameters, add the following parameters:
      • input_sample_data_path = s3://odpf-demo-staging-EXAMPLE-BUCKET/nyc_yellow_trip_data/yellow_tripdata_2021-01.parquet
      • schema_name = taxi_trips
      • table_name = table_1
      • rds_connection_name = odpf_demo_rds_connection
    • Choose Save.
  12. On the Actions menu, run the job.
  13. Go back to your MySQL Workbench or DBeaver and validate the record count by running the SQL command select count(1) row_count from taxi_trips.table_1. You will get an output of 1369769.
  14. Populate the remaining 17 tables by running the SQL commands from the populate_17_ops_tables_rds_mysql.sql script.
  15. Get the row count from the 18 tables by running the SQL commands from the ops_data_validation_query_rds_mysql.sql script. The following screenshot shows the output.
    Record volumes (for 18 Tables) in Operational Database

Configure DynamoDB tables

Complete the following steps to configure the DynamoDB tables:

  1. Download file load_ops_table_configs_to_ddb.py from the GitHub repo and upload it to the folder glue_scripts in the S3 bucket odpf-demo-code-artifacts-EXAMPLE-BUCKET.
  2. Create an IAM policy called load_ops_table_configs_to_ddb_ddb_policy. Use the odpf_setup_test_data_glue_job_ddb_policy.json policy definition.
  3. Create an IAM role called load_ops_table_configs_to_ddb_glue_role. Attach the policy created in the previous step.
  4. On the AWS Glue console, choose Glue ETL jobs, Python Shell script editor, and Upload and edit an existing script under Options.
  5. Choose the file load_ops_table_configs_to_ddb.py and choose Create.
  6. Complete the following steps to create a job:
    • Provide a name, such as load_ops_table_configs_to_ddb.
    • For IAM role, choose load_ops_table_configs_to_ddb_glue_role.
    • Set Data processing units to 1/16 DPU.
    • Under Job parameters, add the following parameters
      • batch_config_ddb_table_name = odpf_batch_config
      • raw_table_config_ddb_table_name = odpf_demo_taxi_trips_raw
      • aws_region = e.g., us-west-1
    • Choose Save.
  7. On the Actions menu, run the job.
  8. On the DynamoDB console, get the item count from the tables. You will find 1 item in the odpf_batch_config table and 18 items in the odpf_demo_taxi_trips_raw table.

Set up a database in AWS Glue

Complete the following steps to create a database:

  1. On the AWS Glue console, under Data catalog in the navigation pane, choose Databases.
  2. Create a database called odpf_demo_taxi_trips_raw.

Set up AWS DMS for CDC

Complete the following steps to set up AWS DMS for CDC:

  1. Create an AWS DMS replication instance. For Instance class, choose dms.t3.medium.
  2. Create a source endpoint for Amazon RDS for MySQL.
  3. Create target endpoint for Amazon S3. To configure the S3 endpoint settings, use the JSON definition from dms_s3_endpoint_setting.json.
  4. Create an AWS DMS task.
    • Use the source and target endpoints created in the previous steps.
    • To create AWS DMS task mapping rules, use the JSON definition from dms_task_mapping_rules.json.
    • Under Migration task startup configuration, select Automatically on create.
  5. When the AWS DMS task starts running, you will see a task summary similar to the following screenshot.
    DMS Task Summary
  6. In the Table statistics section, you will see an output similar to the following screenshot. Here, the Full load rows and Total rows columns are important metrics whose counts should match with the record volumes of the 18 tables in the operational data source.
    DMS Task Statistics
  7. As a result of successful full load completion, you will find Parquet files in the S3 staging bucket—one Parquet file per table in a dedicated folder, similar to the following screenshot. Similarly, you will find 17 such folders in the bucket.
    DMS Output in S3 Staging Bucket for Table 1

File Manager output

The File Manager Lambda function consumes messages from the SQS queue, extracts metadata for the CDC files, and inserts one item per file to the odpf_file_tracker DynamoDB table. When you check the items, you will find 18 items with file_ingestion_status set to raw_file_landed, as shown in the following screenshot.

CDC Files in File Tracker DynamoDB Table

File Processor output

  1. On the subsequent tenth minute (since the activation of the EventBridge rule), the event rule triggers the File Processor state machine. On the Step Functions console, you will notice that the state machine is invoked, as shown in the following screenshot.
    File Processor State Machine Run Summary
  2. As shown in the following screenshot, the Batch Generator Lambda function creates four batches and constructs a Map state for parallel running of the File Processor Trigger Lambda function.
    File Processor State Machine Run Details
  3. Then, the File Processor Trigger Lambda function runs the File Processor Glue Job, as shown in the following screenshot.
    File Processor Glue Job Parallel Runs
  4. Then, you will notice that the File Processor Glue Job runs create source-aligned datasets in Hudi format in the S3 raw bucket. For Table 1, you will see an output similar to the following screenshot. There will be 17 such folders in the S3 raw bucket.
    Data in S3 raw bucket
  5. Finally, in AWS Glue Data Catalog, you will notice 18 tables created in the odpf_demo_taxi_trips_raw database, similar to the following screenshot.
    Tables in Glue Database

Data validation

Complete the following steps to validate the data:

  1. On the Amazon Athena console, open the query editor, and select a workgroup or create a new workgroup.
  2. Choose AwsDataCatalog for Data source and odpf_demo_taxi_trips_raw for Database.
  3. Run the raw_data_validation_query_athena.sql SQL query. You will get an output similar to the following screenshot.
    Raw Data Validation via Amazon Athena

Validation summary: The counts in Amazon Athena match with the counts of the operational tables and it proves that the ODP framework has processed all the files and records successfully. This concludes the demo. To test additional scenarios, refer to Extended Testing in the code repo.

Outcomes

Let’s review how the ODP framework addressed the aforementioned requirements.

  1. As discussed earlier in this post, by logically grouping tables by refresh cadence and associating them to EventBridge rules, we ensured that the source-aligned tables are refreshed by the File Processor AWS Glue jobs. With the AWS Glue worker type configuration setting, we selected the appropriate compute resources while running the AWS Glue jobs (the instances of the AWS Glue job).
  2. By applying table-specific configurations (from odpf_batch_config and odpf_raw_table_config) dynamically, we were able to use one AWS Glue job to process CDC files for 18 tables.
  3. You can use this framework to support a variety of data migration use cases that require quicker data migration from on-premises storage systems to data lakes or analytics platforms on AWS. You can reuse File Manager as is and customize File Processor to work with other storage frameworks such as Apache Iceberg, Delta Lake, and purpose-built data stores such as Amazon Aurora and Amazon Redshift.
  4. To understand how the ODP framework met the company’s disaster recovery (DR) design criterion, we first need to understand the DR architecture strategy at a high level. The DR architecture strategy has the following aspects:
    • One AWS account and two AWS Regions are used for primary and secondary environments.
    • The data lake infrastructure in the secondary Region is kept in sync with the one in the primary Region.
    • Data is stored in S3 buckets, metadata data is stored in the AWS Glue Data Catalog, and access controls in Lake Formation are replicated from the primary to secondary Region.
    • The data lake source and target systems have their respective DR environments.
    • CI/CD tooling (version control, CI server, and so on) are to be made highly available.
    • The DevOps team needs to be able to deploy CI/CD pipelines of analytics frameworks (such as this ODP framework) to either the primary or secondary Region.
    • As you can imagine, disaster recovery on AWS is a vast subject, so we keep our discussion to the last design aspect.

By designing the ODP framework with three components and externalizing operational table configurations to DynamoDB global tables, the company was able to deploy the framework components to the secondary Region (in the rare event of a single-Region failure) and continue to process CDC files from the point it last processed in the primary Region. Because the CDC file tracking and processing audit data is replicated to the DynamoDB replica tables in the secondary Region, the File Manager microservice and File Processor can seamlessly run.

Clean up

When you’re finished testing this framework, you can delete the provisioned AWS resources to avoid any further charges.

Conclusion

In this post, we took a real-world operational data processing use case and presented you the framework we developed at AWS ProServe. We hope this post and the operational data processing framework using AWS Glue and Apache Hudi will expedite your journey in integrating operational databases into your modern data platforms built on AWS.


About the authors

Ravi-IthaRavi Itha is a Principal Consultant at AWS Professional Services with specialization in data and analytics and generalist background in application development. Ravi helps customers with enterprise data strategy initiatives across insurance, airlines, pharmaceutical, and financial services industries. In his 6-year tenure at Amazon, Ravi has helped the AWS builder community by publishing approximately 15 open-source solutions (accessible via GitHub handle), four blogs, and reference architectures. Outside of work, he is passionate about reading India Knowledge Systems and practicing Yoga Asanas.

srinivas-kandiSrinivas Kandi is a Data Architect at AWS Professional Services. He leads customer engagements related to data lakes, analytics, and data warehouse modernizations. He enjoys reading history and civilizations.

How Vercel Shipped Cron Jobs in 2 Months Using Amazon EventBridge Scheduler

Post Syndicated from Marcia Villalba original https://aws.amazon.com/blogs/aws/how-vercel-shipped-cron-jobs-in-2-months-using-amazon-eventbridge-scheduler/

Vercel implemented Cron Jobs using Amazon EventBridge Scheduler, enabling their customers to create, manage, and run scheduled tasks at scale. The adoption of this feature was rapid, reaching over 7 million weekly cron invocations within a few months of release. This article shows how they did it and how they handle the massive scale they’re experiencing.

Vercel builds a front-end cloud that makes it easier for engineers to deploy and run their front-end applications. With more than 100 million deployments in Vercel in the last two years, Vercel helps users take advantage of best-in-class AWS infrastructure with zero configuration by relying heavily on serverless technology. Vercel provides a lot of features that help developers host their front-end applications. However, until the beginning of this year, they hadn’t built Cron Jobs yet.

A cron job is a scheduled task that automates running specific commands or scripts at predetermined intervals or fixed times. It enables users to set up regular, repetitive actions, such as backups, sending notification emails to customers, or processing payments when a subscription needs to be renewed. Cron jobs are widely used in computing environments to improve efficiency and automate routine operations, and they were a commonly requested feature from Vercel’s customers.

In December 2022, Vercel hosted an internal hackathon to foster innovation. That’s where Vincent Voyer and Andreas Schneider joined forces to build a prototype cron job feature for the Vercel platform. They formed a team of five people and worked on the feature for a week. The team worked on different tasks, from building a user interface to display the cron jobs to creating the backend implementation of the feature.

Amazon EventBridge Scheduler
When the hackathon team started thinking about solving the cron job problem, their first idea was to use Amazon EventBridge rules that run on a schedule. However, they realized quickly that this feature has a limit of 300 rules per account per AWS Region, which wasn’t enough for their intended use. Luckily, one of the team members had read the announcement of Amazon EventBridge Scheduler in the AWS Compute blog and they thought this would be a perfect tool for their problem.

By using EventBridge Scheduler, they could schedule one-time or recurrently millions of tasks across over 270 AWS services without provisioning or managing the underlying infrastructure.

How cron jobs work

For creating a new cron job in Vercel, a customer needs to define the frequency in which this task will run and the API they want to invoke. Vercel, in the backend, uses EventBridge Scheduler and creates a new schedule when a new cron job is created.

To call the endpoint, the team used an AWS Lambda function that receives the path that needs to be invoked as input parameters.

How cron jobs works

When the time comes for the cron job to run, EventBridge Scheduler invokes the function, which then calls the customer website endpoint that was configured.

By the end of the week, Vincent and his team had a working prototype version of the cron jobs feature, and they won a prize at the hackathon.

Building Vercel Cron Jobs
After working for one week on this prototype in December, the hackathon ended, and Vincent and his team returned to their regular jobs. In early January 2023, Vicent and the Vercel team decided to take the project and turn it into a real product.

During the hackathon, the team built the fundamental parts of the feature, but there were some details that they needed to polish to make it production ready. Vincent and Andreas worked on the feature, and in less than two months, on February 22, 2023, they announced Vercel Cron Jobs to the public. The announcement tweet got over 400 thousand views, and the community loved the launch.

Tweet from Vercel announcing cron jobs

The adoption of this feature was very rapid. Within a few months of launching Cron Jobs, Vercel reached over 7 million cron invocations per week, and they expect the adoption to continue growing.

Cron jobs adoption

How Vercel Cron Jobs Handles Scale
With this pace of adoption, scaling this feature is crucial for Vercel. In order to scale the amount of cron invocations at this pace, they had to make some business and architectural decisions.

From the business perspective, they defined limits for their free-tier customers. Free-tier customers can create a maximum of two cron jobs in their account, and they can only have hourly schedules. This means that free customers cannot run a cron job every 30 minutes; instead, they can do it at most every hour. Only customers on Vercel paid tiers can take advantage of EventBridge Scheduler minute granularity for scheduling tasks.

Also, for free customers, minute precision isn’t guaranteed. To achieve this, Vincent took advantage of the time window configuration from EventBridge Scheduler. The flexible time window configuration allows you to start a schedule within a window of time. This means that the scheduled tasks are dispersed across the time window to reduce the impact of multiple requests on downstream services. This is very useful if, for example, many customers want to run their jobs at midnight. By using the flexible time window, the load can spread across a set window of time.

From the architectural perspective, Vercel took advantage of hosting the APIs and owning the functions that the cron jobs invoke.

Validating the calls

This means that when the Lambda function is started by EventBridge Scheduler, the function ends its run without waiting for a response from the API. Then Vercel validates if the cron job ran by checking if the API and Vercel function ran correctly from its observability mechanisms. In this way, the function duration is very short, less than 400 milliseconds. This allows Vercel to run a lot of functions per second without affecting their concurrency limits.

Lambda invocations and duration dashboard

What Was The Impact?
Vercel’s implementation of Cron Jobs is an excellent example of what serverless technologies enable. In two months, with two people working full time, they were able to launch a feature that their community needed and enthusiastically adopted. This feature shows the completeness of Vercel’s platform and is an important feature to convince their customers to move to a paid account.

If you want to get started with EventBridge Scheduler, see Serverless Land patterns for EventBridge Scheduler, where you’ll find a broad range of examples to help you.

Marcia

Implementing the transactional outbox pattern with Amazon EventBridge Pipes

Post Syndicated from James Beswick original https://aws.amazon.com/blogs/compute/implementing-the-transactional-outbox-pattern-with-amazon-eventbridge-pipes/

This post is written by Sayan Moitra, Associate Solutions Architect, and Sangram Sonawane, Senior Solutions Architect.

Microservice architecture is an architectural style that structures an application as a collection of loosely coupled and independently deployable services. Services must communicate with each other to exchange messages and perform business operations. Ensuring message reliability while maintaining loose coupling between services is crucial for building robust and scalable systems.

This blog demonstrates how to use Amazon DynamoDB, a fully managed serverless key-value NoSQL database, and Amazon EventBridge, a managed serverless event bus, to implement reliable messaging for microservices using the transactional outbox pattern.

Business operations can span across multiple systems or databases to maintain consistency and synchronization between them. One approach often used in distributed systems or architectures where data must be replicated across multiple locations or components is dual writes. In a dual write scenario, when a write operation is performed on one system or database, the same data or event also triggers another system in real-time or near real-time. This ensures that both systems always have the same data, minimizing data inconsistencies.

Dual writes can also introduce data integrity challenges in distributed systems. Failure to update the database or to send events to other downstream systems after an initial system update can lead to data loss and leave the application in an inconsistent state. One design approach to overcome this challenge is to combine dual writes with the transactional outbox pattern.

Challenges with dual writes

Consider an online food ordering application to illustrate the challenges with dual writes. Once the user submits the order, the order service updates the order status in a persistent data store. The order status update should also be sent to notify_restaurant and order_tracking services using a message bus for asynchronous communication. After successfully updating the order status in the database, the order service writes the event to the message bus. The order_service performs a dual write operation of updating the database and publishing the event details on the message bus for other services to read.

This approach works until there are issues encountered in publishing the event to the message bus. Publishing events can fail for multiple reasons like a network error or a message bus outage. When failure occurs, the notify_restaurant and order_tracking service will not be notified of the order update event, leaving the system in an inconsistent state. Implementing the transactional outbox pattern with dual writes can help ensure reliable messaging between systems after a database update.

This illustration shows a sequence diagram for an online food ordering application and the challenges with dual writes:

Sequence diagram

Overview of the transactional outbox pattern

In the transactional outbox pattern, a second persistent data store is introduced to store the outgoing messages. In the online food order example, updating the database with order details and storing the event information in the outbox table becomes a single atomic transaction.

The transaction is only successful when writing to both the database and the outbox table. Any failures to write to the outbox table rolls back the transaction. A separate process then reads the event from the outbox table and publishes the event on the message bus. Once the message is available on the message bus, it can be read by the notify_restaurant and order_tracking services. Combining transactional outbox pattern with dual writes allows for data consistency across systems and reliable message delivery with the transactional context.

The following illustration shows a sequence diagram for an online food ordering application with transactional outbox pattern for reliable message delivery.

Sequence diagram 2

Implementing the transaction outbox pattern

DynamoDB includes a feature called DynamoDB Streams to capture a time-ordered sequence of item-level modifications in the DynamoDB table and stores this information in a log for up to 24 hours. Applications can access this log and view the data items as they appeared before and after they were modified, in near real time.

Whenever an application creates, updates, or deletes items in the table, DynamoDB Streams writes a stream record with the primary key attributes of the items that were modified. A stream record contains information about a data modification to a single item in a DynamoDB table. DynamoDB Streams writes stream records in near real time and these can be consumed for processing based on the contents. Enabling this feature removes the need to maintain a separate outbox table and lowers the management and operational overhead.

EventBridge Pipes connects event producers to consumers with options to transform, filter, and enrich messages. EventBridge Pipes can integrate with DynamoDB Streams to capture table events without writing any code. There is no need to write and maintain a separate process to read from the stream. EventBridge Pipes also supports retries, and any failed events can be routed to a dead-letter queue (DLQ) for further analysis and reprocessing.

EventBridge polls shards in DynamoDB stream for records and invokes pipes as soon as records are available. You can configure this to read records from DynamoDB only when it has gathered a specified batch size or the batch window expires. Pipes maintains the order of records from the data stream when sending that data to the destination. You can optionally filter or enhance these records before sending them to a target for processing.

Example overview

The following diagram illustrates the implementation of transactional outbox pattern with DynamoDB Streams and EventBridge Pipe. Amazon API Gateway is used to trigger a DynamoDB operation via a POST request. The change in the DynamoDB triggers an EventBridge event bus via Amazon EventBridge Pipes. This event bus invokes the Lambda functions through an SQS Queue, depending on the filters applied.

Architecture overview

  1. In this sample implementation, Amazon API Gateway makes a POST call to the DynamoDB table for database updates. Amazon API Gateway supports CRUD operations for Amazon DynamoDB without the need of a compute layer for database calls.
  2. DynamoDB Streams is enabled on the table, which captures a time-ordered sequence of item-level modifications in the DynamoDB table in near real time.
  3. EventBridge Pipes integrates with DynamoDB Streams to capture the events and can optionally filter and enrich the data before it is sent to a supported target. In this example, events are sent to Amazon EventBridge, which acts as a message bus. This can be replaced with any of the supported targets as detailed in Amazon EventBridge Pipes targets. DLQ can be configured to handle any failed events, which can be analyzed and retried.
  4. Consumers listening to the event bus receive messages. You can optionally fan out and deliver the events to multiple consumers and apply filters. You can configure a DLQ to handle any failures and retries.

Prerequisites

  1. AWS SAM CLI, version 1.85.0 or higher
  2. Python 3.10

Deploying the example application

  1. Clone the repository:
    git clone https://github.com/aws-samples/amazon-eventbridge-pipes-dynamodb-stream-transactional-outbox.git
  2. Change to the root directory of the project and run the following AWS SAM CLI commands:
    cd amazon-eventbridge-pipes-dynamodb-stream-transactional-outbox               
    sam build
    sam deploy --guided
    
  3. Enter the name for your stack during guided deployment. During the deploy process, select the default option for all the additional steps.
    SAM deployment
  4. The resources are deployed.
    Testing the application

Testing the application

Once the deployment is complete, it provides the API Gateway URL in the output. You can test using that URL. To test the application, use Postman to make a POST call to API Gateway prod URL:

Postman

You can also test using the curl command:

curl -s --header "Content-Type: application/json" \
  --request POST \
  --data '{"Status":"Created"}' \
  <API_ENDPOINT>

This produces the following output:

Expected output

To verify if the order details are updated in the DynamoDB table, run this command for performing a scan operation on the table.

aws dynamodb scan \
    --table-name <DynamoDB Table Name>

Handling failures

DynamoDB Streams captures a time-ordered sequence of item-level modifications in the DynamoDB table and stores this information in a log for up to 24 hours. If EventBridge is unavailable to read from DynamoDB Stream due to misconfiguration, for example, the records are available in the log for 24 hours. Once EventBridge is reintegrated, it retrieves all undelivered records from the last 24 hours. For integration issues between EventBridge Pipes and the target application, all failed messages can be sent to the DLQ for reprocessing at a later time.

Cleaning up

To clean up your AWS based resources, run following AWS SAM CLI command, answering “y” to all questions:

sam delete --stack-name <stack_name>

Conclusion

Reliable interservice communication is an important consideration in microservice design, especially when faced with dual writes. Combining the transactional outbox pattern with dual writes provides a robust way of improving message reliability.

This blog demonstrates an architecture pattern to tackle the challenge of dual writes by combining it with the transactional outbox pattern using DynamoDB and EventBridge Pipes. This solution provides a no-code approach with AWS Managed Services, reducing management and operational overhead.

For more serverless learning resources, visit Serverless Land.

Implementing automatic drift detection in CDK Pipelines using Amazon EventBridge

Post Syndicated from DAMODAR SHENVI WAGLE original https://aws.amazon.com/blogs/devops/implementing-automatic-drift-detection-in-cdk-pipelines-using-amazon-eventbridge/

The AWS Cloud Development Kit (AWS CDK) is a popular open source toolkit that allows developers to create their cloud infrastructure using high level programming languages. AWS CDK comes bundled with a construct called CDK Pipelines that makes it easy to set up continuous integration, delivery, and deployment with AWS CodePipeline. The CDK Pipelines construct does all the heavy lifting, such as setting up appropriate AWS IAM roles for deployment across regions and accounts, Amazon Simple Storage Service (Amazon S3) buckets to store build artifacts, and an AWS CodeBuild project to build, test, and deploy the app. The pipeline deploys a given CDK application as one or more AWS CloudFormation stacks.

With CloudFormation stacks, there is the possibility that someone can manually change the configuration of stack resources outside the purview of CloudFormation and the pipeline that deploys the stack. This causes the deployed resources to be inconsistent with the intent in the application, which is referred to as “drift”, a situation that can make the application’s behavior unpredictable. For example, when troubleshooting an application, if the application has drifted in production, it is difficult to reproduce the same behavior in a development environment. In other cases, it may introduce security vulnerabilities in the application. For example, an AWS EC2 SecurityGroup that was originally deployed to allow ingress traffic from a specific IP address might potentially be opened up to allow traffic from all IP addresses.

CloudFormation offers a drift detection feature for stacks and stack resources to detect configuration changes that are made outside of CloudFormation. The stack/resource is considered as drifted if its configuration does not match the expected configuration defined in the CloudFormation template and by extension the CDK code that synthesized it.

In this blog post you will see how CloudFormation drift detection can be integrated as a pre-deployment validation step in CDK Pipelines using an event driven approach.

Services and frameworks used in the post include CloudFormation, CodeBuild, Amazon EventBridge, AWS Lambda, Amazon DynamoDB, S3, and AWS CDK.

Solution overview

Amazon EventBridge is a serverless AWS service that offers an agile mechanism for the developers to spin up loosely coupled, event driven applications at scale. EventBridge supports routing of events between services via an event bus. EventBridge out of the box supports a default event bus for each account which receives events from AWS services. Last year, CloudFormation added a new feature that enables event notifications for changes made to CloudFormation-based stacks and resources. These notifications are accessible through Amazon EventBridge, allowing users to monitor and react to changes in their CloudFormation infrastructure using event-driven workflows. Our solution leverages the drift detection events that are now supported by EventBridge. The following architecture diagram depicts the flow of events involved in successfully performing drift detection in CDK Pipelines.

Architecture diagram

Architecture diagram

The user starts the pipeline by checking code into an AWS CodeCommit repo, which acts as the pipeline source. We have configured drift detection in the pipeline as a custom step backed by a lambda function. When the drift detection step invokes the provider lambda function, it first starts the drift detection on the CloudFormation stack Demo Stack and then saves the drift_detection_id along with pipeline_job_id in a DynamoDB table. In the meantime, the pipeline waits for a response on the status of drift detection.

The EventBridge rules are set up to capture the drift detection state change events for Demo Stack that are received by the default event bus. The callback lambda is registered as the intended target for the rules. When drift detection completes, it triggers the EventBridge rule which in turn invokes the callback lambda function with stack status as either DRIFTED or IN SYNC. The callback lambda function pulls the pipeline_job_id from DynamoDB and sends the appropriate status back to the pipeline, thus propelling the pipeline out of the wait state. If the stack is in the IN SYNC status, the callback lambda sends a success status and the pipeline continues with the deployment. If the stack is in the DRIFTED status, callback lambda sends failure status back to the pipeline and the pipeline run ends up in failure.

Solution Deep Dive

The solution deploys two stacks as shown in the above architecture diagram

  1. CDK Pipelines stack
  2. Pre-requisite stack

The CDK Pipelines stack defines a pipeline with a CodeCommit source and drift detection step integrated into it. The pre-requisite stack deploys following resources that are required by the CDK Pipelines stack.

  • A Lambda function that implements drift detection step
  • A DynamoDB table that holds drift_detection_id and pipeline_job_id
  • An Event bridge rule to capture “CloudFormation Drift Detection Status Change” event
  • A callback lambda function that evaluates status of drift detection and sends status back to the pipeline by looking up the data captured in DynamoDB.

The pre-requisites stack is deployed first, followed by the CDK Pipelines stack.

Defining drift detection step

CDK Pipelines offers a mechanism to define your own step that requires custom implementation. A step corresponds to a custom action in CodePipeline such as invoke lambda function. It can exist as a pre or post deployment action in a given stage of the pipeline. For example, your organization’s policies may require its CI/CD pipelines to run a security vulnerability scan as a prerequisite before deployment. You can build this as a custom step in your CDK Pipelines. In this post, you will use the same mechanism for adding the drift detection step in the pipeline.

You start by defining a class called DriftDetectionStep that extends Step and implements ICodePipelineActionFactory as shown in the following code snippet. The constructor accepts 3 parameters stackName, account, region as inputs. When the pipeline runs the step, it invokes the drift detection lambda function with these parameters wrapped inside userParameters variable. The function produceAction() adds the action to invoke drift detection lambda function to the pipeline stage.

Please note that the solution uses an SSM parameter to inject the lambda function ARN into the pipeline stack. So, we deploy the provider lambda function as part of pre-requisites stack before the pipeline stack and publish its ARN to the SSM parameter. The CDK code to deploy pre-requisites stack can be found here.

export class DriftDetectionStep
    extends Step
    implements pipelines.ICodePipelineActionFactory
{
    constructor(
        private readonly stackName: string,
        private readonly account: string,
        private readonly region: string
    ) {
        super(`DriftDetectionStep-${stackName}`);
    }

    public produceAction(
        stage: codepipeline.IStage,
        options: ProduceActionOptions
    ): CodePipelineActionFactoryResult {
        // Define the configuraton for the action that is added to the pipeline.
        stage.addAction(
            new cpactions.LambdaInvokeAction({
                actionName: options.actionName,
                runOrder: options.runOrder,
                lambda: lambda.Function.fromFunctionArn(
                    options.scope,
                    `InitiateDriftDetectLambda-${this.stackName}`,
                    ssm.StringParameter.valueForStringParameter(
                        options.scope,
                        SSM_PARAM_DRIFT_DETECT_LAMBDA_ARN
                    )
                ),
                // These are the parameters passed to the drift detection step implementaton provider lambda
                userParameters: {
                    stackName: this.stackName,
                    account: this.account,
                    region: this.region,
                },
            })
        );
        return {
            runOrdersConsumed: 1,
        };
    }
}

Configuring drift detection step in CDK Pipelines

Here you will see how to integrate the previously defined drift detection step into CDK Pipelines. The pipeline has a stage called DemoStage as shown in the following code snippet. During the construction of DemoStage, we declare drift detection as the pre-deployment step. This makes sure that the pipeline always does the drift detection check prior to deployment.

Please note that for every stack defined in the stage; we add a dedicated step to perform drift detection by instantiating the class DriftDetectionStep detailed in the prior section. Thus, this solution scales with the number of stacks defined per stage.

export class PipelineStack extends BaseStack {
    constructor(scope: Construct, id: string, props?: StackProps) {
        super(scope, id, props);

        const repo = new codecommit.Repository(this, 'DemoRepo', {
            repositoryName: `${this.node.tryGetContext('appName')}-repo`,
        });

        const pipeline = new CodePipeline(this, 'DemoPipeline', {
            synth: new ShellStep('synth', {
                input: CodePipelineSource.codeCommit(repo, 'main'),
                commands: ['./script-synth.sh'],
            }),
            crossAccountKeys: true,
            enableKeyRotation: true,
        });
        const demoStage = new DemoStage(this, 'DemoStage', {
            env: {
                account: this.account,
                region: this.region,
            },
        });
        const driftDetectionSteps: Step[] = [];
        for (const stackName of demoStage.stackNameList) {
            const step = new DriftDetectionStep(stackName, this.account, this.region);
            driftDetectionSteps.push(step);
        }
        pipeline.addStage(demoStage, {
            pre: driftDetectionSteps,
        });

Demo

Here you will go through the deployment steps for the solution and see drift detection in action.

Deploy the pre-requisites stack

Clone the repo from the GitHub location here. Navigate to the cloned folder and run script script-deploy.sh You can find detailed instructions in README.md

Deploy the CDK Pipelines stack

Clone the repo from the GitHub location here. Navigate to the cloned folder and run script script-deploy.sh. This deploys a pipeline with an empty CodeCommit repo as the source. The pipeline run ends up in failure, as shown below, because of the empty CodeCommit repo.

First run of the pipeline

Next, check in the code from the cloned repo into the CodeCommit source repo. You can find detailed instructions on that in README.md  This triggers the pipeline and pipeline finishes successfully, as shown below.

Pipeline run after first check in

The pipeline deploys two stacks DemoStackA and DemoStackB. Each of these stacks creates an S3 bucket.

CloudFormation stacks deployed after first run of the pipeline

Demonstrate drift detection

Locate the S3 bucket created by DemoStackA under resources, navigate to the S3 bucket and modify the tag aws-cdk:auto-delete-objects from true to false as shown below

DemoStackA resources

DemoStackA modify S3 tag

Now, go to the pipeline and trigger a new execution by clicking on Release Change

Run pipeline via Release Change tab

The pipeline run will now end in failure at the pre-deployment drift detection step.

Pipeline run after Drift Detection failure

Cleanup

Please follow the steps below to clean up all the stacks.

  1. Navigate to S3 console and empty the buckets created by stacks DemoStackA and DemoStackB.
  2. Navigate to the CloudFormation console and delete stacks DemoStackA and DemoStackB, since deleting CDK Pipelines stack does not delete the application stacks that the pipeline deploys.
  3. Delete the CDK Pipelines stack cdk-drift-detect-demo-pipeline
  4. Delete the pre-requisites stack cdk-drift-detect-demo-drift-detection-prereq

Conclusion

In this post, I showed how to add a custom implementation step in CDK Pipelines. I also used that mechanism to integrate a drift detection check as a pre-deployment step. This allows us to validate the integrity of a CloudFormation Stack before its deployment. Since the validation is integrated into the pipeline, it is easier to manage the solution in one place as part of the overarching pipeline. Give the solution a try, and then see if you can incorporate it into your organization’s delivery pipelines.

About the author:

Damodar Shenvi Wagle

Damodar Shenvi Wagle is a Senior Cloud Application Architect at AWS Professional Services. His areas of expertise include architecting serverless solutions, CI/CD, and automation.