Tag Archives: Best practices

Beyond IAM access keys: Modern authentication approaches for AWS

Post Syndicated from Mitch Beaumont original https://aws.amazon.com/blogs/security/beyond-iam-access-keys-modern-authentication-approaches-for-aws/

When it comes to AWS authentication, relying on long-term credentials, such as AWS Identity and Access Management (IAM) access keys, introduces unnecessary risks; including potential credential exposure, unauthorized sharing, or theft. In this post, I present five common use cases where AWS customers traditionally use IAM access keys and present more secure alternatives that you should consider.

AWS CLI access: Embrace CloudShell

If you’re primarily using access keys for AWS Command Line Interface (AWS CLI) access, consider AWS CloudShell—a browser-based CLI that minimizes the need for local credential management while providing the same powerful CLI capabilities that you’re accustomed to.

AWS CLI with enhanced security: IAM Identity Center

If you need a more robust solution, AWS CLI v2 combined with AWS IAM Identity Center offers a superior authentication approach. This integration enables:

  • Centralized user management
  • Seamless multi-factor authentication (MFA) integration
  • Enhanced security controls

Configuration is straightforward using the AWS CLI documentation, and MFA can be enabled following the IAM Identity Center MFA guide.

Local development: IDE integration

For developers working in local environments, modern integrated development environments (IDEs) such as Visual Studio Code, with AWS Toolkit support offer secure authentication through IAM Identity Center. This alleviates the need for static access keys while maintaining a smooth development experience. Learn more about AWS IDE integrations.

AWS compute services and CI/CD access

When your applications and automation pipelines need AWS resource access, whether running on AWS compute services (Amazon Elastic Compute Cloud (Amazon EC2), Amazon Elastic Container Service (Amazon ECS), or AWS Lambda) or through continuous integration and delivery (CI/CD) tools, IAM roles can provide the ideal solution. These roles automatically manage temporary credential rotation and follow security best practices.

  • For AWS compute services: Use standard IAM roles with your compute resources. Review the EC2 IAM roles documentation for implementation details.
  • For AWS-hosted CI/CD: When using AWS CodePipeline or AWS CodeBuild for example, use service-linked roles to manage permissions securely.
  • For CI/CD tools self-hosted on Amazon EC2: If you’re running tools such as Jenkins or GitLab on AWS resources, use the instance profile roles the same as you would with other compute services.

For third-party CI/CD services (such as GitHub Actions, CircleCI, and so on), see External access requirements.

External access requirements

For scenarios involving third-party applications or on-premises workloads, AWS offers three methods:

  • Third-party applications: Implement temporary security credentials through IAM roles instead of static access keys. Never use root account access keys. See third-party access documentation.
  • On-premises workloads: Use AWS IAM Roles Anywhere to generate temporary credentials for non-AWS workloads. For more information, see Access for non AWS workloads.
  • CI/CD software as a service (SaaS): For cloud-based CI/CD services, use OpenID Connect (OIDC) integration with IAM roles to minimize the need for long-term credentials. This allows your CI/CD pipelines to obtain temporary credentials through trust relationships. See the AWS OIDC provider documentation for implementation details.

Best practice: Principle of least privilege

Regardless of your authentication method, always implement the principle of least privilege. This helps make sure that users and applications have only the permissions they need. For guidance on crafting precise IAM policies, see Techniques for writing least privilege IAM policies.

Note: AWS also offers policy generation based on AWS CloudTrail logs, helping you create permission templates based on actual usage patterns. Learn about this feature in the IAM policy generation documentation.

Conclusion

As you’ve seen, there are numerous secure alternatives to IAM access keys that you can use to enhance your AWS authentication strategy while reducing security risks. By using tools such as CloudShell, IAM Identity Center, IDE integrations, IAM roles, and IAM Roles Anywhere, you can implement robust authentication mechanisms that align with modern security best practices.Key takeaways:

  • Prefer temporary credentials over long-term access keys
  • Choose the authentication method that best fits your use case
  • Implement the principle of least privilege across all access methods
  • Take advantage of the built-in tools provided by AWS for policy generation and management
  • Regularly review and update your authentication methods as new solutions become available

By making these changes, you can not only improve your security posture but also streamline your authentication processes across your AWS environment. Start small by identifying your current IAM access key use cases and gradually transition to these more secure alternatives. Your future self—and your security team—will thank you.

If you have feedback about this post, submit comments in the Comments section below.

Mitch Beaumont

Mitch Beaumont

Mitch is a Principal Solutions Architect for Amazon Web Services based in Sydney, Australia. Mitch works with some of Australia’s largest financial services customers, helping them to continually raise the security bar for the products and features that they build and ship. Outside of work, Mitch enjoys spending time with his family, photography, and surfing.

Implement monitoring for Amazon EKS with managed services

Post Syndicated from Aritra Nag original https://aws.amazon.com/blogs/architecture/implement-monitoring-for-amazon-eks-with-managed-services/

In this post, we show you how to implement comprehensive monitoring for Amazon Elastic Kubernetes Service (Amazon EKS) workloads using AWS managed services. Amazon EKS offers compelling solutions with EKS Auto Mode and AWS Fargate, each designed for different use cases. This solution demonstrates building an EKS platform that combines flexible compute options with enterprise-grade observability using AWS native services and OpenTelemetry.

Modern containerized environments require observability that goes beyond basic CPU and memory metrics. Our approach addresses three critical challenges: reducing compute management complexity, closing observability gaps, and enabling metrics-driven automatic scaling that responds to real application demand rather than infrastructure utilization alone.

Architecture components

Amazon Managed Service for Prometheus is a fully managed Prometheus-compatible service that alleviates the operational overhead of running Prometheus infrastructure while providing automatic scaling to handle billions of metrics, built-in high availability across multiple Availability Zones, 150 days of metrics retention by default, and native integration with Grafana and other visualization tools.

AWS Distro for OpenTelemetry (ADOT) is a secure, enterprise-grade distribution of OpenTelemetry that provides standardized metrics, traces, and logs collection, native AWS service integration, automatic instrumentation for popular frameworks, and efficient data processing and export.

Amazon CloudWatch is a centralized logging and monitoring service offering structured log aggregation and search, custom metrics and alarms, integration with AWS services, and long-term log retention and analysis.

Solution overview

This section outlines the comprehensive monitoring solution architecture and its key components. We explore how the different AWS services work together to provide complete observability for your Amazon EKS workloads.

Our solution addresses key challenges through a comprehensive observability pipeline using Amazon Managed Service for Prometheus, AWS X-Ray, and Amazon CloudWatch; real metrics-based automatic scaling using custom Prometheus metrics instead of basic resource utilization; and cost optimization through strategic virtual private cloud (VPC) endpoints and compute mode selection.

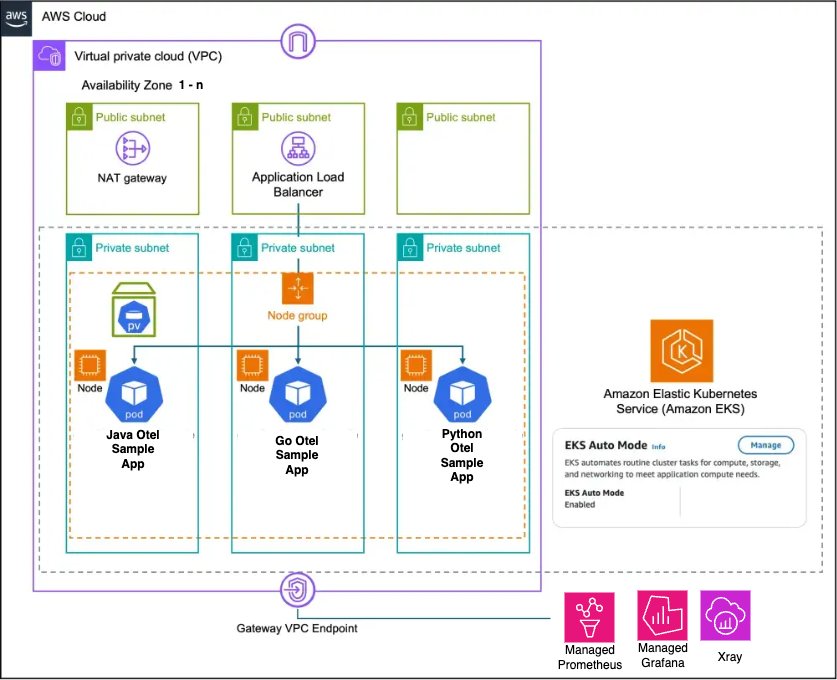
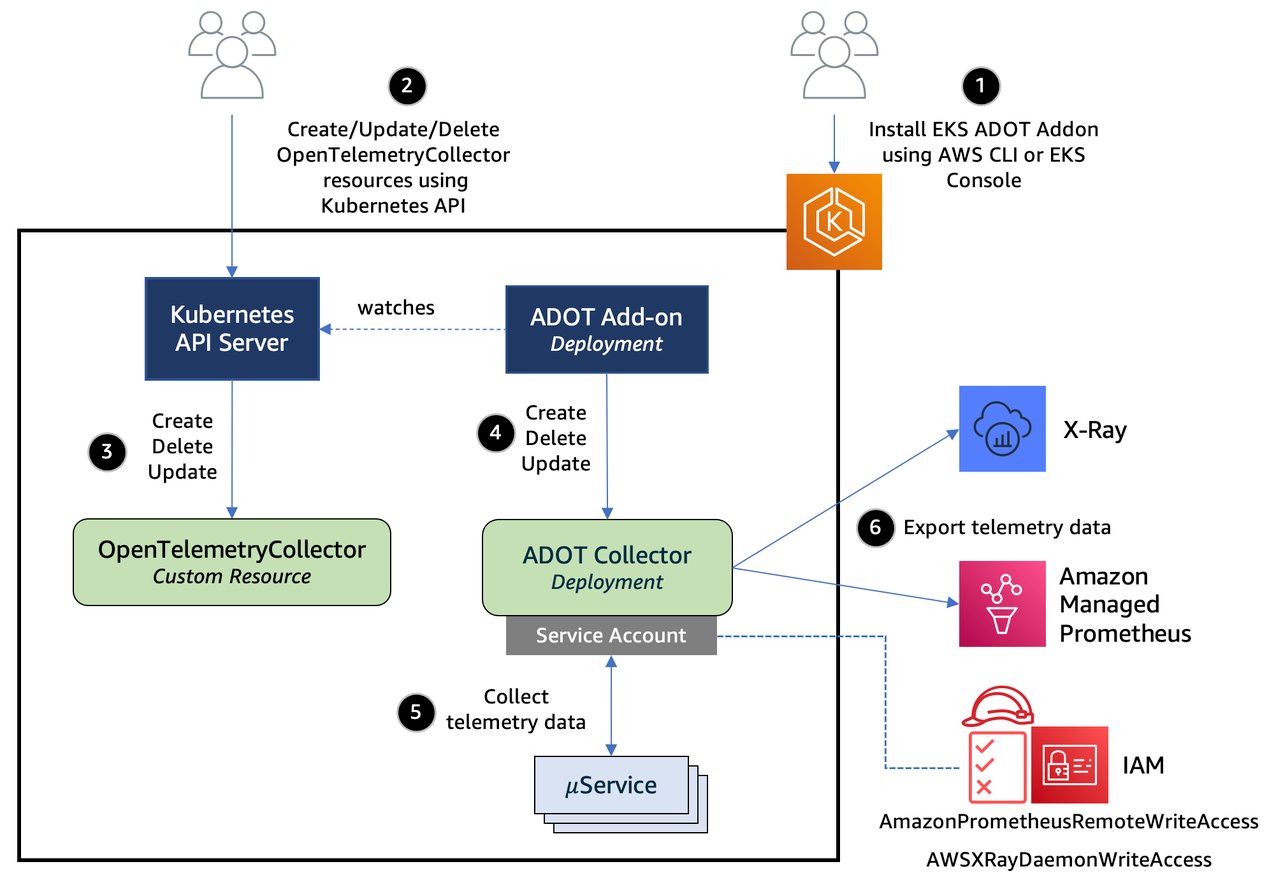
The architecture showcases a Kubernetes environment with two distinct compute modes, each optimized for different use cases. EKS Auto Mode represents AWS’s latest approach to managed Kubernetes compute. It eliminates the need for node management by removing the requirement to configure node groups or instance types. The platform automatically scales compute resources based on your actual workload demands, ensuring you pay only for the resources your applications consume. It comes with integrated services including automatic configuration of VPC CNI, EBS CSI driver, and load balancer integration, making it ideal for general workloads and cost-optimized deployments. The Amazon EKS Auto Mode architecture (shown in the following diagram) provides zero node management with automatic scaling based on workload demands. This mode includes integrated networking, storage, and load balancing capabilities, making it ideal for general workloads and cost-optimized deployments.

Amazon EKS Auto Mode Architecture

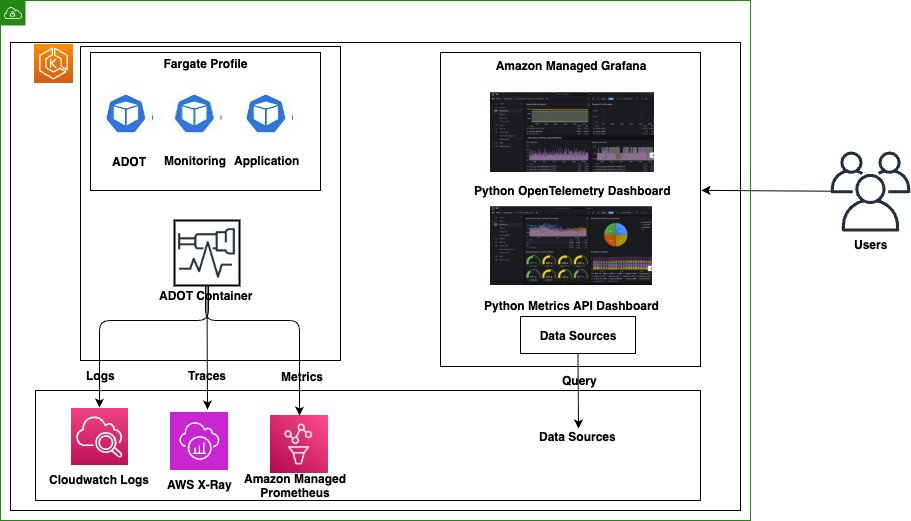
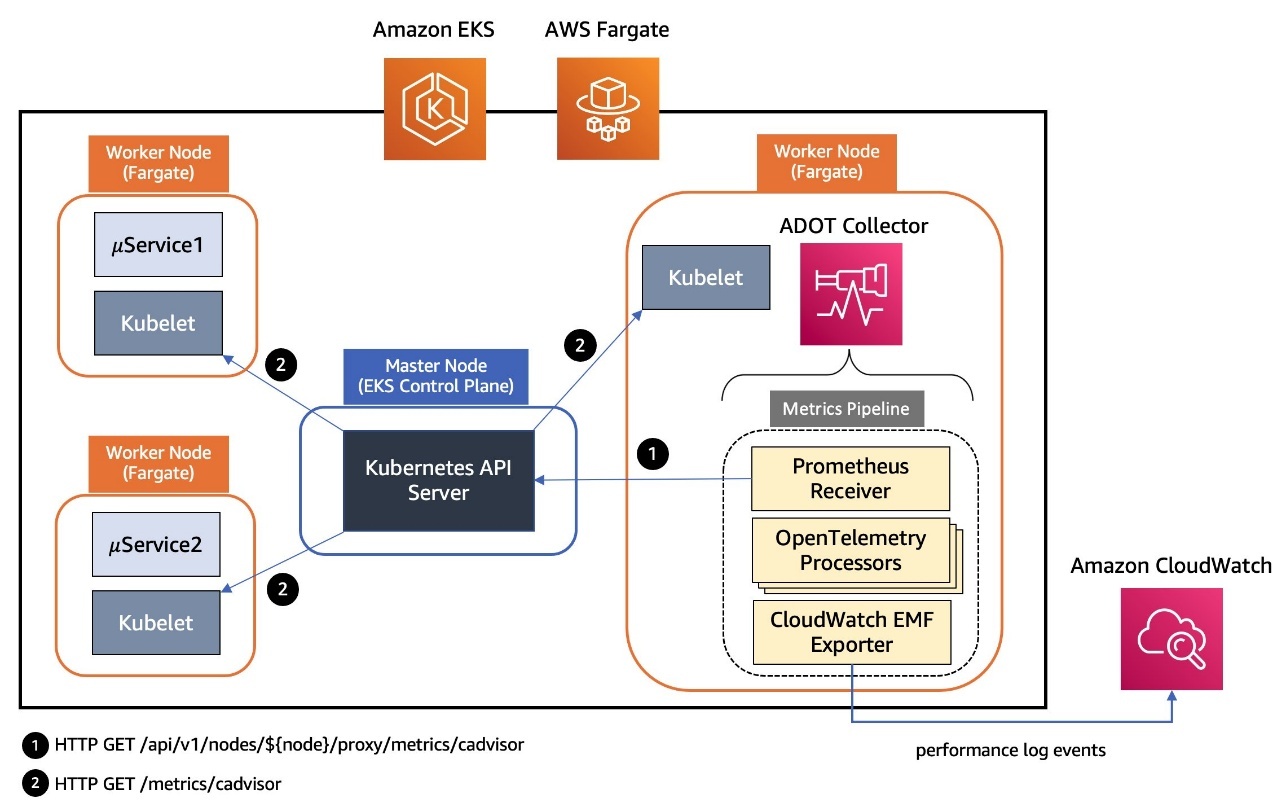
AWS Fargate takes a different approach by providing true serverless container execution. With Fargate, you don’t need to manage any Amazon EC2 instances, as each pod runs in its own isolated compute environment. This isolation extends to billing, where costs are tracked at the individual pod level, providing granular control over your expenses. Pods can scale independently without requiring capacity planning, making Fargate particularly well-suited for security-sensitive workloads and applications requiring strict resource isolation.The Amazon EKS Fargate architecture (shown in the following diagram) offers serverless container execution with strong isolation, where each pod runs in its own compute environment. This approach works best for security-sensitive workloads and applications requiring granular cost control.

Amazon EKS Fargate Architecture

The key architectural difference lies in networking and scaling behavior. Auto Mode uses shared node networking with cluster-wide scaling decisions, whereas Fargate provides isolated pod networking with individual pod scaling.

Comprehensive observability pipeline

The following diagram illustrates the workflow of the observability pipeline.

Open Telemetry Collector Agent

The observability architecture implements the three pillars of observability using AWS native services:

  • Metrics collection and storage:
    • Dual collection strategy combining direct Prometheus scraping and OpenTelemetry SDK
    • Local Prometheus server for Horizontal Pod Autoscaler (HPA) metrics and Prometheus Adapter integration
    • Amazon Managed Service for Prometheus for long-term storage and querying
    • Custom metrics exposed through Kubernetes custom metrics API
  • Distributed tracing:
    • OpenTelemetry SDK integration for automatic trace collection
    • AWS Distro for OpenTelemetry (ADOT) collector for data processing
    • AWS X-Ray for trace storage and service map visualization
    • End-to-end transaction monitoring across microservices
  • Centralized logging:
    • OpenTelemetry SDK for structured application logging
    • FluentBit for container log collection
    • CloudWatch Logs with proper retention policies
    • Log correlation with traces and metrics for comprehensive debugging

The below diagram demonstrates a modern cloud-native monitoring solution that collects and analyzes performance data from containerized applications, with data flowing from the Kubernetes workloads through the metrics pipeline to CloudWatch for centralized monitoring and observability.

Amazon EKS Fargate and Auto Mode Telemetry Collection

In the following sections, we walk you through deploying the complete observability stack. We start with the foundational AWS services, then configure the collection agents, and finally instrument your applications.

Prerequisites

Before implementing this solution, you must have the following:

Create the observability stack

The first step to implement the observability stack involves creating the core AWS services that will store and process your observability data using the AWS CDK:

from aws_cdk import (
    Stack,
    aws_logs as logs,
    aws_aps as aps,
    aws_iam as iam,
    RemovalPolicy,
    CfnOutput
)

class ObservabilityStack(Stack):
    def __init__(self, scope: Construct, construct_id: str, **kwargs) -> None:
        super().__init__(scope, construct_id, **kwargs)

       # Create workspace for storing Prometheus metrics
        self.prometheus_workspace = aps.CfnWorkspace(
            self, "AmpWorkspace",
            alias="eks-observability-platform"
        )

        # Create CloudWatch Log Groups for storing Application Logs
        self.app_log_group = logs.LogGroup(
            self, "ApplicationLogGroup",
            log_group_name="/aws/eks/observability/applications",
            removal_policy=RemovalPolicy.DESTROY,
            retention=logs.RetentionDays.ONE_WEEK
        )
        
        # Create Otel Log Group for OpenTelemetry Logs
        self.otel_log_group = logs.LogGroup(
            self, "OtelLogGroup",
            log_group_name="/aws/eks/observability/otel",
            removal_policy=RemovalPolicy.DESTROY,
            retention=logs.RetentionDays.ONE_WEEK
        )

Deploy the infrastructure stack using the following commands:

pip install aws-cdk-lib constructs
cdk deploy ObservabilityStack

Deploy local Prometheus for HPA

This step configures Prometheus for service discovery and remote write to Amazon Managed Service for Prometheus. The local Prometheus instance enables the HPA to access custom metrics:

prometheus_config = {
    "apiVersion": "v1",
    "kind": "ConfigMap",
    "metadata": {
        "name": "prometheus-config",
        "namespace": "monitoring"
    },
    "data": {
        "prometheus.yml": f"""
global:
  scrape_interval: 15s
  evaluation_interval: 15s

remote_write:
  - url: https://aps-workspaces.{region}.amazonaws.com/workspaces/{workspace_id}/api/v1/remote_write
    queue_config:
      max_samples_per_send: 1000
      max_shards: 200
      capacity: 2500
    sigv4:
      region: {region}

scrape_configs:
  - job_name: 'kubernetes-pods'
    kubernetes_sd_configs:
      - role: pod
    relabel_configs:
      - source_labels: [__meta_kubernetes_pod_annotation_prometheus_io_scrape]
        action: keep
        regex: true
      - source_labels: [__meta_kubernetes_pod_annotation_prometheus_io_path]
        action: replace
        target_label: __metrics_path__
        regex: (.+)
      - source_labels: [__address__, __meta_kubernetes_pod_annotation_prometheus_io_port]
        action: replace
        regex: ([^:]+)(?::\d+)?;(\d+)
        replacement: $1:$2
        target_label: __address__
"""
    }
}

Apply the configuration to your cluster:

kubectl apply -f prometheus-config.yaml

Configure the ADOT Collector

Deploy the ADOT Collector with proper AWS service integration. This collector processes telemetry data from your applications and exports it to AWS services:

apiVersion: opentelemetry.io/v1alpha1
kind: OpenTelemetryCollector
metadata:
  name: otel-collector
  namespace: opentelemetry
spec:
  config: |
    receivers:
      otlp:
        protocols:
          grpc:
            endpoint: 0.0.0.0:4317
          http:
            endpoint: 0.0.0.0:4318
      prometheus:
        config:
          scrape_configs:
            - job_name: 'kubernetes-pods'
              kubernetes_sd_configs:
                - role: pod

    processors:
      batch:
        timeout: 1s
        send_batch_size: 1024
      resource:
        attributes:
          - key: ClusterName
            value: ${CLUSTER_NAME}
            action: upsert

    exporters:
      awsxray:
        region: ${AWS_REGION}
      awscloudwatchlogs:
        region: ${AWS_REGION}
        log_group_name: "/aws/eks/observability/otel"
      prometheusremotewrite:
        endpoint: https://aps-workspaces.${AWS_REGION}.amazonaws.com/workspaces/${PROMETHEUS_WORKSPACE_ID}/api/v1/remote_write
        auth:
          authenticator: sigv4auth

    extensions:
      sigv4auth:
        region: ${AWS_REGION}

    service:
      extensions: [sigv4auth]
      pipelines:
        traces:
          receivers: [otlp]
          processors: [resource, batch]
          exporters: [awsxray]
        metrics:
          receivers: [otlp, prometheus]
          processors: [resource, batch]
          exporters: [prometheusremotewrite]
        logs:
          receivers: [otlp]
          processors: [resource, batch]
          exporters: [awscloudwatchlogs]

Deploy the collector:

kubectl apply -f adot-collector.yaml

Instrument your applications

This section shows how to instrument your applications to emit telemetry data. We cover both Python and Java applications.

Instrument a Python Flask application

The following code demonstrates how to add OpenTelemetry instrumentation to a Python Flask application:

from opentelemetry import trace, metrics
from opentelemetry.sdk.trace import TracerProvider
from opentelemetry.sdk.metrics import MeterProvider
from opentelemetry.sdk.resources import Resource
from opentelemetry.exporter.otlp.proto.grpc.trace_exporter import OTLPSpanExporter
from opentelemetry.exporter.otlp.proto.grpc.metric_exporter import OTLPMetricExporter
from opentelemetry.sdk.trace.export import BatchSpanProcessor
from opentelemetry.sdk.metrics.export import PeriodicExportingMetricReader

# Configure OpenTelemetry
resource = Resource.create({
    "service.name": "flask-app",
    "service.version": "1.0.0",
    "deployment.environment": "production"
})

# Setup tracing
trace_provider = TracerProvider(resource=resource)
otlp_trace_exporter = OTLPSpanExporter(endpoint="http://otel-collector.opentelemetry:4317")
trace_provider.add_span_processor(BatchSpanProcessor(otlp_trace_exporter))
trace.set_tracer_provider(trace_provider)
tracer = trace.get_tracer(__name__)

# Setup metrics
metric_provider = MeterProvider(resource=resource)
otlp_metric_exporter = OTLPMetricExporter(endpoint="http://otel-collector.opentelemetry:4317")
metric_provider.add_metric_reader(PeriodicExportingMetricReader(otlp_metric_exporter))
metrics.set_meter_provider(metric_provider)
meter = metrics.get_meter(__name__)

# Create application metrics
request_counter = meter.create_counter(
    name="http_requests_total",
    description="Total HTTP requests",
    unit="1"
)

@app.route('/api/users')
def users():
    with tracer.start_as_current_span("get_users") as span:
        span.set_attribute("endpoint", "api_users")
        # Record metrics
        request_counter.add(1, {"endpoint": "api_users", "status": "success"})
        return jsonify({"users": ["user1", "user2", "user3"]})

Instrument a Java application

For Java applications using Spring Boot, add the following instrumentation:

@RestController
public class ApiController {
    private final Counter httpRequestsTotal;

    public ApiController(MeterRegistry meterRegistry) {
        this.httpRequestsTotal = Counter.builder("http_requests_total")
            .description("Total HTTP requests")
            .register(meterRegistry);
    }

    @GetMapping("/api/users")
    public Map<String, Object> getUsers() {
        httpRequestsTotal.increment();
        Map<String, Object> response = new HashMap<>();
        response.put("users", Arrays.asList("user1", "user2", "user3"));
        return response;
    }
}

Build and deploy your instrumented applications to the EKS cluster with the appropriate annotations for Prometheus scraping.

Configure the Prometheus Adapter for custom metrics

The Prometheus Adapter exposes custom metrics from Prometheus to the Kubernetes custom metrics API, enabling the HPA to use application-specific metrics:

prometheus_adapter_config = """
rules:
- seriesQuery: 'http_requests_total{app="flask-app"}'
  resources:
    overrides:
      kubernetes_namespace: {resource: "namespace"}
      kubernetes_pod_name: {resource: "pod"}
  name:
    as: "flask_app_requests_rate"
  metricsQuery: 'rate(http_requests_total{app="flask-app",<<.LabelMatchers>>}[1m]) * 60'
"""

# Deploy Prometheus Adapter
prometheus_adapter_deployment = {
    "apiVersion": "apps/v1",
    "kind": "Deployment",
    "metadata": {
        "name": "prometheus-adapter",
        "namespace": "monitoring"
    },
    "spec": {
        "replicas": 1,
        "selector": {"matchLabels": {"app": "prometheus-adapter"}},
        "template": {
            "metadata": {"labels": {"app": "prometheus-adapter"}},
            "spec": {
                "containers": [{
                    "name": "prometheus-adapter",
                    "image": "k8s.gcr.io/prometheus-adapter/prometheus-adapter:v0.12.0",
                    "args": [
                        "--prometheus-url=http://prometheus-service.monitoring:9090",
                        "--config=/etc/adapter/config.yaml"
                    ]
                }]
            }
        }
    }
}

Deploy the Prometheus Adapter:

kubectl apply -f prometheus-adapter.yaml

Configure HPAs with custom metrics

Create HPAs that use custom metrics instead of basic resource utilization:

apiVersion: autoscaling/v2
kind: HorizontalPodAutoscaler
metadata:
  name: flask-app-hpa
  namespace: default
spec:
  scaleTargetRef:
    apiVersion: apps/v1
    kind: Deployment
    name: flask-app
  minReplicas: 2
  maxReplicas: 10
  metrics:
  - type: Pods
    pods:
      metric:
        name: flask_app_requests_rate
      target:
        type: AverageValue
        averageValue: "10"
  behavior:
    scaleUp:
      stabilizationWindowSeconds: 60
      policies:
      - type: Percent
        value: 100
        periodSeconds: 15
    scaleDown:
      stabilizationWindowSeconds: 300
      policies:
      - type: Percent
        value: 10
        periodSeconds: 60

Apply the HPA configuration:

kubectl apply -f hpa-custom-metrics.yaml

Monitoring and visualization

After implementing this solution, you can create custom dashboards in Amazon Managed Grafana to monitor the following:

  • Application performance metrics
  • Request rates and latencies
  • Resource utilization
  • Error rates

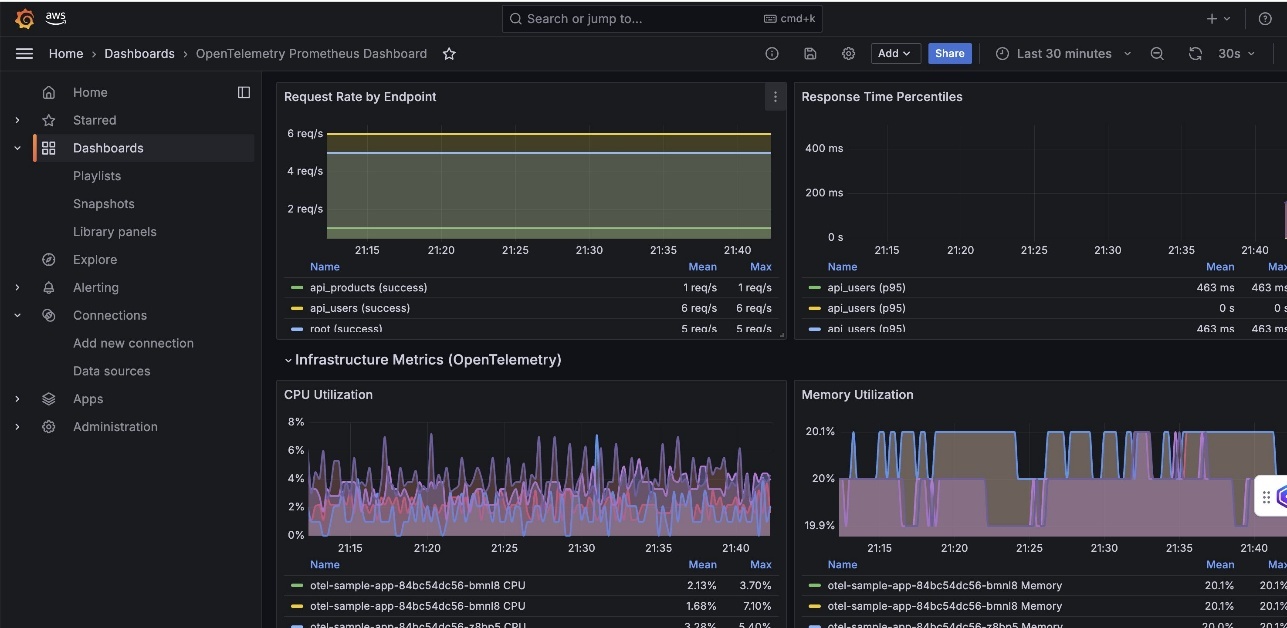
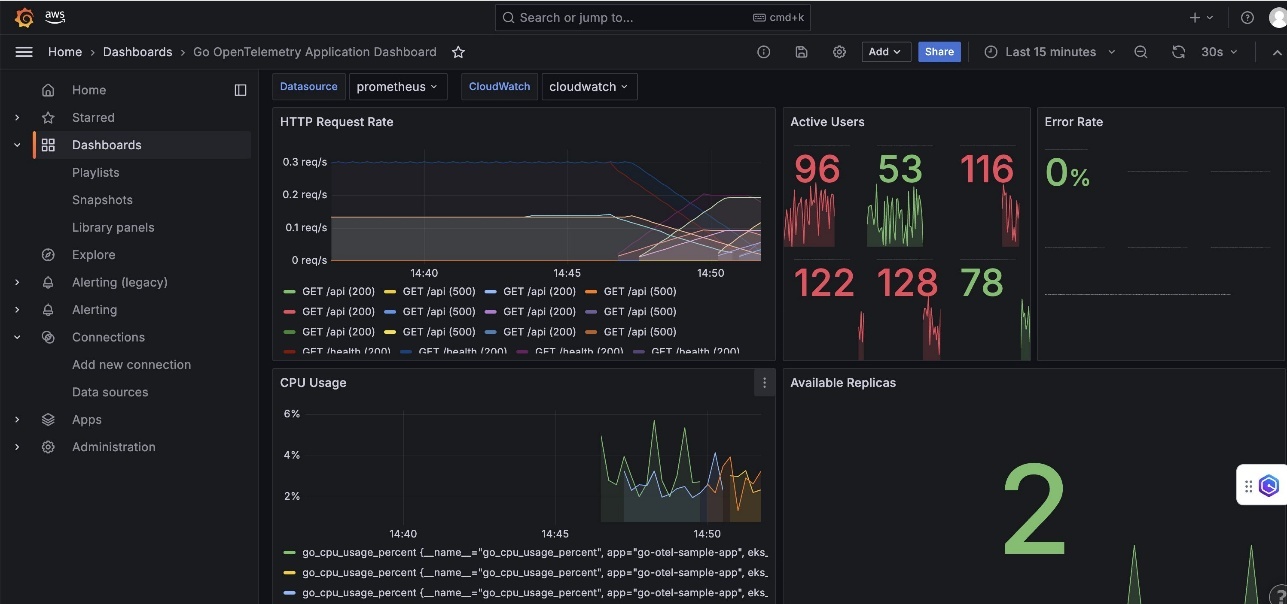
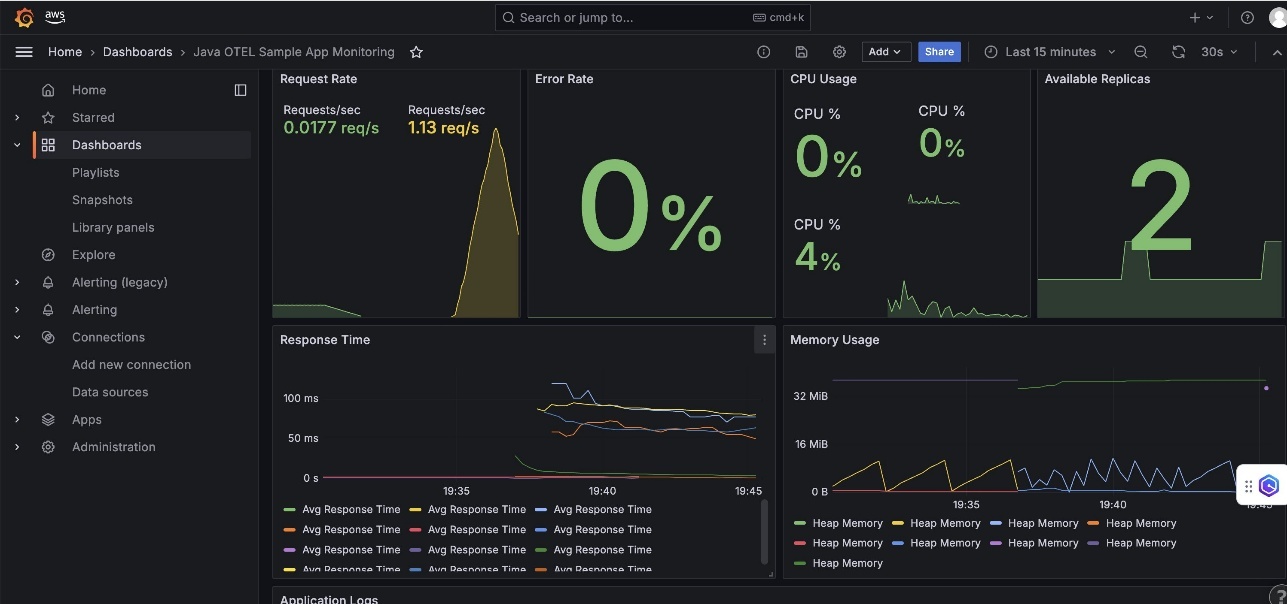
For dashboard examples and templates, refer to the Amazon Managed Grafana documentation. The following screenshots are examples of some of the dashboards you can build:

  • OpenTelemetry Prometheus Dashboard – This dashboard displays Python application performance with request rate by endpoints, response time percentiles (P50, P95, P99), CPU utilization trends, memory usage patterns, and error rates segmented by HTTP status codes.

Python App OpenTelemetry Prometheus Dashboard

  • Go OpenTelemetry Application Dashboard – This dashboard focuses on Go-specific metrics including HTTP request rate, active concurrent users, goroutine counts, CPU usage, and memory allocation patterns with garbage collection insights.

Go App OpenTelemetry Prometheus Dashboard

  • Java OTEL Sample App Monitoring – This dashboard shows JVM-specific metrics like heap memory utilization, alongside application-level metrics such as requests per second, garbage collection insights, and thread pool utilization.

Java App OpenTelemetry Prometheus Dashboard

The dashboards enable real-time application performance monitoring, infrastructure resource utilization tracking, error rate monitoring and alerting, and automatic scaling visualization and trends.

Best practices and recommendations

Choose Amazon EKS Auto Mode for the following use cases and features:

  • You’re building general-purpose applications that benefit from cost optimization and operational simplicity
  • You’re managing mixed workload types and want to use integrated AWS service features
  • Teams want to avoid the complexity of node management
  • Cost-efficiency and ease of operations are priorities for production workloads

Choose Amazon EKS with Fargate in the following scenarios:

  • Security isolation is paramount for your applications
  • You’re running batch or event-driven workloads that require strong container isolation
  • Your organization requires granular cost attribution at the pod level
  • Compliance mandates dictate complete container isolation from the underlying infrastructure

For your observability strategy, consider the following monitoring approach:

  • Use business metrics for HPA scaling decisions
  • Implement proper metric labeling for filtering and aggregation
  • Monitor both application and infrastructure metrics
  • Set up alerting based on Service Level Indicator (SLI) and Service Level Objective (SLO) definitions

Additionally, implement the following tracing approach:

  • Instrument critical code paths with OpenTelemetry
  • Use consistent trace context propagation
  • Monitor service dependencies through AWS X-Ray service maps
  • Implement proper error handling and trace sampling

Benefits of the solution

Instead of relying on basic CPU and memory metrics, this solution configures the Prometheus Adapter to expose custom metrics to the Kubernetes HPA. The HPA configuration shown in this post enables more intelligent scaling decisions based on actual application load, resulting in better resource efficiency and improved application performance. This approach allows your applications to scale based on business-relevant metrics such as request rate, queue length, or custom application metrics rather than generic infrastructure utilization. This solution offers reduced management overhead through the following features:

  • Fully managed – Amazon Managed Service for Prometheus eliminates infrastructure management
  • Automatic scaling – Built-in high availability and scaling
  • Integrated security – Native IAM integration
  • Cost-effective – Pay only for metrics ingested and stored

You also benefit from enhanced observability:

  • Three pillars – Complete metrics, traces, and logs coverage
  • Real-time monitoring – Custom metrics for intelligent automatic scaling
  • Correlation – Trace IDs link logs, metrics, and traces
  • Business metrics – Scale based on application behavior, not just infrastructure

Troubleshooting

If the ADOT Collector isn’t receiving data, troubleshoot as follows:

  • Verify the collector service is running: $ kubectl get pods -n opentelemetry
  • Check application configuration for correct endpoint URLs
  • Verify IAM roles have proper permissions for AWS services

If the custom metrics aren’t available in the HPA, check the following:

  • Confirm the Prometheus Adapter is deployed and running
  • Verify metrics are being scraped by Prometheus: $ kubectl port-forward svc/prometheus 9090:9090
  • Check the Prometheus Adapter configuration for correct metric queries

Deployment cost considerations

In this section, we provide an estimate of the cost that will incur with the preceding solutions:

  • Amazon Managed Service for Prometheus – $0.90 per million samples ingested + $0.03 per GB-month storage
  • AWS X-Ray – $5.00 per million traces recorded
  • Amazon CloudWatch Logs – $0.50 per GB ingested + $0.03 per GB-month storage
  • Amazon EKS – $73/month control plane + compute costs (Auto Mode/Fargate variable)

For a medium-scale application (5 microservices, 2 million samples/hour, 100,000 traces/day, 10 GB logs/day), the costs are as follows:|

Service Cost
Amazon Managed Prometheus ~$80
AWS X-Ray ~$45
CloudWatch Logs ~$165
EKS Control Plane ~$73
Compute costs ~$200-400
Total ~$563-763/month

Costs are estimates based on US East (N. Virginia) pricing as of 2025 and might vary based on AWS Region, usage patterns, and AWS pricing changes. Consider the following cost optimization methods:

  • Sampling – Implement intelligent sampling for high-cardinality metrics
  • Retention – Set appropriate log retention (7–30 days for debug logs)
  • Monitoring – Use CloudWatch billing alarms to track spending
  • Regional – Deploy in single Region to minimize data transfer costs

Clean up

To avoid ongoing charges, delete the resources created in this walkthrough:

  1. Remove IAM roles and policies created for this solution through the IAM console or AWS CLI.
  2. Delete the AWS CDK stack:
cdk destroy ObservabilityStack

Conclusion

This solution demonstrates how organizations can achieve enterprise-grade Kubernetes deployments that balance flexibility, observability, and cost optimization. By combining Amazon EKS Auto Mode or Fargate with comprehensive AWS native observability services, teams can focus on application development while maintaining deep visibility into system performance. The real metrics-based automatic scaling approach represents a significant improvement over traditional resource-based scaling, enabling more intelligent infrastructure decisions that align with actual application behavior. Combined with the flexible compute options and modular architecture, this platform provides a robust foundation for modern containerized applications at scale. Key takeaways include:

  • Use AWS managed services – Reduce operational overhead with Amazon Managed Service for Prometheus and CloudWatch
  • Implement OpenTelemetry – Standardize observability across all applications
  • Custom metrics for HPA – Scale based on business metrics, not just CPU/memory
  • Structured logging – Enable better debugging and correlation
  • Security first – Implement proper IAM roles and network isolation

Organizations implementing this solution can expect reduced operational complexity, improved cost-efficiency, and enhanced visibility into their containerized applications, enabling faster development cycles and more reliable production deployments.


About the author

Perform per-project cost allocation in Amazon SageMaker Unified Studio

Post Syndicated from Enrique Salgado Hernández original https://aws.amazon.com/blogs/big-data/perform-per-project-cost-allocation-in-amazon-sagemaker-unified-studio/

Amazon SageMaker Unified Studio is a single data and AI development environment where you can find and access your data and act on it using AWS resources for SQL analytics, data processing, model development, and generative AI application development.

SageMaker Unified Studio is part of the next generation of Amazon SageMaker. SageMaker brings together AWS artificial intelligence and machine learning (AI/ML) and analytics capabilities and delivers an integrated experience for analytics and AI with unified access to data.

With SageMaker Unified Studio, you can create domains and projects, providing a single interface to build, deploy, execute, and monitor end-to-end workflows. This approach helps drive collaboration across teams and facilitates agile development.

SageMaker Unified Studio implements resource tagging when AWS resources are provisioned. You can use these tags to track and allocate costs for the various resources created as part of the domains and projects within SageMaker Unified Studio.

This post demonstrates how to perform cost allocation using these resource tags, so finance analysts and business analysts can implement and follow Financial Operations (FinOps) best practices to control and track cloud infrastructure costs.

Solution overview

The following diagram illustrates how tagging works within SageMaker domains.

High level diagram that illustrates SageMaker Unified Studio entities (domains, projects and environments) are organized and how tags are applied to each of them

Before reviewing the implementation details, let’s explore several key SageMaker concepts: domain, project, project profile, and environment blueprint. For more information, refer to the SageMaker Unified Studio Administrator Guide.

  • Domain – A domain is an organizing entity created by an administrator. Administrators assign users to domains to enable collaboration using similar tools, assets, and resources. A domain can represent a business organization or a business unit containing people who collaborate and share resources. After creating a domain, administrators share the URL with users to access the portal.
  • Projects – Projects exist within each domain. A project provides a boundary where users can collaborate on a business use case. Users can create and share data, computing, and other resources within projects.
  • Project profile – When you create a project, you must select a project profile. A project profile is a template that governs infrastructure for the project, simplifying project creation with preconfigured settings and resources ready for use.
  • Environment blueprints – Environment blueprints are reusable templates for creating environments. They define settings for resource deployment and provide information for provisioning. Each blueprint uses an AWS CloudFormation template to create resources in a repeatable and scalable manner.

For effective cost tracking and allocation, make sure your SageMaker resources have proper tags. You can configure these as cost allocation tags to group and filter across AWS Billing and Cost Management tools (such as AWS Cost Explorer and AWS Data Exports).

As of this writing, SageMaker domains support tagging at the blueprint, domain, project, and environment level. When you create projects or add resources within an existing project, the following tags are automatically added to resources through CloudFormation resource tags, configured for each blueprint stack:

  • AmazonDataZoneBlueprint – Type of blueprint corresponding to this blueprint’s CloudFormation template (for example, Tooling)
  • AmazonDataZoneDomainAmazon DataZone domain associated with this CloudFormation template
  • AmazonDataZoneEnvironment – Amazon DataZone environment ID associated with this CloudFormation template
  • AmazonDataZoneProject – Amazon DataZone project associated with this CloudFormation template

To track costs in SageMaker Unified Studio, you will perform the following steps:

  1. Create a SageMaker domain and project.
  2. Configure cost and billing settings by enabling cost allocation tags.
  3. (Optional) Generate costs for your project.
  4. Track costs using Cost Explorer and Data Exports.

Prerequisites

This post requires the following configurations in your AWS account:

  • AWS IAM Identity Center enabled in your organization management account (preferred) or in the member account where you will use SageMaker Unified Studio. For instructions on enabling IAM Identity Center, refer to Enable IAM Identity Center.
  • Cost Explorer enabled in your organization management account (preferred) or in the member account where you will use SageMaker Unified Studio. For configuration steps, refer to Enabling Cost Explorer.

Either legacy AWS Cost and Usage Reports (AWS CUR) with Amazon Athena integration or Data Exports configured and integrated with Athena for queries. For setup instructions, refer to creating Data Exports.

Create a SageMaker Unified Studio domain and project

Complete the following steps to set up your domain and project:

  1. Create a SageMaker Unified Studio domain using the Quick setup option (recommended for new users) or manual setup.

After domain creation, you will be redirected to the domain overview page.

  1. Choose Open Unified Studio.
  2. On the SageMaker Unified Studio console, choose Create project.
  3. For Project profile, choose SQL analytics, then choose Continue.

SageMaker Unified Studio create project wokflow (configuration page)

  1. Choose Continue to keep the default blueprint parameters.
  2. Review the configuration summary, then choose Create project.

SageMaker Unified Studio create project wokflow (confirmation page)

After the project is created, you will be redirected to the project overview page. Record the project ID and domain ID.

Project details page showing various details such as project id, project name and project IAM role ARN

Cost and billing configuration

As mentioned earlier, to track costs in SageMaker Unified Studio, you must configure cost allocation tags. Refer to Organizing and tracking costs using AWS cost allocation tags for more information about this feature.
Complete the following steps:

  1. On the AWS Billing and Cost Management console, under Cost organization in the navigation pane, choose Cost allocation tags.
  2. Select the following tags and choose Activate:
    1. AmazonDataZoneDomain
    2. AmazonDataZoneProject
    3. AmazonDataZoneEnvironment
    4. AmazonDataZoneBlueprint

The AmazonDataZoneProject and AmazonDataZoneDomain tags correspond to the project and domain ID values you recorded earlier.

AWS cost allocation tags interface showing the AWS tags that are currently configured as cost allocation tags

Cost allocation tags configuration doesn’t apply retroactively. If you want to monitor costs associated with these tags in the AWS Billing and Cost Management tools before the activation date, you must request a cost allocation tag backfill. The backfill operation can take several hours to complete.

Generate costs for the project

This section explains how to generate costs associated with the underlying data backend (Amazon Redshift in this case) to examine them using AWS billing tools. You can skip this section if you’re tracking costs on an active project.

To generate costs, we use the table structure used in the Redshift Immersion Labs. Refer to Create Tables for more details.

To run queries in SageMaker Unified Studio, follow these steps:

  1. In your project, choose New and then Query.

Image that shows the query button within the SageMaker Unified Studio project overview page allowing users to open the query editor tool

  1. Use the Amazon Redshift Serverless compute configured for the project to generate the costs:
    1. Choose the Redshift (Lakehouse) connection.
    2. Choose the dev database.
    3. Choose the project schema.
    4. Choose Choose.

Image that shows the conection selector available in SageMaker Unified Studio. In this case Redshift LakeHouse connection is selected with dev database and project schema selected underneath

  1. Copy and execute the SQL statements provided in the following GitHub repo into the SageMaker Unified Studio query editor to create, load, and validate data on the tables.

View of the Query editor within the SageMaker Unified Studio portal. Image contains two SQL queries (create tables and COPY data operation)

After running these steps, you will have generated some Amazon Redshift costs that will be present for further analysis in AWS Billing and Cost Management tools. However, these tools (Cost Explorer and Data Exports) are refreshed least one time every 24 hours, so you might need to wait up to 24 hours before proceeding to the next section.

Tracking costs in AWS Billing and Cost Management tools

With the cost allocation tags enabled, you can use AWS Billing and Cost Management tools to analyze and track costs, including Cost Explorer and Data Exports. For more information about using these tools, refer to the AWS Billing and Cost Management User Guide.

Check costs in Cost Explorer

You can check your SageMaker Unified Studio costs using Cost Explorer. With this tool, you can view and analyze your costs and usage through an interface with pre-built filters and aggregation capabilities for various metrics. For more information, refer to the Analyzing your costs and usage with AWS Cost Explorer.

To access Cost Explorer, complete the following steps:

  1. On the AWS Management Console, choose your account name in the top right corner and choose Billing Dashboard, or search for “Cost Explorer” in the console search bar.
  2. On the Billing Dashboard, choose Cost Explorer in the navigation pane.
  3. For first-time users, choose Launch Cost Explorer to enable the service.

AWS can take up to 24 hours to prepare your cost data.

  1. To view overall costs per project, configure the following report parameters:
    1. For Date Range, enter your range.
    2. For Granularity, choose Monthly.
    3. For Dimension, choose Tag.
    4. For Tag, enter your tag (AmazonDataZoneProject).

Image that shows how to group by a particular dimension (tag) in cost explorer

The following screenshot shows a sample report.

AWS cost explorer report showing costs by SageMaker Unified Studio project

  1. To view different service costs for a specific project, update the following parameters:
    1. For Dimension, choose Service.Image that shows how to group by a particular dimension (service) in cost explorer
    2. For Tag¸ choose AmazonDataZoneProject and choose the value of the project you want to inspect (in this case, 4z9d694nbsnyqx).

Image that illustrates how to filter by a specific dimension (tag) and value in cost explorer

The results should look similar to the following screenshot.

AWS cost explorer report showing service costs for a particular SageMaker Unified Studio project

Check costs using Data Exports

With Data Exports, you can query your cost and usage in AWS with the maximum flexibility degree compared to other tools such as Cost Explorer. It provides a comprehensive set of measures and dimensions that you can include in the export to create a personalized report. This report is then delivered to Amazon Simple Storage Service (Amazon S3) so you can configure it with Athena, so it can be queried using SQL or business intelligence (BI) tools such as Amazon QuickSight.

This post assumes you have already configured a data export and you have it integrated with Athena (refer to Processing data exports for more information). For instructions on setting up CUR and Athena integration, refer to Creating reports.

Check costs by project

Use the following query to check costs by project:

SELECT product_servicecode,
    product_product_family,
    resource_tags[ 'user_amazon_data_zone_project' ] as user_amazon_data_zone_project,
    round(sum(line_item_unblended_cost), 2) costs,
    line_item_line_item_description 
FROM "data_exports"."data_exportdata"
where resource_tags [ 'user_amazon_data_zone_project' ] != ''
group by product_product_family,
    product_servicecode,
    resource_tags[ 'user_amazon_data_zone_project' ],
    line_item_line_item_description
order by round(sum(line_item_unblended_cost), 2) DESC;

Results will look similar to the following screenshot on the Athena console.

Athena SQL query results when querying cost and usage data from data exports

The preceding query shows your costs grouped by:

  • Project (using tags)
  • Service
  • Product family, which corresponds to the subtype for a given product usage charge (for example, ML Instance for SageMaker, or Managed Storage for Amazon Redshift)

Check costs for individual projects

To check costs for a specific SageMaker Unified Studio project (for example, the sample project 4z9d694nbsnyqx created during this walkthrough), you can use the following query:

SELECT product_servicecode,
    product_product_family,
    resource_tags[ 'user_amazon_data_zone_project' ] as user_amazon_data_zone_project,
    round(sum(line_item_unblended_cost), 2) costs,
    line_item_line_item_description 
FROM "data_exports"."data_exportdata"
where resource_tags [ 'user_amazon_data_zone_project' ] != ''
and resource_tags [ 'user_amazon_data_zone_project' ] = <provide the project id here>
group by product_product_family,
    product_servicecode,
    resource_tags[ 'user_amazon_data_zone_project' ],
    line_item_line_item_description
order by round(sum(line_item_unblended_cost), 2) DESC;

Monitor costs with Data Exports and QuickSight

If you enabled Athena to work with Data Exports, you can also configure QuickSight to query this data source. With QuickSight, you can create interactive dashboards to track SageMaker costs in SageMaker Unified Studio at scale.

Configure access and permissions

To create CUR dashboards in QuickSight, first complete the following steps:

  1. Subscribe to QuickSight and have an author user account. For instructions on subscribing to QuickSight, refer to Signing up for an Amazon QuickSight subscription.
  2. Enable access to Athena and your CUR S3 bucket in the Security & permissions section of the QuickSight administration console. You need QuickSight administrator permissions to access this console.

Image shows QuickSight administration console where administrators can edit the AWS services (Athena in this case) that QuickSight is allowed to access

  1. If you’re using AWS Lake Formation, make sure your QuickSight user is authorized to query the CUR database and table. For more information about granting access in Lake Formation, refer to Granting permissions on Data Catalog resources.

Create a QuickSight dataset

The next step is to create a dataset in QuickSight using a SQL query. For instructions on creating a dataset with SQL, refer to Using SQL to customize data. Use the following SQL expression:

SELECT product_servicecode,
    product_product_family,
    resource_tags[ 'user_amazon_data_zone_environment' ] as user_amazon_data_zone_environment,
    resource_tags[ 'user_amazon_data_zone_project' ] as user_amazon_data_zone_project,
    resource_tags[ 'user_amazon_data_zone_domain' ] as user_amazon_data_zone_domain,
    line_item_unblended_cost,
    line_item_usage_start_date,
    line_item_line_item_description
FROM "data_exports"."data_exportdata"
where resource_tags [ 'user_amazon_data_zone_environment' ] != '' or resource_tags [ 'user_amazon_data_zone_project' ] != ''

Image of QuickSight dataset preparation page. Shows a SQL query that is used to extract data from the data exports previously configured.

The preceding query includes only cost and usage data that’s tagged with either user_amazon_data_zone_environment or user_amazon_data_zone_project to focus on SageMaker associated costs. To include other AWS costs, you must modify these filters.

Create QuickSight dashboards

Using the authoring capabilities of QuickSight, you can create interactive dashboards where business stakeholders can explore and track costs associated with SageMaker Unified Studio projects. You can use these dashboards to review relevant cost metrics at a glance that are derived from the Data Exports dimensions and metrics included in your dataset, as shown in the following screenshot. For more information about adding visuals to analyses, refer to Adding visuals to Amazon QuickSight analyses.

Example of a QuickSight dashboard consuming data exports cost and usage data. Dashboard contains multiple visuals that illustrate SageMaker Unified Studio costs by project and service

The preceding example shows a dashboard built using QuickSight connected to a Data Exports dataset. The dashboard contains the following visuals:

  • KPI visual showing the current monthly costs for SageMaker Unified Studio along with the month over month (MoM) variation and history
  • Autonarrative visual analyzing SageMaker Unified Studio costs (highest) by month
  • Vertical stacked bar chart showing SageMaker Unified Studio costs by month (grouped by project)
  • Donut chart showing SageMaker Unified Studio cost by service
  • Heat map visual correlating costs by project ID and service

Using this approach (QuickSight and Data Exports), you can create highly customizable dashboards to explore and monitor your SageMaker Unified Studio costs. Furthermore, you can create automated reports using the QuickSight reporting feature to send these by email to the relevant stakeholders.

Clean up

Delete the resources you created as part of this post when you’re done with them to avoid monthly charges. This includes SageMaker resources, created Data Export reports and the QuickSight subscription (in case it was created to visualize costs).

  1. Delete SageMaker resources
    1. Log in to the SageMaker domain using an admin role.
    2. Delete the project you created.
    3. Delete the SageMaker domain.
  2. Delete Data Exports reports
    1. On the AWS Billing console, in the navigation pane, choose Cost & Usage Reports.
    2. Select the report you want to delete.
    3. Choose Delete.
    4. Confirm the deletion by choosing Delete report.

For more information about managing Data Exports, refer to Deleting exports.

  1. Unsubscribe from QuickSight
    1. On the QuickSight console, choose your profile name in the top right corner.
    2. Choose Manage QuickSight.
    3. Choose Account settings.
    4. At the bottom of the page, choose Delete your QuickSight account.
    5. Review the information about data deletion.
    6. Enter delete to confirm.
    7. Choose Delete.

IMPORTANT NOTE: Before unsubscribing, make sure you backed up any dashboards or analyses you want to keep. After deletion, you can’t recover your QuickSight assets. For more information about managing your QuickSight subscription, refer to Deleting your Amazon QuickSight subscription and closing the account.

Conclusion

Managing costs on a unified platform like SageMaker can seem challenging because it aggregates many tools and services with different cost models. In this post, we showed how to use AWS Billing and Cost Management tools to aggregate and categorize costs across the various services used within SageMaker. With this approach, you can monitor and track respective service costs, either in aggregate or focusing on a particular project.

Start taking control of your analytics and ML costs today. With AWS Billing and Cost Management tools with SageMaker, you can:

  • Track and monitor your service costs
  • Break down expenses by project or service
  • Implement efficient back charging mechanisms to the different business units or organizations using SageMaker within your organization

For further reading, refer to Analyzing your costs and usage with AWS Cost Explorer and Processing Data Exports (using Athena).


About the authors

Enrique Salgado Hernández is a Senior Specialist Solutions Architect at AWS with more than 10 years of experience working in the cloud. He specializes in designing and implementing large-scale analytics architectures across various industry sectors. He is passionate about working with customers to solve their problems by supporting them during their cloud journey.

Angel Conde Manjon is a Senior EMEA Data & AI PSA, based in Madrid. He previously worked on research related to data analytics and AI in diverse European research projects. In his current role, Angel helps partners develop businesses centered on data and AI.

How Stifel built a modern data platform using AWS Glue and an event-driven domain architecture

Post Syndicated from Amit Maindola original https://aws.amazon.com/blogs/big-data/how-stifel-built-a-modern-data-platform-using-aws-glue-and-an-event-driven-domain-architecture/

Stifel Financial Corp. is an American multinational independent investment bank and financial services company, founded in 1890 and headquartered in downtown St. Louis, Missouri. Stifel offers securities-related financial services in the United States and Europe through several wholly owned subsidiaries. Stifel provides both equity and fixed income research and is the largest provider of US equity research.

In this post, we show you how Stifel implemented a modern data platform using AWS services and open data standards, building an event-driven architecture for domain data products while centralizing the metadata to facilitate discovery and sharing of data products.

Stifel’s modern data platform use case

Stifel envisioned a data platform that delivers accurate, timely, and properly governed data, providing consistency throughout the organization whenever users access the information. This approach showed limitations as the data complexity increased, data volumes grew, and demand for quick, business-driven insights rose. These challenges are encountered by financial institutions worldwide, leading to a reassessment of traditional data management practices. Under the federated governance model, Stifel developed a modern data strategy based on the following objectives:

  • Managing ingestion and metadata
  • Creating source-aligned data products complying with Stifel business streams
  • Integrating source-aligned data products from other domains (Stifel business units)
  • Producing consumer-aligned data products for specific business purposes
  • Publishing data products to a centralized data catalog

Some of the Stifel challenges highlighted in the preceding list required building a data platform that can:

  • Boost agility by democratizing data, thus reducing time to market and enhancing the customer experience
  • Improve data quality and trust in the data
  • Standardize tools and eliminate the shadow information technology (IT) culture to increase scalability, reduce risk, and minimize operational inefficiencies

Following the federated governance model, Stifel has organized its domain structure to provide autonomy to various functional teams while preserving the core values of data mesh. The following diagram depicts a high-level architecture of the data mesh implementation at Stifel.

Each data domain has the flexibility to create data products that can be published to the centralized catalog, while maintaining the autonomy for teams to develop data products that are exclusively accessible to teams within the domain. These products aren’t available to others until they are deemed ready for broader enterprise use. Domains have the freedom to decide which data they want to share. They can either:

  • Make their data products visible to everyone through the central catalog
  • Keep their data products visible only within their own domain

By implementing an event-driven domain architecture, organizations can achieve significant business advantages while positioning themselves for future growth and innovation. Stifel data products refreshes were dependent on data assets with variable cadence. Event-driven architecture enables real-time or near real-time updates by allowing data products to automatically respond to changes in underlying data assets as they occur, rather than relying on fixed batch schedules that might miss critical updates or waste resources on unnecessary refreshes. The key is to carefully plan the implementation and make sure of alignment with business objectives while considering both technical and organizational factors. This architecture style particularly suits organizations that:

  • Need real-time processing capabilities
  • Have complex domain interactions
  • Require high scalability
  • Want to improve business agility
  • Need better system integration
  • Are pursuing digital transformation

The following are some of the key AWS Services that helped Stifel to build their modern data platform.

  • AWS Glue is a serverless data integration service that’s used for data processing to build data assets and data products in the domains. Data is also cataloged in AWS Glue Catalog, making it straightforward to discover and query with supported engines.
  • Amazon EventBridge provides a scalable and flexible serverless event bus that facilitates seamless communication between different domains and services. By using EventBridge, Stifel was able to implement a publish-subscribe model where domain events can be emitted, filtered, and routed to appropriate consumers based on configurable rules. EventBridge supports custom event buses for domain-specific events, enabling clear separation of concerns and improved manageability.
  • AWS Lake Formation helped in providing centralized security, governance, and catalog capabilities while preserving domain autonomy in data product creation and management. With Lake Formation, data domains were able to maintain their independent data products within a federated structure while enforcing consistent access controls, data quality standards, and metadata management across the organization.
  • Apache Hudi on Amazon Simple Storage Service (Amazon S3) offers an optimized way to store data assets and products and promotes interoperability across other services.

Stifel’s solution architecture

The following diagram illustrates the data mesh architecture that Stifel uses to build a domain-driven architecture. In this system, various domains create data products and share them with other domains through a central governance account that uses Lake Formation.

Let’s look at some of the key design components that are being used to enable and implement data mesh and event driven design

Data ingestion framework

The data ingestion framework consists of several processor modules that are built using several AWS services and metadata driven architecture. The following diagram shows the architecture of the raw data ingestion framework.

The framework gets raw data files from both internal Stifel systems and third-party data sources. These files are processed and stored in a raw data ingestion account on Amazon S3 in open table format Apache Hudi. This stored data is then shared with different parts of the organization, called data domains. Each domain can use this shared data to create their own data products.

As a file (in CSV, XML, JSON and custom formats) lands into the landing bucket, an Amazon S3 event notification is created and placed in an Amazon Simple Queue Service (Amazon SQS)queue. The Amazon SQS queue triggers an AWS Lambda function and saves the metadata (such as the name of the file, date and time the file was received, and the file size) to a file audit data store (Amazon Aurora PostgreSQL-Compatible Edition).

An EventBridge time scheduler invokes an AWS Step Functions workflow at pre-determined intervals. The Step Functions workflow orchestrates the batch ingestion from raw to staging layer.

  1. The Step Functions workflow orchestrates a set of Lambda functions to get the list of unprocessed raw files from the audit data store and create batches of raw files to process them in parallel. The Step Functions workflow then triggers parallel AWS Glue jobs that process each batch of raw files.
  2. Each raw file is validated for any data quality checks and the data is saved to staging tables in Hudi format. Any errors encountered are logged into an audit table and a notification is generated for support team. For all successfully processed raw files, the file status is updated to PROCESSED and logged into an audit table.
  3. After the Hudi table is updated, a data refresh event is sent to EventBridge and then passed to the Central Mesh Account. The Central Mesh Account forwards these events to the data domains to notify them that the raw tables are refreshed, allowing the data domains to use this data for creating their own data products.

Event driven data product refresh

The Stifel data lake is based on a data mesh architecture where several data producers share data across data domains. A mechanism is needed to alert consumers who depend on other data producers’ data products when those source data products are refreshed, so that the consumers can update their own data products accordingly. The following diagram describes the technical architecture of event-based data processing. The central governance account acts as the central event bus, which receives all data refresh events from all data producers. The central event bus forwards the events to consumer accounts. The consumer accounts filter the events consumers are interested in from data producers for their data processing needs.

Orchestration design

Stifel designed and implemented an event-based data pipeline orchestration system that triggers data pipelines when specific events occur. This system processes data immediately after receiving all required dependency events, enabling efficient workflow management.

The following diagram describes the logical architecture of the domain data pipeline orchestration framework.

The orchestration framework includes the components described in the following list. The data dependencies and data pipeline state management metadata are hosted in an Aurora PostgreSQL database.

  1. Data refresh processor: Receives data refresh events from central mesh and local data domain and evaluates if the domain data products data dependencies are met
  2. Data product dependency processor: Retrieves metadata for the product, kicks off a corresponding data domain AWS Glue job, and updates metadata with the job information
  3. Data pipeline state change processor: Monitors the domain data jobs and takes actions based on the job’s final status (SUCCEED or FAILED) and then creates incident tickets for failed jobs

Conclusion

Stifel has improved its data management and reduced data silos by adopting a data product approach. This strategy has positioned Stifel to become a data-driven, customer-centric organization. The company combines federated platform practices with AWS and open standards. As a result, Stifel is achieving its decentralization objectives through a scalable data platform. This platform empowers domain teams to make informed decisions, drive innovation, and maintain a competitive edge. Here are the some of the advantages Stifel got from an event-driven domain architecture (EDDA):

  • Business agility: Rapid market response, new business capability integration, scalable domains, quicker feature deployment, and flexible process modification
  • Customer experience: Real-time processing, responsive interactions, personalized services, consistent omnichannel presence, and enhanced service availability
  • Operational efficiency: Reduced system coupling, optimal resource use, scalable systems, lower maintenance overhead, and efficient data processing
  • Cost benefits: Lower development costs, reduced infrastructure expenses, decreased maintenance costs, efficient resource usage, and a better ROI on technology investments

In this post, we demonstrated how Stifel is building a modern data platform by recognizing the critical importance of data in today’s financial landscape. This strategic approach not only enhances operational efficiency but also positions Stifel at the forefront of technological innovation in the financial services industry. To learn more and get started, see the following resources:


About the authors

Amit Maindola is a Senior Data Architect focused on data engineering, analytics, and AI/ML at Amazon Web Services. He helps customers in their digital transformation journey and enables them to build highly scalable, robust, and secure cloud-based analytical solutions on AWS to gain timely insights and make critical business decisions.

Srinivas Kandi is a Senior Architect at Stifel focusing on delivering the next generation of cloud data platform on AWS. Prior to joining Stifel, Srini was a delivery specialist in cloud data analytics at AWS helping several customers in their transformational journey into AWS cloud. In his free time, Srini likes to explore cooking, travel and learn new trends and innovations in AI and cloud computing.

Hossein Johari is a seasoned data and analytics leader with over 25 years of experience architecting enterprise-scale platforms. As Lead and Senior Architect at Stifel Financial Corp. in St. Louis, Missouri, he spearheads initiatives in Data Platforms and Strategic Solutions, driving the design and implementation of innovative frameworks that support enterprise-wide analytics, strategic decision-making, and digital transformation. Known for aligning technical vision with business objectives, he works closely with cross-functional teams to deliver scalable, forward-looking solutions that advance organizational agility and performance.

Ahmad Rawashdeh is a Senior Architect at Stifel Financial. He supports Stifel and its clients in designing, implementing, and building scalable and reliable data architectures on Amazon Web Services (AWS), with a strong focus on data lake strategies, database services, and efficient data ingestion and transformation pipelines.

Lei Meng is a data architect at Stifel. His focus is working in designing and implementing scalable and secure data solutions on the AWS and helping Stifel’s cloud migration from on-premises systems.

Enhance stability with dedicated cluster manager nodes using Amazon OpenSearch Service

Post Syndicated from Chinmayi Narasimhadevara original https://aws.amazon.com/blogs/big-data/enhance-stability-with-dedicated-cluster-manager-nodes-using-amazon-opensearch-service/

Amazon OpenSearch Service is a managed service that you can use to secure, deploy, and operate OpenSearch clusters at scale in the AWS Cloud. With OpenSearch Service, you can configure clusters with different types of node options such as data nodes, dedicated cluster manager nodes, dedicated coordinator nodes, and UltraWarm nodes. When configuring your OpenSearch Service domain, you can exercise different node options to manage your cluster’s overall stability, performance, and resiliency.

In this post, we show how to enhance the stability of your OpenSearch Service domain with dedicated cluster manager nodes and how using these in deployment enhances your cluster’s stability and reliability.

The benefit of dedicated cluster manager nodes

A dedicated cluster manager node handles the behind-the-scenes work of running an OpenSearch Service cluster, but it doesn’t store actual data or process search requests. In the absence of dedicated cluster manager nodes, OpenSearch Service will use data nodes for cluster management; combining these responsibilities on the data nodes can impact performance and stability because data operations (like indexing and searching) compete with critical cluster management tasks for computing resources. The dedicated cluster manager node is responsible for several key tasks: monitoring and keeping track of all the data nodes in the cluster, knowing how many indexes and shards there are and where they’re located, and routing data to the correct places. They also update and share the cluster state whenever something changes, like creating an index or adding and removing nodes. The problem, however, is that when traffic gets heavy, the cluster manager node can get overloaded and become unresponsive. If this happens, your cluster will not respond to write requests until it elects a new cluster manager, at which point the cycle might repeat itself. You can alleviate this issue by deploying dedicated cluster manager instances, whereby this separation of duties between the manager node and the data nodes results in a much more stable cluster.

Calculating the number of dedicated cluster manager nodes

In OpenSearch Service, a single node is elected as the cluster manager from all eligible nodes through a quorum-based voting process, confirming consensus before taking on the responsibility of coordinating cluster-wide operations and maintaining the cluster’s state. Quorum is the minimum number of nodes that need to agree before the cluster makes important decisions. It helps keep your data consistent and your cluster running smoothly. When you use dedicated cluster manager nodes, only those nodes are eligible for election and OpenSearch Service sets the quorum to half of the nodes, rounded down to the nearest whole number, plus one. One dedicated cluster manager node is explicitly prohibited by OpenSearch Service because you have no backup in the event of a failure. Using three dedicated cluster manager nodes makes sure that even if one node fails, the remaining two can still reach a quorum and maintain cluster operations. We recommend three dedicated cluster manager nodes for production use cases. Multi-AZ with standby is an OpenSearch Service feature designed to deliver four 9s of availability using a third AWS Availability Zone as a standby. When you use Multi-AZ with standby, the service requires three dedicated cluster manager nodes. If you deploy with Multi-AZ without standby or Single-AZ, we still recommend three dedicated cluster manager nodes. It provides two backup nodes in the event of one cluster manager node failure and the necessary quorum (two) to elect a new manager. You can choose three or five dedicated cluster manager nodes.

Having five dedicated cluster manager nodes works as well as three, and you can lose two nodes while maintaining a quorum. But because only one dedicated cluster manager node is active at any given time, this configuration means you pay for four idle nodes.

Cluster manager node configurations for different domain creation methods

This section explains the resources each domain creation method and template deploy when you set up an OpenSearch Service domain.

With the Easy create option, you can quickly create a domain using ‘multi-AZ with standby’ for high availability three-cluster manager nodes distributed across three Availability Zones. The following table summarizes the configuration.

Domain Creation Method Output
Easy Create

Dedicated cluster manager node: Yes

Number of cluster manager nodes: 3

Availability Zones: 3

Standby: Yes

The Standard create option provides templates for ‘Production’ and ‘Dev/test’workloads. Both templates come with a Domain with standby and a Domain without standby deployment choice. The following table summarizes these configuration options.

Domain Creation Method Template Deployment Option Output
Standard Create Production Domain with standby

Requires dedicated cluster manager node

Number of cluster manager nodes: 3

Availability Zones: 3

Standby: Yes

Instance type choice: Yes

Standard create Production Domain without standby

Requires dedicated cluster manager node

Number of cluster manager nodes: 3, 5

Availability Zones: 3

Standby: No

Instance type choice: Yes

Standard Create Dev/test Domain with standby

Requires dedicated cluster manager node

Number of cluster manager nodes: 3

Availability Zones: 3

Standby: Yes

Instance type choice: Yes

Standard create Dev/test Domain without standby Does not require dedicated cluster manager node

Choosing a dedicated cluster manager instance type

Dedicated cluster manager instances typically handle critical cluster operations like shard distribution and index management and track cluster state changes. It’s recommended to select a comparatively smaller instance type. Refer to Choosing instance types for dedicated master nodes for more information on instance types for dedicated cluster manager nodes.

You should expect to occasionally adjust cluster manager instance size and type as your workload evolves over time. As with all scale questions, you need to monitor performance and make sure you have enough CPU and Java virtual machine (JVM) heap for your dedicated cluster managers. We recommend using Amazon CloudWatch alarms to monitor the following CloudWatch metrics, and adjust according to the alarm state:

  • ManagerCPUUtilization – Maximum is greater than or equal to 50% for 15 minutes, three consecutive times
  • ManagerJVMMemoryPressure – Maximum is greater than or equal to 95% for 1 minute, three consecutive times

Conclusion

Dedicated cluster manager nodes provide added stability and protection against split-brain situations, can be of a different instance type than data nodes, and are an obvious benefit when OpenSearch Service is backing mission-critical applications for production workloads. They are typically not required for development workloads like proof of concept because the cost of running a dedicated cluster manager node exceeds the tangible benefits of keeping the cluster up and running. To learn more about OpenSearch best practices, see link.


About the authors

Imtiaz (Taz) Sayed is the WW Tech Leader for Analytics at AWS. He enjoys engaging with the community on all things data and analytics. He can be reached through LinkedIn.

Chinmayi Narasimhadevara is a Senior Solutions Architect focused on Data Analytics and AI at AWS. She helps customers build advanced, highly scalable, and performant solutions.

Remote access to AWS: A guide for hybrid workforces

Post Syndicated from Itay Meller original https://aws.amazon.com/blogs/security/remote-access-to-aws-a-guide-for-hybrid-workforces/

Amazon Web Services (AWS) customers can enable secure remote access to their cloud resources, supporting business operations with both speed and agility. As organizations embrace flexible work environments, employees can safely connect to AWS resources from various locations using different devices. AWS provides comprehensive security solutions that help organizations maintain strong protection of corporate resources, manage appropriate access controls, and meet compliance requirements while enabling productive remote work environments.

Because there are different types of workloads—from Amazon Elastic Compute Cloud (Amazon EC2) instances to web applications—running in the AWS Cloud, there are correspondingly multiple remote access use cases for using or operating these workloads. For example, access to an EC2 instance and its operating system to perform operations such as troubleshooting, log analysis, and data retrieval. Other use cases require access to web applications such as Jenkins, Salesforce, or the Kubernetes UI deployed on AWS.

To support these use cases, AWS provides multiple services and features that help you address access patterns using different approaches. One of the key challenges that you might face when implementing remote access solutions is understanding the tradeoffs of the different approaches and solutions. This post is designed to help you decide which remote access approach is best for your use-case.

Use cases

In this post, we address the following use cases:

Challenges associated with remote access

  • Cost: The cost of a remote access solution is a key factor for businesses.
  • Increased exposure surface: Securing a VPC with several EC2 instances, S3 buckets, and a database is a different task than securing the identities, devices, and communications channels used for remote access to the infrastructure.
  • Increased risk: Susceptibility to social engineering threats. Humans accessing workloads are the weakest link in any security program, introducing risks to data and infrastructure that otherwise wouldn’t have existed.
  • User experience (UX): The UX is a key factor in remote access. Lacking a well-designed UX can introduce risks by making it difficult to conduct day-to-day operations or respond quickly to incidents that affect users at scale.

A solution to mitigate the risks associated with remote access is to not provide it at certain levels, and you might sometimes choose this approach. In these cases, access to workloads that must be secure is only possible from trusted locations (such as company offices) and managed devices (such as company-issued laptops). For the remainder of this post, we talk about approaches and solutions available for you when you need to provide remote access from various locations and devices.

The different approaches

Before diving deeper into the services and features, let’s explore the different approaches for providing remote access to your users (shown in Figure 1). The main differentiator among them is where the trust boundary lies.

Figure 1: The different approaches along with the corresponding solutions

Figure 1: The different approaches along with the corresponding solutions

  • Network-based approach: Users are given access to your network through VPCs and are granted broad access to the actual target resource, web application, or EC2 instances. The trust boundary in this case is the VPC.
  • Host-based approach: Users have access to the host running the application. This is commonly used for operator access. The trust boundary is the host.
  • Application-based approach: Users access the application using their corporate credentials. This is commonly the case for software as a service (SaaS) applications. The trust boundary is the application.
  • End-user computing approach: End-user computing (EUC) is a combination of technologies, policies, and processes that gives users secure, remote access to applications, desktops, and data that they need to get their work done. Desktops are operated centrally in the cloud and interacted with using streamed pixels to users’ devices. This approach shifts the trust boundary from the user device to desktops and data residing in the cloud.

These approaches aren’t mutually exclusive and occasionally overlap or can be combined in a zero trust model. Zero trust is centered on the idea that access to resources shouldn’t be based solely on the network location but on authentication and authorization of each request using multiple factors; including the user identity, device, and location, among others.

The trust boundary primarily depends on the criticality of the target resource, the risk tolerance of the organization, and the complexity of the implementation. Wider trust boundaries (such as in a network-based approach) increase the exposed surface area—because the whole network is exposed to trusted users and access to the network grants access to all the resources inside it—but are the simplest to implement. Tighter trust boundaries (such as a zero trust model) considerably reduce the exposed surface area but require implementing multiple factors that feed into the authorization context.

For example, organizations might provide network-based access from trusted devices to operators for a VPC with web-servers and databases, but only allow end-user computing based access for contractors or third-party users using non-corporate devices, also known as bring your own device (BYOD).

When selecting your remote access solution, you need to consider the desired trust boundary, authentication, authorization, user experience, access visibility and cost, which we explore in the following sections.

Network-based approach

The network-based approach is popular when users need access to multiple resources residing in specific networks in a straightforward manner, while keeping the networks disconnected from the public internet. When providing access at the network level, managing security configurations such as authorization, authentication, and auditing happens at the resource (application or machine) and client device, introducing challenges at scale.

AWS Client VPN is a fully managed service that you can use to securely connect users to VPCs from virtually any location using OpenVPN-based clients. Users can authenticate using your organization’s identity provider (IdP) in combination with certificate-based authentication. The service supports authorization rules that act as firewall rules to grant users access to specific CIDR blocks based on membership in an Active Directory group or a group defined in a SAML-based IdP. Additionally, you can use client connect handlers to run custom authorization logic based on device, user, and connection attributes.

After the required infrastructure is set up, users can connect to the target VPC and access EC2 instances or web applications at the network level inside their authorization scope. The UX is as straightforward as connecting using client software installed on the user’s device and authenticating using corporate authentication policies. A client VPN provides visibility into users’ connections to the VPN through connection logs, which are streamed to an Amazon CloudWatch log group. Connection logging provides visibility into each user’s initial VPN connection; getting visibility into what happened during the connection requires gathering the data from the target resource, network, or the user’s device.

After the user is authenticated and authorized, their device gains network access to the relevant VPC—and potentially other VPCs that are peered—or is connected through AWS Transit Gateway to that VPC. This can potentially provide network access to resources and networks outside the scope of the user.

A client VPN-based solution should be implemented when the network is the intended trust boundary around resources (for example, at the subnet or security group level) and group-level access control is sufficient. See Get started with AWS Client VPN.

Host-based approach

Providing access to hosts isn’t always necessary. One way to mitigate risks related to unauthorized host access is to not allow it and rely on fully automated operations instead. In practice, operators and developers still require access to hosts for visibility, tuning the operating system settings, applying patches, or manually restarting a service.

For access to EC2 instances, you can use features such as AWS Systems Manager Session Manager or EC2 Instance Connect Endpoint. Both of these features provide access to a host without exposing it to the internet, and because they use AWS Identity and Access Management (IAM), they authenticate, authorize, and log every session request made to AWS CloudTrail, and provide capabilities such as IAM Conditions (for example, aws:SourceIp) to apply conditional access, often minimizing the need for a network-based approach.

These two features mainly differ in the way they operate. Session Manager requires an agent, which is installed by default on several Amazon Machine Images (AMIs). The agent establishes an outbound connection—through the internet or a VPC endpoint—to the service endpoints, so you don’t have to modify the host’s inbound security group rules. It allows SSH connections tunneled over a proxy connection and provides in-session logging providing visibility into users’ commands within a session.

EC2 Instance Connect doesn’t require that you install an agent; it allows a secure native SSH connection, using short-lived SSH keys. As such, it requires that inbound connections from the EC2 Instance Connect service on port 22 be allowed on the host’s security group.

Most customers use Session Manager unless they don’t want to have an agent installed on the virtual machine or require a native SSH experience.

End-user computing approach

End-user computing services like the Amazon WorkSpaces Family or Amazon AppStream 2.0 stream desktops and applications as encrypted pixels to remote users while keeping data safely within your Amazon Virtual Private Cloud (Amazon VPC) and connected private networks. Unauthorized access to the client device is exposed only to encrypted pixels, which essentially moves the trust boundary from the device accessing the resources to the virtual desktop running in the cloud.

You can dive deeper into the differences between these different services in Unified access to AWS End User Computing services.

These services are particularly popular among customers who want to minimize the user’s device as the trust boundary. This can improve operational efficiency, especially when dealing with untrusted devices or highly sensitive data, because you significantly narrow the scope of what needs to be protected. This can also reduce the use (and costs) of expensive hardware.

The idea is that a user first authenticates using credentials provided by the corporate Active Directory or a SAML federation to the corporate identity provider. After the user is authenticated and authorized, an encrypted streaming session begins and the client is remotely operating a desktop or application that’s deployed in an Amazon VPC, with an elastic network interface (ENI) deployed to the customer’s managed VPC.

When adopting end-user computing for remote access, you can choose the UX and the cost structure that best fit your use case (for example, persistent access to a desktop or on-demand access to specific applications). You can also select different compute and storage options depending on the desired performance.

AWS End User Computing provides different machine types to accommodate different UX requirements and with different pricing models depending on the consumption model being used.

For more information, see Getting Started with Amazon Workspaces and Getting Started with AppStream 2.0.

Application-based approach

IAM Identity Center is primarily known for simplifying user access to AWS accounts within an organization at scale. It also provides single sign-on (SSO) access to supported web applications, giving users seamless access to these applications after they sign in using their directory credentials. Identity Center supports two application types:

If you use customer managed applications that support SAML 2.0 and OAuth 2.0, you can federate your IdP to IAM Identity Center through SAML 2.0 and use Identity Center to manage user access to those applications.

For organizations operating AWS environments at scale with multiple accounts, using IAM Identity Center is the recommended service to provide access to web applications and is provided at no additional cost.

Combining multiple approaches in a zero trust model

The zero trust model combines multiple factors including the user identity, device, location, and others, to evaluate and grant access requests. One way that you can implement this model to provide remote access to workloads deployed in a VPC is to use AWS Verified Access. With Verified Access, you can provide secure access to corporate applications without a client VPN and support TCP-based connections to a VPC, be it to web applications or EC2 or RDS instances. Authentication can be done using an existing IdP or AWS IAM Identity Center and a device management service that can provide additional information to improve authorization decisions based on context from the device. Those authorization decisions are expressed as Cedar policies that you author based on your access requirements. The service provides extensive logging for each web request, so you can investigate anomalies and view information about the access that was granted. For more information, see Get Started with Amazon Verified Access.

Understanding the tradeoffs

To select the right solution for your workforce, work backwards from the use case. Start by identifying and classifying the asset inventory and mapping the users accessing it and their access patterns.

Things to consider based on the classification:

  • Visibility: Determine the level of visibility into remote access activities and the type of information that you’ll need to detect and recover from a security event or to comply with regulatory and compliance requirements.
  • Authentication and authorization: Determine if your existing IAM mechanisms are sufficient. You might need to identify a temporary access management system or include information coming from user devices to address risks of compromised employees.
  • Network access: Know your users and what type of network access, if any, they need. When considering network access, include the potential risks of overly permissive access.
  • Cost: To determine costs, you need to know how many users and resources will be supported by remote access. Also, how many connections you expect and for how much time. Use that information to help determine the total cost of ownership of your solution.
  • Endpoint security: For each resource, understand risks associated with providing access to it from a user’s device. Know what mechanisms you have (or can implement) to detect threats and unauthorized access or provide additional context for the authorization decision granting access to a resource.
  • User experience: Compare the cost of a streamed user experience to one that’s locally installed to see if any additional cost is balanced by the improved security of the streamed UX.

The following provides an overview of the different solutions and the factors that can help you make an informed decision.

Solution Use cases Trust Boundary Provides access to Protocol User experience Authentication Authorization Visibility Cost
Client VPN
  • User access to internal applications
  • Operator access to IP resources in VPC
Network VPCs, subnets, security groups IP Client based,native
  • Single sign-on (SAML-based)
  • Active Directory
  • Mutual (certificate based)
  • Per CIDR (Authorization rules)
  • Lambda Authorizer for custom code
Connection logging (CloudWatch) Connection time and endpoint association
AWS Session Manager
  • Operator access to EC2 or on-premises instances
Host EC2 Instances: Linux, Windows, or MacOS (EC2 only) SSH or RDP Native
  • IAM
  • IAM
CloudTrail, or in-session logging using CloudWatch and Amazon S3) No additional cost for accessing EC2 instances
EC2 Instance Connect Endpoint
  • Operator access to EC2 instances
Host EC2 Instances: Linux or Windows SSH or RDP Native
  • IAM
  • IAM
CloudTrail No additional cost
IAM Identity Center
  • User access to SAML 2.0 and OAuth 2.0 applications
Application Web applications HTTP(S) Native
  • IAM Identity Center
  • IAM Identity Center
CloudTrail No additional cost
Amazon Verified Access
  • User accesses web or TCP-based applications deployed in a VPC
Amazon Verified Access
  • Web applications
  • TCP resources
HTTP(S) or TCP Native
  • IAM Identity Center or OIDC
  • Custom using Cedar policies
  • Allows device signals
Per request logging Per application or bandwidth
Amazon Workspaces
  • User accesses a virtual persistent desktop in a VPC
Cloud desktop Persistent virtual desktop WSP or PCoIP Client based, or non-native
  • Identity provider
  • Group membership
CloudTrail Per instance
Amazon AppStream 2.0
  • User accesses a virtual desktop in a VPC
Cloud desktop Non persistent virtual desktops and applications NICE DCV Client based or non-native
  • Identity provider
  • Group membership
CloudTrail Per instance

Conclusion

In this post, you learned about different approaches and solutions for providing remote access for your organization’s workforce. This included tactical recommendations on how to find the remote access solution that suits your needs best based on factors such as costs, user experience, and risk. By understanding those tradeoffs, you can now map out the different use-cases based on your infrastructure and threat model and build a remote access strategy to meet your needs. As you experiment and adopt the different tools, careful planning is required when designing and deploying the services. For example, which account to deploy the service to or how to provision access to the services. Use resources such as the AWS Security Reference Architecture (AWS SRA) and the individual service documentation pages to help guide your journey.

If you have feedback about this post, submit comments in the Comments section below.

Itay Meller

Itay Meller

Itay is a Security Specialist Solutions Architect at AWS, with a strong background in cybersecurity R&D and leadership roles across various security-focused companies. With deep expertise in cloud security, Itay helps organizations securely adopt and scale their AWS environments by addressing complex security and compliance challenges.

Maxim Raya

Maxim Raya

Maxim is a Security Specialist Solutions Architect at AWS. In this role, he helps clients accelerate their cloud transformation by increasing their confidence in the security and compliance of their AWS environments.

Building serverless event streaming applications with Amazon MSK and AWS Lambda

Post Syndicated from Tarun Rai Madan original https://aws.amazon.com/blogs/big-data/building-serverless-event-streaming-applications-with-amazon-msk-and-aws-lambda/

As organizations build modern applications with event-driven architectures (EDA), they often seek solutions that minimize infrastructure management overhead while maximizing developer productivity. Amazon Managed Streaming for Apache Kafka (Amazon MSK) and AWS Lambda together provide a serverless, scalable, and cost-efficient platform for real-time event-driven processing.

In this post, we describe how you can simplify your event-driven application architecture using AWS Lambda with Amazon MSK. We demonstrate how to configure Lambda as a consumer for Kafka topics, including a cross-account setup and how to optimize price and performance for these applications.

Why use Lambda with Amazon MSK?

Customers building event-driven applications have several key priorities when it comes to their architecture choices. They typically seek to reduce their operational overhead by using Amazon Web Services (AWS) to handle the complex, underlying infrastructure components so their teams can focus on core business logic. Additionally, developers prefer a streamlined experience that minimizes the need for repetitive boilerplate code, enabling them to be more productive and focus on creating value. Furthermore, these customers want to achieve both scalability and cost-effectiveness without the burden of managing compute infrastructure directly. Lambda integration with Amazon MSK effectively addresses these requirements, delivering a comprehensive solution that combines the benefits of serverless computing with managed Kafka services. For example, an ecommerce company can use Amazon MSK to collect real-time clickstream data from its website and process those events using AWS Lambda. With this integration, they can trigger Lambda functions to update recommendation models, send personalized offers, or analyze user behavior instantly—without provisioning or managing servers. The key benefits of using Lambda with Amazon MSK include:

  1. Simplicity through native integration – AWS Lambda offers native integration with Amazon MSK through a connector resource called event source mapping. You can use this integration to directly associate a Kafka topic—whether it’s on Amazon MSK or a self-managed Kafka cluster—as an event source for a Lambda function without writing custom consumer logic. With just a few configuration steps, event source mapping handles partition assignment, offset tracking, and parallelized batch processing under the hood. It uses the Kafka consumer group protocol to distribute topic partitions across multiple concurrent Lambda invocations, supports batch windowing, and enables at-least-once delivery semantics. Moreover, it automatically commits offsets upon successful function execution while handling retries and dead-letter queue (DLQ) routing for failed records, significantly reducing the operational overhead traditionally associated with Kafka consumers.
  2. Auto scaling and throughput controls – When using AWS Lambda with Amazon MSK through event source mapping, Lambda automatically scales by assigning a dedicated event poller per Kafka partition, enabling parallel, partition-based processing. This allows the system to elastically handle varying traffic without manual intervention. For advanced control, provisioned concurrency pre-initializes Lambda execution environments, eliminating cold starts and delivering consistent low-latency performance. Additionally, with provisioned event source mapping, you can configure the minimum and maximum number of Kafka pollers, providing precise control over throughput and concurrency. This is ideal for applications with unpredictable traffic patterns or strict latency requirements.
  3. Cost-effectiveness – AWS Lambda uses a pay-per-use model in which you only pay for compute time and number of invocations. When integrated with Amazon MSK, there are no charges for idle time, making it ideal for bursty or low-frequency Kafka workloads. You can further optimize costs by tuning batch size and batch window settings. For mission-critical workloads, provisioned concurrency provides consistent performance with controlled pricing.
  4. Event filtering – AWS Lambda supports event filtering for Amazon MSK event sources, which means you can process only the Kafka records that match specific criteria. This reduces unnecessary function invocations and optimizes your function costs. You can define up to five filters per event source mapping (with the option to request an increase to ten). Each filter uses a JSON-based pattern to specify the conditions a record must meet to be processed. Filters can be applied using the AWS Management Console, AWS Command Line Interface (AWS CLI), or AWS Serverless Application Model (AWS SAM) templates. For more details and examples, refer to the AWS Lambda documentation on event filtering with Amazon MSK.
  5. Handling Availability Zone outage for your consumer – Amazon MSK enables high availability for your Kafka brokers by distributing them across multiple Availability Zones within a Region. To maintain high availability across your application, you similarly need a consumer that offers high availability. AWS Lambda offers high availability and resilience by running your consumer functions across multiple Availability Zones in a Region. This means that even if one Availability Zone experiences an outage, your Lambda function will continue to operate in other healthy Availability Zones. While Lambda manages security patching and Availability Zone failure scenarios, you can focus on your application logic.
  6. Cross-account event processingCross-account connectivity between AWS Lambda and Amazon MSK allows a Lambda function in one AWS account to consume data from an MSK cluster in another account using MSK multi-VPC private connectivity powered by AWS PrivateLink. This setup is particularly beneficial for organizations that centralize Kafka infrastructure while maintaining separate accounts for different applications or teams.
  7. Support for JSON, Avro, Protobuf, and Schema Registries – AWS Lambda supports Kafka events in JSON, Avro and Protobuf formats via event source mapping. It integrates with AWS Glue Schema registry, Confluent Cloud Schema registry, and self-managed Confluent Schema registry , enabling native schema validation, filtering, and deserialization without custom code.

How Lambda processes messages from your Kafka topic

Lambda uses event source mappings to process records from Amazon MSK by actively polling Kafka topics through event pollers that invoke Lambda functions with batches of records. These mappings are Lambda managed resources designed for high-throughput, stream-based processing. By default, Lambda detects the OffsetLag for all partitions in your Kafka topic and automatically scales pollers based on traffic. For high-throughput applications, you can enable provisioned mode to define minimum and maximum pollers, and your event source mapping auto scales between the minimum and maximum defined values. In the provisioned mode, each poller can process up to 5 MBps and supports concurrent Lambda invocations.

After Lambda processes each batch, it commits the offsets of the messages in that batch. If your function returns an error for a message in a batch, Lambda retries the whole batch of messages until processing succeeds or the messages expire. You can send records that fail all retry attempts to an on-failure destination for later processing. To maintain ordered processing within a partition, Lambda limits the maximum event pollers to the number of partitions in the topic. When setting up Kafka as a Lambda event source, you can specify a consumer group ID to let Lambda join an existing Kafka consumer group. If other consumers are active in that group, Lambda will receive only part of the topic’s messages. If the group exists, Lambda starts from the group’s committed offset, ignoring the StartingPosition. The following diagram illustrates this flow.

Walkthrough: Build a serverless Kafka app with AWS Lambda

Follow these steps to build a serverless application that consumes messages from an MSK cluster using AWS Lambda:

  1. Create an Amazon MSK cluster. Use the AWS Management Console or AWS CLI to create your MSK cluster. When the cluster is up, create your Kafka topic(s). For detailed instructions, refer to the Amazon MSK documentation.
  2. Create a Lambda function using the AWS Management Console or the AWS CLI. To learn more about creating a Lambda function, refer to Create your first Lambda function. The Lambda function’s execution role needs to have the following permissions:
    1. Access to connect to your MSK cluster
    2. Permissions to manage elastic network interfaces in your VPC
  3. To connect Lambda to Amazon MSK as a consumer, set up event source mapping to link your MSK topic with the Lambda function. This allows Lambda to automatically poll for new messages and process them. Follow the guide on how to configure event source mapping.

For reference, configuring event source mapping involves three steps:

  1. Network setup – In the default event source mapping mode, you need to configure a networking setup using a PrivateLink endpoint or NAT gateway for event source mapping to invoke Lambda functions. In provisioned mode, no networking configuration is needed (and you don’t incur the cost of networking components).
  2. Event source mapping parameter configuration – This involves setting necessary configuration parameters for the event source mapping to be able to poll messages from your Kafka cluster. This includes the MSK cluster, topic name, consumer group ID, authentication method, and optionally, schema registry, scaling mode. You can configure the scaling mode for provisioned throughput, along with batch size, batch window, and event filtering for your event source mapping.
  3. Access permissions – This involves configuring required permissions to access the required AWS resources, and includes configuring permissions for the function to execute the code, permissions for the event source mapping to access your MSK cluster, and permissions for Lambda to access your VPC resources.

The following screenshot shows the console setup for configuring Amazon MSK event source mapping, including the Amazon MSK trigger related fields.

The following screenshot shows event poller configuration.

The following screenshot shows additional settings you can use, depending on your use case.

Optimizing AWS Lambda for stream processing with Amazon MSK

When building real-time data processing pipelines with Amazon MSK and AWS Lambda, it’s important to tune your setup for both performance and cost-efficiency. Lambda offers powerful serverless compute capabilities, but to get the most out of it in a streaming context, you need to make a few key optimizations:

  1. Enable provisioned concurrency for low-latency processing – For workloads that are sensitive to latency—cold starts can introduce unwanted delays. By enabling provisioned concurrency, you can pre-warm a specified number of Lambda instances so they’re always ready to handle traffic immediately. This eliminates cold starts and provides consistent response times, which is crucial for latency-critical use cases.
  2. Enable provisioned mode for event source mapping for high-throughput processing – For Kafka workloads with stringent throughput requirements, activate the provisioned mode. The optimal configuration of minimum and maximum event pollers for your Kafka event source mapping depends on your application’s performance requirements. Start with the default minimum event pollers to baseline the performance profile and adjust event pollers based on observed message processing patterns and your application’s performance requirements. For workloads with spiky traffic and strict performance needs, increase the minimum event pollers to handle sudden surges. You can fine-tune the minimum event pollers by evaluating your desired throughput, your observed throughput, which depends on factors such as the ingested messages per second and average payload size, and using the throughput capacity of one event poller (up to 5 MB/s) as reference. To maintain ordered processing within a partition, Lambda caps the maximum event pollers at the number of partitions in the topic.
  3. Optimize message batching using size and windowing – By integrating Lambda with Amazon MSK, you can control how messages are batched before they’re sent to your function. Tuning parameters such as batch size (the number of records per invocation: 1–10,000 records) and maximum batching window (how long to wait for a full batch: 0–300 seconds) can significantly impact performance. Larger batches mean fewer invocations, which reduces overhead and improves throughput. However, it’s important to strike a balance—too large a batch or window might introduce unwanted processing delays. Monitor your stream’s behavior and adjust these settings based on throughput requirements and acceptable latency.
  4. Apply filters to reduce unnecessary invocations – Not every record in your Kafka topic might require processing. To avoid unnecessary Lambda invocations (and associated costs), apply filtering logic directly when configuring the event source mapping. With Lambda, you can define filtering (up to 10 filters) criteria so that only relevant records trigger your function. This helps reduce compute time, minimize noise, and optimize your budget, especially when dealing with high-throughput topics with mixed content. For Amazon MSK, Lambda commits offsets for matched and unmatched messages after successfully invoking the function.

Conclusion

By combining Amazon MSK with AWS Lambda, you can seamlessly build modern, serverless event-driven applications. This integration eliminates the need to manage consumer groups, compute infrastructure, or scaling logic so teams can focus on delivering business value faster.

Whether you’re integrating Kafka into microservices, transforming data pipelines, or building reactive applications, Lambda with Amazon MSK is a powerful and flexible serverless solution. For detailed documentation on how to configure Lambda with Amazon MSK, refer to the AWS Lambda Developer Guide. For more serverless learning resources, visit Serverless Land.


About the Authors

Tarun Rai Madan is a Principal Product Manager at Amazon Web Services (AWS). He specializes in serverless technologies and leads product strategy to help customers achieve accelerated business outcomes with event-driven applications, using services like AWS Lambda, AWS Step Functions, Apache Kafka, and Amazon SQS/SNS. Prior to AWS, he was an engineering leader in the semiconductor industry, and led development of high-performance processors for wireless, automotive, and data center applications.

Masudur Rahaman Sayem is a Streaming Data Architect at AWS with over 25 years of experience in the IT industry. He collaborates with AWS customers worldwide to architect and implement sophisticated data streaming solutions that address complex business challenges. As an expert in distributed computing, Sayem specializes in designing large-scale distributed systems architecture for maximum performance and scalability. He has a keen interest and passion for distributed architecture, which he applies to designing enterprise-grade solutions at internet scale.
Beyond compute: Shifting vulnerability detection left with Amazon Inspector code security capabilities

Post Syndicated from Nirali Desai original https://aws.amazon.com/blogs/security/shifting-vulnerability-detection-left-with-amazon-inspector-code-security-capabilities/

Since launch, Amazon Inspector has helped customers automate vulnerability management for their running workloads on Amazon Elastic Compute Cloud (Amazon EC2), container workloads, and AWS Lambda functions. Today, we’re taking a step forward into more proactive security with the latest addition to Amazon Inspector: code security capabilities. By using this powerful new feature you can get a proactive view of the security health of your code. With native integration to source code managers (SCM) such as GitHub and GitLab, Amazon Inspector helps you identify and prioritize security vulnerabilities and misconfigurations across your application source-code, dependencies, and infrastructure as code (IaC).

Even if you make no changes to your code, there can be vulnerabilities in libraries that it depends on, creating risks for you and your users. By scanning repositories, you can continually monitor the security of your code and its dependencies. With Amazon Inspector, you can define consistent security controls throughout your software development lifecycle, so your security and development teams can collaborate effectively while reducing risk and remediation costs.

Overview of Amazon Inspector code security capabilities

Amazon Inspector now provides three additional security analysis capabilities: static application security testing (SAST), software composition analysis (SCA), and infrastructure as code (IaC) scanning. To use these features, you must establish a connection with your SCM tool (as shown in Figure 1). If you use GitHub, you can get started by installing and configuring the Amazon Inspector App from the GitHub Marketplace, which enables automated code analysis and delivers security findings directly within pull requests. If you use a self-managed GitLab, implementation is straightforward using a personal access token with the necessary permissions.

Figure 1: Code security landing page for Amazon Inspector

Figure 1: Code security landing page for Amazon Inspector

Static application security testing

Static application security testing (SAST) is the process of analyzing source code to identify insecure patterns or methods without needing to compile or execute the code. Amazon Inspector SAST scans analyze your source code to identify potential security vulnerabilities such as hardcoded secrets, cross-site scripting, or injection attacks across a wide range of programming languages including, JavaScript, Python, C#. The service also analyzes Bash shell scripts, extending security coverage beyond application code to include deployment and configuration scripts.

Software composition analysis

Software composition analysis (SCA) helps you understand and manage risks related to software dependencies. Every programming language has its own method of finding, importing, and updating contributed libraries. For example, PyPI for Python, NPM for NodeJS, and Cargo for Rust. Sometimes vulnerabilities are discovered in libraries distributed through the language-specific package distributions, or sometimes a library that you’re using depends on another library, and that dependency has the vulnerability. Amazon Inspector supports the major environments for Python, .Net, PHP, JavaScript, Java, Ruby, Rust, and Go. It automatically analyzes dependencies to identify known vulnerabilities and show you which code is affected. When vulnerabilities are detected, Amazon Inspector provides detailed information about the impact, available fixes, and upgrade paths to help you quickly remediate issues.

Infrastructure as code security

Just as applications are constructed from code, cloud infrastructure can be deployed and managed through code-based methods. Amazon Inspector now also analyzes IaC templates (as shown in Figure 2) to identify potential security misconfigurations, for example, the use of AWS Identity and Access Management (IAM) wildcards in action statements or disabled Glue Data Catalog encryption. This way identified risks can be fixed before the code is executed and the incorrect infrastructure is deployed. The new feature analyzes AWS CloudFormation, Terraform, and AWS CDK, helping you maintain secure infrastructure definitions throughout their development process. This capability helps make sure that security best practices are followed, and potential issues are caught before the infrastructure is deployed.

Figure 2: Amazon Inspector scan analysis configuration showing SAST, IaC, and SCA scan types

Figure 2: Amazon Inspector scan analysis configuration showing SAST, IaC, and SCA scan types

For the most up-to-date list of programming languages supported across Amazon Inspector code security capabilities, see the online documentation.

Improved security governance and visibility

Amazon Inspector lets you choose which scan types to run across which repositories (as shown in Figure 3). You can initiate a scan based on any of the following:

  • On-demand: Initiates an immediate scan of the selected repository
  • Change based: Initiates a scan on push to main branch, or on a pull request or merge request
  • Scheduled: Initiates a scan weekly or monthly
Figure 3: Overview of scan configurations

Figure 3: Overview of scan configurations

Amazon Inspector integrates code security findings into a unified dashboard that you can use to manage and enforce scanning policies across repositories using customizable scan configurations. As part of the integration workflow with the SCM platform, you can set up a default scan configuration that can be applied to existing or new repositories. Alternatively, you also have an option to create custom scan configurations that match specific existing repositories through inclusions tags.

Upon successful scheduled or event-based scans, Amazon Inspector generates detailed findings that pinpoint specific lines of code within repositories, including commit IDs and file locations where vulnerabilities are detected. Amazon Inspector empowers your security teams with customizable filtering through intelligent suppression rules. By using these options, you can tailor your security view to match your organization’s unique priorities, showing exactly what matters most to your team while preserving findings data for reporting and auditing. Through native Amazon EventBridge integration, these detailed security findings can be automatically routed into existing security workflows, enabling alerting and response capabilities.

Code fix recommendations

Amazon Inspector streamlines security remediation by providing specific code fix recommendations directly where developers work. The two-way integration with your SCM automatically suggests fixes as comments within pull requests (PRs) and merge requests (MRs) for Critical and High findings, alerting developers to the most important vulnerabilities to address without disrupting their workflow. Simultaneously, security teams benefit from a consolidated dashboard in the Amazon Inspector console that aggregates findings from scheduled or event-based scans across in-scope repositories. Each finding comes with tailored remediation guidance based on scan type (as shown in Figure 4): specific code suggestions for IAC and SAST findings, or recommended version upgrades and dependency update paths for SCA findings.

Figure 4: Code fix recommendation on a finding in the Amazon Inspector dashboard

Figure 4: Code fix recommendation on a finding in the Amazon Inspector dashboard

Conclusion

These expanded security capabilities now deliver end-to-end visibility of the security health of your cloud applications, from initial code development through to production deployment. Security teams can use the unified dashboard in Amazon Inspector to track and manage vulnerabilities across repositories and application components, facilitating consistent security controls throughout the software lifecycle. Meanwhile, development teams receive immediate, actionable feedback within their source code repositories, creating a seamless security experience that bridges both security and development workflows. This approach is designed to help you maintain robust security practices while keeping development velocity high.

To get started with the new capabilities of Amazon Inspector, visit the Amazon Inspector console. For pricing details and implementation guidance, see documentation. These new features are now available in 10 AWS commercial Regions.

Nirali Desai

Nirali Desai

Nirali is a product leader in cloud security, currently driving Application Security initiatives at Amazon Web Services (AWS). Before joining AWS, she held key roles at Palo Alto Networks, Zscaler, and Cisco Tetration, where she focused on building Secure Access Secure Edge (SASE), end-user security, workload protection, and zero-trust security solutions. She is passionate about building scalable security products that defend against evolving cyber threats.

Danny Cortegaca

Danny Cortegaca

Danny is a Security Specialist Solutions Architect and co-leads the Application Security focus area within the AWS Security and Compliance Technical Field Community. He joined AWS in 2021 and partners with some of the largest organizations in the world to help them navigate complex security and regulatory environments. He loves talking about application security with customers and has helped many adopt threat modeling into their practices.

Daniel Beghimer

Daniel Beghimer

Daniel is a Senior Security Engineer specializing in cloud security and incident response solutions. He co-leads the Application Security focus area within the AWS Security and Compliance Technical Field Community, holds all AWS certifications, and authored Automated Security Helper (ASH), an open-source code scanning tool. In his free time, Daniel enjoys gadgets, video games, and traveling.

Introducing the AWS Security Champion Knowledge Path and digital badge

Post Syndicated from Sarah Currey original https://aws.amazon.com/blogs/security/introducing-the-aws-security-champion-knowledge-path-and-digital-badge/

Today, Amazon Web Service (AWS) introduces the Security Champion Knowledge Path on AWS Skill Builder, featuring training and a digital badge. The Security Champion Knowledge path is a comprehensive educational framework designed to empower developers and software engineers with essential AWS cloud security knowledge and best practices. The structured learning path enables development teams to accelerate their delivery while maintaining robust security standards in cloud environments, addressing customers’ need for a structured curriculum to develop and validate security expertise across their organizations.

AWS Skill Builder logo

A new era of security education

The AWS Security Champion Knowledge Path complements the existing AWS security training offerings, providing a structured, self-paced journey to security expertise. Hart Rossman, Vice President of Global Services Security at AWS, emphasizes the program’s significance: “Security in the cloud isn’t a destination; it’s an ongoing journey. The AWS Security Champion Knowledge Path equips our customers with the tools and knowledge to navigate this journey confidently, fostering a culture where security is woven into every aspect of cloud operations.”

Designed for a diverse audience including software developers, solutions architects, technical leaders, and cloud practitioners, the training plan covers a wide range of topics that are critical for a strong security posture in the cloud. This AWS security learning journey begins with essential fundamentals and progressively builds toward advanced concepts across a well-structured curriculum. Starting with AWS Security Fundamentals and the AWS Shared Responsibility Model, learners establish core principles before diving into AWS Identity and Access Management (IAM), including detailed troubleshooting scenarios. The curriculum advances to critical security elements such as encryption and comprehensive threat modeling through the AWS Builders Workshop. Security governance and auditing form the next tier, followed by practical implementations of monitoring, alerting, and network infrastructure best practices. The learning path then covers specialized areas including web-facing workload protection, network control, and incident response procedures. The knowledge path culminates with deep dives into container security and core security concepts through AWS SimuLearn, providing hands-on experience with real-world scenarios. This carefully orchestrated progression helps facilitate a thorough understanding of AWS security principles while maintaining a practical, implementation-focused approach.

AWS SimuLearn logo

What is a Security Champion?

A Security Champion is a bridge between security teams and development teams, promoting security best practices and making sure that security is embedded into every stage of the development lifecycle. However, Security Champion isn’t just a role—it’s a mindset. In today’s distributed and agile cloud environments, having Security Champions across different teams provides a competitive advantage for releasing products quickly and securely.

This distributed ownership of security brings numerous benefits: faster development cycles because teams can address security requirements proactively, reduced security incidents through early detection, and improved collaboration between security and development teams. Most importantly, it creates a culture of security where every team member understands their role in protecting the organization’s assets and data.

By becoming a Security Champion, you’ll gain valuable expertise, earn recognized credentials, and develop leadership skills that can accelerate your career growth. Most importantly, you’ll be empowered to make meaningful contributions to your organization’s security posture by promoting best practices, identifying potential vulnerabilities early in the development cycle, and fostering collaboration between teams—ultimately helping your organization deliver products that are both innovative and secure.

How can I become an AWS Security Champion?

Security enthusiasts can enroll into the AWS Security Champion Knowledge Badge Readiness Path on AWS Skill Builder and complete the assessment successfully to earn the AWS Security Champion digital badge available on Credly.

AWS Security Champion training is a self-paced, hands-on, and interactive approach to upskilling on security concepts. As a participant, you’re introduced to security best practices, performing basic audits, planning for governance at scale, incident response concepts and more. You can engage with real-world scenarios through hands-on labs, interactive game-based learning, gain access to AWS sandbox environments, and conduct practical security assessments. This applied learning helps make sure that knowledge isn’t just acquired, but truly internalized and ready for immediate application.

“The AWS Security Champion Knowledge Path represents a significant milestone in democratizing security expertise. We’ve designed this program to transform how organizations approach security training, making it accessible, practical, and immediately applicable. This isn’t just about learning security concepts—it’s about creating a culture where security becomes second nature to every team member.”
– Jenni Troutman, Training and Certification Director at AWS

Recognition and community

Upon successfully completing the assessment in this training path, participants earn the prestigious AWS Security Champion knowledge badge in Credly to showcase their accomplishment, such as on LinkedIn, and join a growing community of security professionals. This recognition not only validates individual expertise but also signals an organization’s commitment to security excellence, and helps organizations identify qualified security champions within their team.

Getting started

To begin your journey to becoming an AWS Security Champion, log in or create an account with AWS Skill Builder and enroll in the Security Champion Knowledge Badge Readiness Path. The training plan is available through flexible pricing options, including individual subscriptions at $29 per month and team subscriptions at $449 per month with enterprise volume pricing available.

Rossman concludes, “The AWS Security Champion Knowledge Path represents a paradigm shift in how organizations approach security education. It’s about creating a shared language of security across teams, enabling faster, more secure development cycles, and ultimately, delivering better outcomes for our customers.”

Ready to elevate your organization’s security capabilities? Visit AWS Skill Builder to enroll and start your journey towards becoming an AWS Security Champion. For enterprise inquiries, reach out to your AWS account team.

Stay tuned to the AWS Security Blog for more updates on AWS Security services, features, and best practices. Together, we’re building a more secure cloud for all.

If you have feedback about this post, submit comments in the Comments section below.

Sarah Currey

Sarah Currey

As the Organization Excellence Leader for AWS Global Services Security, Sarah creates and optimizes security programs and solutions that protect AWS customers and internal teams. The initiatives foster a culture of security that encourages continuous improvement and innovation in our security practices while empowering everyone to champion security.

Alejandra Lopez

Alejandra Lopez

Alejandra is a Sr. Go-to-Market Leader at AWS Global Services Strategy and Operations and specializes in scaling AWS Training and Certification offerings through go-to-market strategies. Her expertise lies in creating scalable solutions for both enterprise customers and individual learners, with an emphasis on upskilling in AWS Cloud technologies, generative AI, and bridging the cloud skills gap.

Amar Meda

Amar Meda

Amar is a Sr. Technical Product Manager at AWS and leads the product strategy and delivery of digital training products available on AWS Skill Builder. With his expertise in cloud technologies and commitment to accessible learning experiences, Amar helps organizations, partners and individuals worldwide maximize their AWS capabilities through innovative training solutions.

Enhance security and performance with TLS 1.3 and Perfect Forward Secrecy on Amazon OpenSearch Service

Post Syndicated from Shubham Kumar original https://aws.amazon.com/blogs/big-data/enhance-security-and-performance-with-tls-1-3-and-perfect-forward-secrecy-on-amazon-opensearch-service/

Amazon OpenSearch Service recently introduced a new Transport Layer Security (TLS) policy Policy-Min-TLS-1-2-PFS-2023-10, which supports the latest TLS 1.3 protocol and TLS 1.2 with Perfect Forward Secrecy (PFS) cipher suites. This new policy improves security and enhances OpenSearch performance.

OpenSearch Service previously offered predefined TLS policies for domain endpoint security, making it possible to encrypt your traffic end-to-end by enforcing HTTPS. However, these policies were limited to older versions of TLS, such as TLS 1.0 and TLS 1.2, without any PFS offerings.

In this post, we discuss the benefits of this new policy and how to enable it using the AWS Command Line Interface (AWS CLI).

Solution overview

The new TLS security policy provides an upgraded security posture for OpenSearch Service domains by implementing TLS 1.3 and PFS. This makes it possible to enhance the confidentiality and integrity of traffic between clients and your OpenSearch Service domains, providing a more secure and efficient communication channel for your sensitive data. TLS 1.3 is the latest version of the Transport Layer Security protocol, designed to prevent certain attacks targeting legacy TLS ciphers and provide improvements like 0-RTT resumption for faster connection times. TLS 1.3 can establish secure connections faster than TLS 1.2, resulting in reduced latency for your applications. PFS is an important security enhancement that makes sure past communications remain secure, even if the server’s long-term secret key is compromised in the future. By using a unique, randomly generated session key for each connection, PFS adds an extra layer of protection against potential eavesdropping or decryption of encrypted data. Compared to the older TLS 1.2 policy Policy-Min-TLS-1-2-2019-07, TLS 1.2 with PFS offers stronger security by protecting against potential key compromises, while still maintaining compatibility with older clients that don’t support TLS 1.3.

Prerequisites

To start using this new policy, you need the following prerequisites:

Enable the new TLS policy on OpenSearch Service

To create new domains with the new TLS policy enabled, add --domain-endpoint-options '{"TLSSecurityPolicy": "Policy-Min-TLS-1-2-PFS-2023-10"}' to the create-domain AWS CLI command:

aws opensearch create-domain \
--domain-name my-domain \
--domain-endpoint-options '{"TLSSecurityPolicy": "Policy-Min-TLS-1-2-PFS-2023-10"}' <other config options>

For existing domains, you can update the domain configuration to use the new TLS policy by running the update-domain-config AWS CLI command:

aws opensearch update-domain-config \
--domain-name my-domain \
--domain-endpoint-options '{"TLSSecurityPolicy": "Policy-Min-TLS-1-2-PFS-2023-10"}'

Client-side considerations

Most modern clients and libraries should support TLS 1.3 and TLS 1.2 with PFS out of the box. However, if you encounter issues or compatibility concerns, you might need to update your client libraries or configurations to enable support for the new TLS policy.

Conclusion

The new Policy-Min-TLS-1-2-PFS-2023-10 security policy for OpenSearch Service offers significant improvements in security and performance. By supporting TLS 1.3 and TLS 1.2 with PFS, this policy helps protect your data in transit and provides faster connection times. We recommend that you start using this new TLS security policy for improved security posture and performance when connecting to your OpenSearch Service domains. To get started, follow the steps outlined in this post to enable the new policy on your existing or new domains.

For more information on the available TLS options and how to configure them, refer to Infrastructure security in Amazon OpenSearch Service.

At Amazon, security is our top priority, and we are continuously working to enhance the security and performance of our services. Stay tuned for more exciting updates!


About the authors

Shubham Kumar is a Software Development Engineer at Amazon OpenSearch Service, specializing in the security domain. He is passionate about developing robust security features to enhance the protection of customer data and infrastructure.

Sachet Alva is a Software Development Manager at Amazon OpenSearch Service, overseeing the infrastructure security and custom package initiatives. His team’s innovations contribute to the enhanced security and flexibility of Amazon OpenSearch Service deployments.

Naveen Negi is a Senior Tech Product Manager for Amazon OpenSearch Service. He works closely with engineering teams and customers to shape the future of OpenSearch Service, making sure it meets evolving security and performance needs.

Monitoring AWS End User Messaging SMS Registrations with Lambda

Post Syndicated from Patrick Viker original https://aws.amazon.com/blogs/messaging-and-targeting/monitoring-aws-end-user-messaging-sms-registrations-with-lambda/

Managing AWS End User Messaging SMS registrations can be challenging, especially when dealing with multiple registrations in various states and countries. This post introduces an automated monitoring solution that helps you stay on top of your registration statuses. By leveraging AWS Lambda, EventBridge, and Simple Email Service (SES), you’ll create a system that provides regular updates about registrations that need attention, are under review, in draft pending submission, or have recently been completed.

Whether you’re managing Sender IDs, United States 10DLC campaigns, toll-free numbers, or short codes, this solution will help you maintain visibility across all your registrations and respond promptly to status changes. The setup takes approximately 15-20 minutes and requires no ongoing maintenance beyond occasional adjustments to meet your evolving needs.

Estimated Setup Time: 15-20 minutes

Prerequisites

  • An AWS account with access to Lambda, IAM, EventBridge, End User Messaging SMS, and SES
  • A verified email address in Amazon SES for sending reports.
Figure 1: AWS End User Messaging SMS registrations in the console. This view shows registrations in various states that our Lambda function will monitor.

Figure 1: AWS End User Messaging SMS registrations in the console. This view shows registrations in various states that our Lambda function will monitor.

Step 1: Set up Amazon SES

  1. Open the Amazon SES console
  2. Navigate to “Verified identities”
  3. If you have an identity verified you can skip this section
  4. If you do not already have an identity verified Click “Create identity”
  5. Review this post to learn how to verify an identity
    NOTE: Best practice is to verify a domain identity. This will authenticate your domain and improve deliverability. An email address identity, while more simple, will not be authenticated through DKIM which may decrease deliverability.

Reference: Creating and verifying identities in Amazon SES

Step 2: Create an IAM Role

  1. Open the IAM console
  2. Navigate to “Roles” and click “Create role”
  3. Select “AWS service” and “Lambda” as the use case
  4. Add only the following AWS managed policy: AWSLambdaBasicExecutionRole
  5. Name the role (e.g., “EndUserMessagingRegistrationsMonitorRole”) and click “Create role”
  6. After role creation, click on the newly created role
  7. Select “Add permissions” → “Create inline policy”
  8. Click on the “JSON” tab and paste the following policy:
    {
        "Version": "2012-10-17",
        "Statement": [
            {
                "Effect": "Allow",
                "Action": [
                    "sms-voice:DescribeRegistrations",
                    "sms-voice:DescribeRegistrationVersions"
                ],
                "Resource": "arn:aws:sms-voice:${region}:${account-id}:registration/*"
            },
            {
                "Effect": "Allow",
                "Action": "ses:SendRawEmail",
                "Resource": [
                    "arn:aws:ses:${region}:${account-id}:identity/${domain}",
                    "arn:aws:ses:${region}:${account-id}:configuration-set/*"
                ],
                "Condition": {
                    "StringLike": {
                        "ses:FromAddress": [
                            "*@${domain}"
                        ]
                    }
                }
            }
        ]
    }
  9. Replace the placeholders in the policy:
    1. ${region}: Your AWS region (e.g., ‘us-west-2’)
    2. ${account-id}: Your AWS account ID
    3. ${domain}: Your verified SES domain
  10. Click “Next”
  11. Name the policy (e.g., “EndUserMessagingRegistrationsAccess”) and click “Create policy”

Reference: Creating a role for an AWS service (console)

Step 3: Create the Lambda Function

  1. Open the Lambda console
  2. Click “Create function”
  3. Choose “Author from scratch”
  4. Configure basic settings:
  5. Name: EndUserMessagingRegistrationsMonitor
  6. Runtime: Python 3.12
  7. Architecture: x86_64
  8. Permissions: Use the IAM role created in Step 2
  9. Click “Create function”
  10. Configure environment variables:
    1. Under “Configuration” tab → “Environment variables”
    2. Set the following key/value pairs:
      1. Key: SENDER_EMAIL, Value: [Your verified SES email]
      2. Key: RECIPIENT_EMAIL, Value: [Email to receive reports]
  11. Configure function timeout:
    1. Under “Configuration” → “General configuration”
    2. Set timeout to 1 minute
  12. In the function code area, paste the following code:
    import boto3
    import json
    from datetime import datetime, timedelta
    from collections import defaultdict
    from email.mime.text import MIMEText
    from email.mime.multipart import MIMEMultipart
    import os
    
    # Constants
    REGION = os.environ['AWS_REGION']
    SENDER_EMAIL = os.environ['SENDER_EMAIL']
    RECIPIENT_EMAIL = os.environ['RECIPIENT_EMAIL']
    COMPLETED_LOOKBACK_DAYS = 7
    
    # Initialize AWS clients
    sms_client = boto3.client('pinpoint-sms-voice-v2', region_name=REGION)
    ses_client = boto3.client('ses', region_name=REGION)
    
    # Global registration dictionary
    registrations = {
        'REQUIRES_UPDATES': defaultdict(list),
        'CREATED': defaultdict(list),
        'COMPLETED': defaultdict(list),
        'REVIEWING': defaultdict(list)
    }
    
    def get_console_url(registration_id):
        return f"https://{REGION}.console.aws.amazon.com/sms-voice/home?region={REGION}#/registrations?registration-id={registration_id}"
    
    def get_version_details(registration_id, latest_denied_version=None):
        try:
            if latest_denied_version:
                response = sms_client.describe_registration_versions(
                    RegistrationId=registration_id,
                    VersionNumbers=[latest_denied_version]
                )
            else:
                response = sms_client.describe_registration_versions(
                    RegistrationId=registration_id,
                    MaxResults=1
                )
            
            if response['RegistrationVersions']:
                return response['RegistrationVersions'][0]
        except Exception as e:
            print(f"Error getting version details for {registration_id}: {str(e)}")
        return None
    
    def is_recently_completed(version_info):
        if 'RegistrationVersionStatusHistory' in version_info:
            history = version_info['RegistrationVersionStatusHistory']
            if 'ApprovedTimestamp' in history:
                approved_time = history['ApprovedTimestamp']
                if isinstance(approved_time, datetime):
                    approved_time = approved_time.timestamp()
                lookback_time = (datetime.now() - timedelta(days=COMPLETED_LOOKBACK_DAYS)).timestamp()
                return approved_time > lookback_time
        return False
    
    def categorize_registration_type(registration_type):
        if 'TEN_DLC' in registration_type:
            return 'TEN_DLC'
        elif 'LONG_CODE' in registration_type:
            return 'LONG_CODE'
        elif 'SHORT_CODE' in registration_type:
            return 'SHORT_CODE'
        elif 'SENDER_ID' in registration_type:
            return 'SENDER_ID'
        elif 'TOLL_FREE' in registration_type:
            return 'TOLL_FREE'
        else:
            return 'OTHER'
    
    def categorize_registrations():
        global registrations
        registrations = {
            'REQUIRES_UPDATES': defaultdict(list),
            'CREATED': defaultdict(list),
            'COMPLETED': defaultdict(list),
            'REVIEWING': defaultdict(list)
        }
    
        try:
            response = sms_client.describe_registrations()
            
            for registration in response.get('Registrations', []):
                status = registration['RegistrationStatus']
                registration_id = registration['RegistrationId']
                registration_type = registration['RegistrationType']
                category = categorize_registration_type(registration_type)
                
                reg_info = {
                    'id': registration_id,
                    'type': registration_type,
                    'status': status,
                    'version': registration['CurrentVersionNumber'],
                    'console_url': get_console_url(registration_id)
                }
    
                if 'AdditionalAttributes' in registration:
                    reg_info['additional_attributes'] = registration['AdditionalAttributes']
    
                if status == 'REQUIRES_UPDATES':
                    latest_denied_version = registration.get('LatestDeniedVersionNumber')
                    version_info = get_version_details(registration_id, latest_denied_version)
                    if version_info and 'DeniedReasons' in version_info:
                        reg_info['denial_reasons'] = version_info['DeniedReasons']
                    registrations['REQUIRES_UPDATES'][category].append(reg_info)
                
                elif status == 'CREATED':
                    registrations['CREATED'][category].append(reg_info)
                
                elif status == 'REVIEWING':
                    registrations['REVIEWING'][category].append(reg_info)
                
                elif status == 'COMPLETE':
                    version_info = get_version_details(registration_id)
                    if version_info and is_recently_completed(version_info):
                        approved_timestamp = version_info['RegistrationVersionStatusHistory']['ApprovedTimestamp']
                        if isinstance(approved_timestamp, datetime):
                            approved_timestamp = approved_timestamp.timestamp()
                        reg_info['approved_timestamp'] = approved_timestamp
                        registrations['COMPLETED'][category].append(reg_info)
                    
        except Exception as e:
            print(f"Error listing registrations: {str(e)}")
            raise e
    
    def generate_html_output():
        html = """
        <html>
        <head>
            <style>
                body { 
                    font-family: Arial, sans-serif;
                    margin: 20px;
                    line-height: 1.6;
                }
                .registration-group { margin: 20px 0; }
                .registration-category { 
                    background-color: #f0f0f0;
                    padding: 10px;
                    margin: 10px 0;
                    border-radius: 5px;
                }
                .registration-item {
                    border-left: 4px solid #ccc;
                    margin: 10px 0;
                    padding: 10px;
                    background-color: #ffffff;
                }
                .requires-updates { border-left-color: #ff9900; }
                .created { border-left-color: #007bff; }
                .completed { border-left-color: #28a745; }
                .reviewing { border-left-color: #6c757d; }
                .denial-reasons {
                    background-color: #fff3f3;
                    padding: 10px;
                    margin: 5px 0;
                    border-radius: 3px;
                }
                .console-link {
                    color: #007bff;
                    text-decoration: none;
                    padding: 2px 5px;
                    border: 1px solid #007bff;
                    border-radius: 3px;
                }
                .console-link:hover {
                    background-color: #007bff;
                    color: #ffffff;
                }
                .summary {
                    margin: 20px 0;
                    padding: 15px;
                    background-color: #e9ecef;
                    border-radius: 5px;
                    box-shadow: 0 2px 4px rgba(0,0,0,0.1);
                }
                .divider {
                    border-top: 2px solid #dee2e6;
                    margin: 20px 0;
                }
                .lookback-info {
                    background-color: #e2e3e5;
                    padding: 10px;
                    border-radius: 5px;
                    margin: 10px 0;
                    font-style: italic;
                }
                h2, h3, h4 {
                    color: #333;
                    margin-top: 20px;
                }
                ul {
                    margin: 5px 0;
                    padding-left: 20px;
                }
                li {
                    margin: 5px 0;
                }
            </style>
        </head>
        <body>
        """
    
        html += f"<h2>Registration Status Report - {datetime.now().strftime('%Y-%m-%d %H:%M:%S')}</h2>"
    
        html += f"""
        <div class="lookback-info">
            Note: Completed registrations shown are those completed within the last {COMPLETED_LOOKBACK_DAYS} days.
        </div>
        """
    
        html += '<div class="summary"><h3>Summary</h3>'
        for status, categories in registrations.items():
            total = sum(len(regs) for regs in categories.values())
            html += f"<p><strong>{status}:</strong> {total}"
            if status == 'COMPLETED':
                html += f" (last {COMPLETED_LOOKBACK_DAYS} days)"
            html += "<br>"
            for category, regs in categories.items():
                if regs:
                    html += f"&nbsp;&nbsp;{category}: {len(regs)}<br>"
            html += "</p>"
        grand_total = sum(sum(len(regs) for regs in categories.values()) for categories in registrations.values())
        html += f"<p><strong>Total Registrations:</strong> {grand_total}</p>"
        html += "</div>"
    
        html += '<div class="divider"></div>'
    
        html += "<h3>Detailed Registration Status</h3>"
    
        for status, categories in registrations.items():
            total = sum(len(regs) for regs in categories.values())
            html += f"""
            <div class="registration-group">
                <h3>{status} Registrations (Total: {total})</h3>
            """
    
            for category, regs in categories.items():
                if regs:
                    html += f"""
                    <div class="registration-category">
                        <h4>{category} Registrations ({len(regs)})</h4>
                    """
    
                    for reg in regs:
                        css_class = status.lower().replace('_', '-')
                        html += f"""
                        <div class="registration-item {css_class}">
                            <strong>Registration ID:</strong> {reg['id']}<br>
                            <strong>Type:</strong> {reg['type']}<br>
                            <strong>Status:</strong> {reg['status']}<br>
                            <strong>Version:</strong> {reg['version']}<br>
                            <strong>Console:</strong> <a href="{reg['console_url']}" class="console-link" target="_blank">Open in Console</a><br>
                        """
    
                        if (reg['type'] == 'US_TEN_DLC_BRAND_VETTING' and 
                            status == 'COMPLETED' and 
                            'additional_attributes' in reg and 
                            'VETTING_SCORE' in reg['additional_attributes']):
                            html += f"<strong>Vetting Score:</strong> {reg['additional_attributes']['VETTING_SCORE']}<br>"
    
                        if status == 'REQUIRES_UPDATES' and reg.get('denial_reasons'):
                            html += '<div class="denial-reasons"><strong>Denial Reasons:</strong><ul>'
                            for reason in reg['denial_reasons']:
                                html += f"""
                                <li>
                                    <strong>{reason.get('Reason', 'N/A')}</strong><br>
                                    {reason.get('ShortDescription', 'N/A')}<br>
                                """
                                if reason.get('LongDescription'):
                                    html += f"{reason['LongDescription']}<br>"
                                if reason.get('DocumentationLink'):
                                    html += f'<a href="{reason["DocumentationLink"]}" target="_blank">Documentation</a>'
                                html += "</li>"
                            html += "</ul></div>"
    
                        if status == 'COMPLETED':
                            approved_time = datetime.fromtimestamp(reg['approved_timestamp']).strftime('%Y-%m-%d %H:%M:%S')
                            html += f"<strong>Approved:</strong> {approved_time}<br>"
    
                        html += "</div>"
                    html += "</div>"
            html += "</div>"
    
        html += "</body></html>"
        return html
    
    def send_email(html_content, subject, recipient):
        msg = MIMEMultipart('mixed')
        msg['Subject'] = subject
        msg['From'] = SENDER_EMAIL
        msg['To'] = recipient
    
        html_part = MIMEText(html_content, 'html')
        msg.attach(html_part)
    
        try:
            response = ses_client.send_raw_email(
                Source=msg['From'],
                Destinations=[recipient],
                RawMessage={'Data': msg.as_string()}
            )
            print(f"Email sent! Message ID: {response['MessageId']}")
        except Exception as e:
            print(f"Error sending email: {str(e)}")
            raise e
    
    def lambda_handler(event, context):
        try:
            print("Starting registration categorization...")
            categorize_registrations()
            
            print("Generating HTML report...")
            html_content = generate_html_output()
            
            print("Sending email...")
            subject = f"End User Messaging SMS Registration Status Report - {datetime.now().strftime('%Y-%m-%d %H:%M')}"
            send_email(html_content, subject, RECIPIENT_EMAIL)
            
            return {'statusCode': 200, 'body': json.dumps('Registration status report generated and sent successfully')}
        except Exception as e:
            print(f"Error in lambda execution: {str(e)}")
            return {'statusCode': 500, 'body': json.dumps(f'Error generating report: {str(e)}')}

Reference: Building Lambda functions with Python

Step 4: Set Up EventBridge Rule

  1. Open the Amazon EventBridge console
  2. Click “Create rule”
  3. Name your rule (e.g., “EndUserMessagingRegistrationsMonitorSchedule”)
  4. For the event pattern, choose “Schedule” then select “Continue in EventBridge Scheduler”
  5. Configure your schedule pattern to your requirements (for example, Cron-based schedule to run at specific days and times or rate-based schedule such as every 1 day). Click “Next”.
  6. Select “Lambda” for “Target detail” and select the Lambda function created in Step 3 as the target from the dropdown. Click “Next”.
  7. For permissions:
    1. Select “Create new role for this schedule”
    2. EventBridge will automatically create a role with the necessary permissions to invoke your Lambda function
  8. Click “Next” to review your configuration
  9. Click “Create schedule”

Reference: Amazon EventBridge Scheduler

Step 5: Test the Setup

  1. Open the Lambda console and navigate to your function
  2. Click “Test” and create a test event (you can use an empty JSON object {})
  3. Run the test and check the execution results
  4. Verify that you receive an email report

Reference: Testing Lambda functions in the console

The generated email report provides a clear summary of all registrations, categorized by their status.

Figure 2: The generated email report provides a clear summary of all registrations, categorized by their status.

Understanding the Lambda Function

Let’s break down the key components of our Lambda function:

  1. Initialization: The script sets up necessary AWS clients and defines constants.
  2. categorize_registrations(): This function fetches all registrations and categorizes them based on their status and type.
  3. generate_html_output(): Creates a formatted HTML report of the registration statuses.
  4. send_email(): Uses Amazon SES to send the HTML report via email.
  5. lambda_handler(): The main entry point for the Lambda function, orchestrating the entire process.

The function categorizes registrations into four main statuses:

  • REQUIRES_UPDATES: Registrations that need attention or modifications
  • CREATED: Newly created registrations
  • REVIEWING: Registrations currently under review
  • COMPLETED: Registrations that have been approved recently (within the last 7 days by default)
Detailed view of a registration requiring updates and created registrations pending submission, including specific denial reasons if applicable and direct console links.

Figure 3: Detailed view of a registration requiring updates and created registrations pending submission, including specific denial reasons if applicable and direct console links.

Customization Options

  1. Lookback Period: Modify the COMPLETED_LOOKBACK_DAYS constant to change how far back the function checks for completed registrations.
  2. Email Formatting: Adjust the HTML and CSS in generate_html_output() to customize the email report’s appearance.
  3. Additional Data: Modify the reg_info dictionary in categorize_registrations() to include more data fields in your report.

Monitoring and Maintenance

  1. CloudWatch Logs: Regularly check the Lambda function’s CloudWatch Logs for any errors or unexpected behavior.
  2. Adjusting Schedule: If you find the current schedule doesn’t meet your needs, adjust the EventBridge rule accordingly.

Conclusion

You now have an automated system that monitors your End User Messaging SMS registrations and sends you regular, detailed status reports. This setup provides:

  • Automated visibility into registrations requiring updates or attention
  • Clear tracking of draft registrations awaiting your submission
  • Monitoring of registrations under review
  • Notifications of recently completed registrations
  • A consolidated view of all registration states through formatted email reports

This automated solution eliminates the need for manual status checking and helps ensure timely responses to registration changes. As your messaging needs grow, you can easily customize the monitoring frequency, lookback period, and report format to match your requirements.

Next Steps:

  • Consider adjusting the EventBridge schedule based on your registration volume
  • Customize the email format to highlight information most relevant to your team
  • Set up CloudWatch alarms to monitor the Lambda function’s health
  • Review and update the completed registrations lookback period as needed

For more complex scenarios, consider extending this solution with additional features like Slack notifications, registration metrics tracking, or integration with your ticketing system.


Embracing event driven architecture to enhance resilience of data solutions built on Amazon SageMaker

Post Syndicated from Dhrubajyoti Mukherjee original https://aws.amazon.com/blogs/big-data/embracing-event-driven-architecture-to-enhance-resilience-of-data-solutions-built-on-amazon-sagemaker/

Amazon Web Services (AWS) customers value business continuity while building modern data governance solutions. A resilient data solution helps maximize business continuity by minimizing solution downtime and making sure that critical information remains accessible to users. This post provides guidance on how you can use event driven architecture to enhance the resiliency of data solutions built on the next generation of Amazon SageMaker, a unified platform for data, analytics, and AI. SageMaker is a managed service with high availability and durability. If customers want to build a backup and recovery system on their end, we show you how to do this in this blog. It provides three design principles to improve the data solution resiliency of your organization. In addition, it contains guidance to formulate a robust disaster recovery strategy based on event driven architecture. It contains code samples to back up the system metadata of your data solution built on SageMaker, enabling disaster recovery.

The AWS Well-Architected Framework defines resilience as the ability of a system to recover from infrastructure or service disruptions. You can enhance the resiliency of your data solution by adopting three design principles that are highlighted in this post and by establishing a robust disaster recovery strategy. Recovery point objective (RPO) and recovery time objective (RTO) are industry standard metrics to measure the resilience of a system. RPO indicates how much data loss your organization can accept in case of solution failure. RTO refers to the time for the solution to recover after failure. You can measure these metrics in seconds, minutes, hours, or days. The next section discusses how you can align your data solution resiliency strategy to meet the needs of your organization.

Formulating a strategy to enhance data solution resilience

To develop a robust resiliency strategy for your data solution built on SageMaker, start with how users interact with the data solution. The user interaction influences the data solution architecture, the degree of automation, and determines your resiliency strategy. Here are a few aspects you might consider while designing the resiliency of your data solution.

  • Data solution architecture – The data solution of your organization might follow a centralized, decentralized, or hybrid architecture. This architecture pattern reflects the distribution of responsibilities of the data solution based on the data strategy of your organization. This shift in responsibilities is reflected in the structure of the teams that perform activities in the Amazon DataZone data portal, SageMaker Unified Studio portal, AWS Management Console, and underlying infrastructure. Examples of such activities include configuring and running the data sources, publishing data assets in the data catalog, subscribing to data assets, and assigning members to projects.
  • User persona – The user persona, their data, and cloud maturity influence their preferences for interacting with the data solution. The users of a data governance solution fall into two categories: business users and technical users. Business users of your organization might include data owners, data stewards, and data analysts. They might find the Amazon DataZone data portal and SageMaker Unified Studio portal more convenient for tasks such as approving or rejecting subscription requests and performing one-time queries. Technical users such as data solution administrators, data engineers, and data scientists might opt for automation when making system changes. Examples of such activities include publishing data assets, managing glossary and metadata forms in the Amazon DataZone data portal or in SageMaker Unified Studio portal. A robust resiliency strategy accounts for tasks performed by both user groups.
  • Empowerment of self-service – The data strategy of your organization determines autonomy granted to the users. Increased user autonomy demands a high level of abstraction of the cloud infrastructure powering the data solution. SageMaker empowers self-service by enabling users to perform regular data management activities in the Amazon DataZone data portal and in the SageMaker Unified Studio portal. The level of self-service maturity of the data solution depends on the data strategy and user maturity of your organization. At an early stage, you might limit the self-service features to the use cases for onboarding the data solution. As the data solution scales, consider increasing the self-service capabilities. See Data Mesh Strategy Framework to learn about the different phases of a data mesh-based data solution.

Adopt the following design principles to enhance the resiliency of your data solution:

  • Choose serverless services – Use serverless AWS services to build your data solution. Serverless services scale automatically with increasing system load, provide fault isolation, and have built-in high-availability. Serverless services minimize the need for infrastructure management, reducing the need to design resiliency into the infrastructure. SageMaker seamlessly integrates with several serverless services such Amazon Simple Storage Service (Amazon S3), AWS Glue, AWS Lake Formation, and Amazon Athena.
  • Document system metadata – Document the system metadata of your data solution using infrastructure-as-code (IaC) and automation. Consider how users interact with the data solution. If the users prefer to perform certain activities through the Amazon DataZone data portal and SageMaker Unified Studio portal, implement automation to capture and store the metadata that’s relevant for disaster recovery. Use Amazon Relational Database Service (Amazon RDS) and Amazon DynamoDB to store the system metadata of your data solution.
  • Monitor system health – Implement a monitoring and alerting solution for your data solution so that you can respond to service interruptions and initiate the recovery process. Make sure that system activities are logged so that you can troubleshoot the system interruption. Amazon CloudWatch helps you monitor AWS resources and the applications you run on AWS in real time.

The next section presents disaster recovery strategies to recover your data solution built on SageMaker.

Disaster recovery strategies

Disaster recovery focuses on one-time recovery objectives in response to natural disasters, large-scale technical failures, or human threats such as attack or error. Disaster recovery is a crucial part of your business continuity plan. As shown in the following figure, AWS offers the following options for disaster recovery: Backup and restore, pilot light, warm standby, and multi-site active/active.

The business continuity requirements and cost of recovery should guide your organization’s disaster recovery strategy. As a general guideline, the recovery cost of your data solution increases with reduced RPO and RTO requirements. The next section provides architecture patterns to implement a robust backup and recovery solution for a data solution built on SageMaker.

Solution overview

This section provides event-driven architecture patterns following the backup and restore approach to enhance resiliency of your data solution. This active/passive strategy-based solution stores the system metadata in a DynamoDB table. You can use the system metadata to restore your data solution. The following architecture patterns provide regional resilience. You can simplify the architecture of this solution to restore data in a single AWS Region.

Pattern 1: Point-in-time backup

The point-in-time backup captures and stores system metadata of a data solution built on SageMaker when a user or an automation performs an action. In this pattern, a user activity or an automation initiates an event that captures the system metadata. This pattern is suited for low RPO requirements, ranging from seconds to minutes. The following architecture diagram shows the solution for the point-in-time backup process.

Architecture point-in-time-backup

The steps comprise the following.

  1. User or automation performs an activity on an Amazon DataZone domain or Amazon Unified Studio domain.
  2. This activity creates a new event in AWS CloudTrail.
  3. The CloudTrail event is sent to Amazon EventBridge. Alternatively, you can use Amazon DataZone as the event source for the EventBridge rule.
  4. AWS Lambda transforms and stores this event in a DynamoDB global table where the Amazon DataZone domain is hosted.
  5. The information is replicated into the replica DynamoDB table in a secondary Region. The replica DynamoDB table can be used to restore the data solution based on SageMaker in the secondary Region.

Pattern 2: Scheduled backup

The scheduled backup captures and stores system metadata of a data solution built on SageMaker at regular intervals. In this pattern, an event is initiated based on a defined time schedule. This pattern is suited for RPO requirements in the order of hours. The following architecture diagram displays the solution for point-in-time backup process.

The steps comprise the following.

  1. EventBridge triggers an event at regular interval and sends this event to AWS Step Functions.
  2. The Step Functions state machine contains multiple Lambda functions. These Lambda functions get the system metadata from either a SageMaker Unified Studio domain or an Amazon DataZone domain.
  3. The system metadata is stored in an DynamoDB global table in the primary Region where the Amazon DataZone domain is hosted.
  4. The information is replicated into the replica DynamoDB table in a secondary Region. The data solution can be restored in the secondary Region using the replica DynamoDB table.

The next section provides step by step instructions to deploy a code sample that implements the scheduled backup pattern. This code sample stores asset information of a data solution built on a SageMaker Unified Studio domain and an Amazon DataZone domain in an DynamoDB global table. The data in the DynamoDB table is encrypted at rest using a customer managed key stored in AWS Key Management Service (AWS KMS). A multi-Region replica key encrypts the data in the secondary Region. The asset uses the data lake blueprint that contains the definition for launching and configuring a set of services (AWS Glue, Lake Formation, and Athena) to publish and use data lake assets in the business data catalog. The code sample uses the AWS Cloud Development Kit (AWS CDK) to deploy the cloud infrastructure.

Prerequisites

  • An active AWS account.
  • AWS administrator credentials for the central governance account in your development environment
  • AWS Command Line Interface (AWS CLI) installed to manage your AWS services from the command line (recommended)
  • Node.js and Node Package Manager (npm) installed to manage AWS CDK applications
  • AWS CDK Toolkit installed globally in your development environment by using npm, to synthesize and deploy AWS CDK applications
npm install -g aws-cdk
  • TypeScript installed in your development environment or installed globally by using npm compiler:
npm install -g typescript
  • Docker installed in your development environment (recommended)
  • An integrated development environment (IDE) or text editor with support for Python and TypeScript (recommended)

Walkthrough for data solutions built on a SageMaker Unified Studio domain

This section provides step by step instructions to deploy a code sample that implements the scheduled backup pattern for data solutions built on a SageMaker Unfied Studio domain.

Set up SageMaker Unified Studio

  1. Sign into the IAM console. Create an IAM role that trusts Lambda with the following policy.
{
    "Version": "2012-10-17",
    "Statement": [
        {
            "Sid": "VisualEditor0",
            "Effect": "Allow",
            "Action": "datazone:Search",
            "Resource": "*"
        },
        {
            "Sid": "VisualEditor1",
            "Effect": "Allow",
            "Action": [
                "dynamodb:PutItem"
            ],
            "Resource": "arn:aws:dynamodb:<AWS_REGION>:<AWS_ACCOUNT>:table/*"
        },
        {
            "Sid": "VisualEditor2",
            "Effect": "Allow",
            "Action": [
                "kms:Decrypt",
                "kms:Encrypt",
                "kms:GenerateDataKey",
                "kms:ReEncrypt*",
                "kms:DescribeKey"
            ],
            "Resource": "arn:aws:kms:<AWS_REGION>:<AWS_ACCOUNT>:key/<KMS_KEY_ID>"
        },
        {
            "Sid": "VisualEditor3",
            "Effect": "Allow",
            "Action": [
                "logs:CreateLogGroup",
                "logs:CreateLogStream",
                "logs:PutLogEvents"
            ],
            "Resource": [
                "arn:aws:logs:<AWS_REGION>:<AWS_ACCOUNT>:log-group:*:log-stream:*",
                "arn:aws:logs:<AWS_REGION>:<AWS_ACCOUNT>:log-group:*"
            ]
        }
    ]
}
  1. Note down the Amazon Resource Name (ARN) of the Lambda role. Navigate to SageMaker and choose Create a Unified Studio domain.
  2. Select Quick setup and expand the Quick setup settings section. Enter a domain name, for example, CORP-DEV-SMUS. Select the Virtual private cloud (VPC) and Subnets. Choose Continue.
  3. Enter the email address of the SageMaker Unified Studio user in the Create IAM Identity Center user section. Choose Create domain.
  4. After the domain is created, choose Open unified studio in the top right corner. Screenshot open-smus
  5. Sign in to SageMaker Unified Studio using the single sign-on (SSO) credentials of your user. Choose Create project at the top right corner. Enter a project name and description, choose Continue twice, and choose Create project. Wait unti project creation is complete. Screenshot create-smus-project
  6. After the project is created, go into the project by selecting the project name. Select Query Editor from the Build drop-down menu on the top left. Paste the following create table as select (CTAS) query script in the query editor window and run it to create a new table named mkt_sls_table as described in Produce data for publishing. The script creates a table with sample marketing and sales data.
CREATE TABLE mkt_sls_table AS
SELECT 146776932 AS ord_num, 23 AS sales_qty_sld, 23.4 AS wholesale_cost, 45.0 as lst_pr, 43.0 as sell_pr, 2.0 as disnt, 12 as ship_mode,13 as warehouse_id, 23 as item_id, 34 as ctlg_page, 232 as ship_cust_id, 4556 as bill_cust_id
UNION ALL SELECT 46776931, 24, 24.4, 46, 44, 1, 14, 15, 24, 35, 222, 4551
UNION ALL SELECT 46777394, 42, 43.4, 60, 50, 10, 30, 20, 27, 43, 241, 4565
UNION ALL SELECT 46777831, 33, 40.4, 51, 46, 15, 16, 26, 33, 40, 234, 4563
UNION ALL SELECT 46779160, 29, 26.4, 50, 61, 8, 31, 15, 36, 40, 242, 4562
UNION ALL SELECT 46778595, 43, 28.4, 49, 47, 7, 28, 22, 27, 43, 224, 4555
UNION ALL SELECT 46779482, 34, 33.4, 64, 44, 10, 17, 27, 43, 52, 222, 4556
UNION ALL SELECT 46779650, 39, 37.4, 51, 62, 13, 31, 25, 31, 52, 224, 4551
UNION ALL SELECT 46780524, 33, 40.4, 60, 53, 18, 32, 31, 31, 39, 232, 4563
UNION ALL SELECT 46780634, 39, 35.4, 46, 44, 16, 33, 19, 31, 52, 242, 4557
UNION ALL SELECT 46781887, 24, 30.4, 54, 62, 13, 18, 29, 24, 52, 223, 4561Screenshot create-smus-asset
  1. Navigate to Data sources from the Project. Choose Run in the Actions section next to the project.default_lakehouse connection. Wait until the run is complete.Screeshot run-smus-data-source
  2. Navigate to Assets in the left side bar. Select the mkt_sls_table in the Inventory section and review the metadata that was generated. Choose Accept All if you’re satisfied with the metadata.Screenshot smus-assets
  3. Choose Publish Asset to publish the mkt_sls_table table to the business data catalog, making it discoverable and understandable across your organization.
  4. Choose Members in the navigation pane. Choose Add members and select the IAM role you created in Step 1. Add the role as a Contributor in the project.

Deployment steps

After setting up SageMaker Unified Studio, use the AWS CDK stack provided on GitHub to deploy the solution to back up the asset metadata that is created in the previous section.

  1. Clone the repository from GitHub to your preferred integrated development environment (IDE) using the following commands.
git clone https://github.com/aws-samples/sample-event-driven-resilience-data-solutions-sagemaker.git
cd sample-event-driven-resilience-data-solutions-sagemaker
  1. Export AWS credentials and the primary Region to your development environment for the IAM role with administrative permissions, use the following format
export AWS_REGION=
export AWS_ACCESS_KEY_ID=
export AWS_SECRET_ACCESS_KEY=
export AWS_SESSION_TOKEN=

In a production environment, use AWS Secrets Manager or AWS Systems Manager Parameter Store to manage credentials. Automate the deployment process using a continuous integration and delivery (CI/CD) pipeline.

  1. Bootstrap the AWS account in the primary and secondary Regions by using AWS CDK and running the following command.
cdk bootstrap aws://<AWS_ACCOUNT_ID>/<AWS_REGION>
cdk bootstrap aws://<AWS_ACCOUNT_ID>/<AWS_SECONDARY_REGION>
cd unified-studio
  1. Modify the following parameters in the config/Config.ts file.
SMUS_APPLICATION_NAME – Name of the application.
SMUS_SECONDARY_REGION – Secondary AWS region for backup.
SMUS_BACKUP_INTERVAL_MINUTES – Minutes before each backup interval. 
SMUS_STAGE_NAME – Name of the stage. 
SMUS_DOMAIN_ID – Domain identifier of the Amazon SageMaker Unified Studio. 
SMUS_PROJECT_ID – Project identifier of the Amazon SageMaker Unified Studio. 
SMUS_ASSETS_REGISTRAR_ROLE_ARN – ARN of the AWS Lambda role created in step 1 of the preceding section. 
  1. Install the dependencies by running the following command:

npm install

  1. Synthesize the CloudFormation template by running the following command.

cdk synth

  1. Deploy the solution by running the following command.

cdk deploy –all

  1. After the deployment is complete, sign in to your AWS account and navigate to the CloudFormation console to verify that the infrastructure deployed.

When deployment is complete, wait for the duration of DZ_BACKUP_INTERVAL_MINUTES. Navigate to the <DZ_APPLICATION_NAME >AssetsInfo DynamoDB table. Retrieve the data from the DynamoDB table. The following screenshot shows the data in the Items returned section. Verify the same data in the secondary Region.Screenshot smus-dynamodb

Clean up

Use the following steps to clean up the resources deployed.

  1. Empty the S3 buckets that were created as part of this deployment.
  2. In your local development environment (Linux or macOS):
  3. Navigate to the unified-studio directory of your repository.
  4. Export the AWS credentials for the IAM role that you used to create the AWS CDK stack.
  5. To destroy the cloud resources, run the following command:

cdk destroy --all

  1. Go to the SageMaker Unified Studio and delete the published data assets that were created in the project.
  2. Use the console to delete the SageMaker Unified Studio domain.

Walkthrough for data solutions built on an Amazon DataZone domain

This section provides step by step instructions to deploy a code sample that implements the scheduled backup pattern for data solutions built on an Amazon DataZone domain.

Deployment steps

After completing the prerequisites, use the AWS CDK stack provided on GitHub to deploy the solution to backup system metadata of the data solution built on Amazon DataZone domain

  1. Clone the repository from GitHub to your preferred IDE using the following commands.
git clone https://github.com/aws-samples/sample-event-driven-resilience-data-solutions-sagemaker.git
cd event-driven-resilience-sagemaker
  1. Export AWS credentials and the primary Region information to your development environment for the AWS Identity and Access Management (IAM) role with administrative permissions, use the following format:
export AWS_REGION=
export AWS_ACCESS_KEY_ID=
export AWS_SECRET_ACCESS_KEY=
export AWS_SESSION_TOKEN=

In a production environment, use Secrets Manager or Systems Manager Parameter Store to manage credentials. Automate the deployment process using a CI/CD pipeline.

  1. Bootstrap the AWS account in the primary and secondary Regions by using AWS CDK and running the following command:
cdk bootstrap aws://<AWS_ACCOUNT_ID>/<AWS_REGION>
cdk bootstrap aws://<AWS_ACCOUNT_ID>/<AWS_SECONDARY_REGION>
cd datazone
  1. From the console for IAM, note the Amazon Resource Name (ARN) of the CDK execution role. Update the trust relationship of the IAM role so that Lambda can assume the role.
  1. Modify the following parameters in the config/Config.ts file.
DZ_APPLICATION_NAME – Name of the application.
DZ_SECONDARY_REGION – Secondary Region for backup.
DZ_BACKUP_INTERVAL_MINUTES – Minutes before each backup interval.
DZ_STAGE_NAME – Name of the stage (dev, qa, or prod).
DZ_DOMAIN_NAME – Name of the Amazon DataZone domain
DZ_DOMAIN_DESCRIPTION – Description of the Amazon DataZone domain
DZ_DOMAIN_TAG – Tag of the Amazon DataZone domain
DZ_PROJECT_NAME – Name of the Amazon DataZone project
DZ_PROJECT_DESCRIPTION – Description of the Amazon DataZone project
CDK_EXEC_ROLE_ARN – ARN of the CDK execution role
DZ_ADMIN_ROLE_ARN – ARN of the administrator role
  1. Install the dependencies by running the following command:

npm install

  1. Synthesize the AWS CloudFormation template by running the following command:

cdk synth

  1. Deploy the solution by running the following command:

cdk deploy --all

  1. After the deployment is complete, sign in to your AWS account and navigate to the CloudFormation console to verify that the infrastructure deployed.

Document system metadata

This section provides instructions to create an asset and demonstrates how you can retrive the metadata of the asset. Perform the following steps to retrieve the systems metadata.

  1. Sign in to the Amazon DataZone data portal from the console. Select the project and choose Query data at the upper right.

Screenshot datazone-open-query

  1. Choose Open Athena and make sure that <DZ_PROJECT_NAME>_DataLakeEnvironment is selected in the Amazon DataZone environment dropdown at the upper right and that on the left, and that <DZ_PROJECT_NAME>_datalakeenvironment_pub_db is selected as the Database.
  2. Create a new AWS Glue table for publishing to Amazon DataZone. Paste the following create table as select (CTAS) query script in the Query window and run it to create a new table named mkt_sls_table as described in Produce data for publishing. The script creates a table with sample marketing and sales data.
CREATE TABLE mkt_sls_table AS
SELECT 146776932 AS ord_num, 23 AS sales_qty_sld, 23.4 AS wholesale_cost, 45.0 as lst_pr, 43.0 as sell_pr, 2.0 as disnt, 12 as ship_mode,13 as warehouse_id, 23 as item_id, 34 as ctlg_page, 232 as ship_cust_id, 4556 as bill_cust_id
UNION ALL SELECT 46776931, 24, 24.4, 46, 44, 1, 14, 15, 24, 35, 222, 4551
UNION ALL SELECT 46777394, 42, 43.4, 60, 50, 10, 30, 20, 27, 43, 241, 4565
UNION ALL SELECT 46777831, 33, 40.4, 51, 46, 15, 16, 26, 33, 40, 234, 4563
UNION ALL SELECT 46779160, 29, 26.4, 50, 61, 8, 31, 15, 36, 40, 242, 4562
UNION ALL SELECT 46778595, 43, 28.4, 49, 47, 7, 28, 22, 27, 43, 224, 4555
UNION ALL SELECT 46779482, 34, 33.4, 64, 44, 10, 17, 27, 43, 52, 222, 4556
UNION ALL SELECT 46779650, 39, 37.4, 51, 62, 13, 31, 25, 31, 52, 224, 4551
UNION ALL SELECT 46780524, 33, 40.4, 60, 53, 18, 32, 31, 31, 39, 232, 4563
UNION ALL SELECT 46780634, 39, 35.4, 46, 44, 16, 33, 19, 31, 52, 242, 4557
UNION ALL SELECT 46781887, 24, 30.4, 54, 62, 13, 18, 29, 24, 52, 223, 4561Screenshot datazone-run-query
  1. Go to the Tables and Views section and verify that the mkt_sls_table table was successfully created.
  2. In the Amazon DataZone Data Portal, go to Data sources, select the <DZ_PROJECT_NAME>-DataLakeEnvironment-default-datasource, and choose Run. The mkt_sls_table will be listed in the inventory and available to publish.Screenshot run-data-source
  3. Select the mkt_sls_table table and review the metadata that was generated. Choose Accept All if you’re satisfied with the metadata.Screeshot publish-data-asset
  4. Choose Publish Asset and the mkt_sls_table table will be published to the business data catalog, making it discoverable and understandable across your organization.
  5. After the table is published, wait for the duration of DZ_BACKUP_INTERVAL_MINUTES. Navigate to the <DZ_APPLICATION_NAME >AssetsInfo DynamoDB table and retrieve the data from the table. The following screenshot shows the data in the Items returned section. Verify the same data in the secondary Region.Screenshot datazone-dynamodb

Clean up

Use the following steps to clean up the resources deployed.

  1. Empty the Amazon Simple Storage Service (Amazon S3) buckets that were created as part of this deployment.
  2. Go to the Amazon DataZone domain portal and delete the published data assets that were created in the Amazon DataZone project.
  3. In your local development environment (Linux or macOS):
  • Navigate to the datazone directory of your repository.
  • Export the AWS credentials for the IAM role that you used to create the AWS CDK stack.
  • To destroy the cloud resources, run the following command:

cdk destroy --all

Conclusion

This post explores how to build a resilient data governance solution on Amazon SageMaker. Resilient design principles and a robust disaster recovery strategy are central to the business continuity of AWS customers. The code samples included in this post implement a backup process of the data solution at regular time interval. They store the Amazon SageMaker asset information in Amazon DynamoDB Global tables. You can extend the backup solution by identifying the system metadata that is relevant for the data solution of your organization and by using Amazon SageMaker APIs to capture and store the metadata. The DynamoDB Global table replicates the changes in the DynamoDB table in the primary region to the secondary region in an asynchronous manner. Consider Implementing an additional layer of resiliency by using AWS Backup to back up the DynamoDB table at regular interval. In the next post, we show how you can use the system metadata to restore your data solution in the secondary region.

Adopt the resiliency features offered by Amazon DataZone and Amazon SageMaker Unified Studio. Use AWS Resilience Hub to assess the resilience of your data solution. AWS Resilience Hub helps you to define your resilience goals, assess your resilience posture against those goals, and implement recommendations for improvement based on the AWS Well-Architected Framework.

To build a data mesh based data solution using Amazon DataZone domain, see our GitHub repository. This open source project provides a step-by-step blueprint for constructing a data mesh architecture using the powerful capabilities of Amazon SageMaker, AWS Cloud Development Kit (AWS CDK), and AWS CloudFormation.


About the authors

BDB-4558-DhrubaDhrubajyoti Mukherjee is a Cloud Infrastructure Architect with a strong focus on data strategy, data governance, and artificial intelligence at Amazon Web Services (AWS). He uses his deep expertise to provide guidance to global enterprise customers across industries, helping them build scalable and secure cloud solutions that drive meaningful business outcomes. Dhrubajyoti is passionate about creating innovative, customer-centric solutions that enable digital transformation, business agility, and performance improvement. Outside of work, Dhrubajyoti enjoys spending quality time with his family and exploring nature through his love of hiking mountains.

Architecture patterns to optimize Amazon Redshift performance at scale

Post Syndicated from Eddie Yao original https://aws.amazon.com/blogs/big-data/architecture-patterns-to-optimize-amazon-redshift-performance-at-scale/

Tens of thousands of customers use Amazon Redshift as a fully managed, petabyte-scale data warehouse service in the cloud. As an organization’s business data grows in volume, the data analytics need also grows. Amazon Redshift performance needs to be optimized at scale to achieve faster, near real-time business intelligence (BI). You might also consider optimizing Amazon Redshift performance when your data analytics workloads or user base increases, or to meet a data analytics performance service level agreement (SLA). You can also look for ways to optimize Amazon Redshift data warehouse performance after you complete an online analytical processing (OLAP) migration from another system to Amazon Redshift.

In this post, we will show you five Amazon Redshift architecture patterns that you can consider to optimize your Amazon Redshift data warehouse performance at scale using features such as Amazon Redshift Serverless, Amazon Redshift data sharing, Amazon Redshift Spectrum, zero-ETL integrations, and Amazon Redshift streaming ingestion.

Use Amazon Redshift Serverless to automatically provision and scale your data warehouse capacity

To start, let’s review using Amazon Redshift Serverless to automatically provision and scale your data warehouse capacity. The architecture is shown in the following diagram and includes different components within Amazon Redshift Serverless like ML-based workload monitoring and automatic workload management.

Amazon Redshift Serverless architecture diagram

Amazon Redshift Serverless architecture diagram

Amazon Redshift Serverless is a deployment model that you can use to run and scale your Redshift data warehouse without managing infrastructure. Amazon Redshift Serverless will automatically provision and scale your data warehouse capacity to deliver fast performance for even the most demanding, unpredictable, or massive workloads.

Amazon Redshift Serverless measures data warehouse capacity in Redshift Processing Units (RPUs). You pay for the workloads you run in RPU-hours on a per-second basis. You can optionally configure your Base, Max RPU-Hours, and MaxRPU parameters to modify your warehouse performance costs. This post dives deep into understanding cost mechanisms to consider when managing Amazon Redshift Serverless.

Amazon Redshift Serverless scaling is automatic and based on your RPU capacity. To further optimize scaling operations for large scale datasets, Amazon Redshift Serverless has AI-driven scaling and optimization. It uses AI to scale automatically with workload changes across key metrics such as data volume changes, concurrent users, and query complexity, accurately meeting your price performance targets.

There is no maintenance window in Amazon Redshift Serverless, because software version updates are applied automatically. This maintenance occurs with no interruptions for any existing connections or query executions. Make sure to consult the considerations guide to better understand the operation of Amazon Redshift Serverless.

You can migrate from an existing provisioned Amazon Redshift data warehouse to Amazon Redshift Serverless by creating a snapshot of your current provisioned data warehouse and then restoring that snapshot in Amazon Redshift Serverless. Amazon Redshift will automatically convert interleaved keys to compound keys when you restore a provisioned data warehouse snapshot to a Serverless namespace. You can also get started with a new Amazon Redshift Serverless data warehouse.

Amazon Redshift Serverless use cases

You can use Amazon Redshift Serverless for:

  • Self-service analytics
  • Auto scaling for unpredictable or variable workloads
  • New applications
  • Multi-tenant applications

With Amazon Redshift, you can access and query data stored in Amazon S3 Tables – fully managed Apache Iceberg tables optimized for analytics workloads. Amazon Redshift also supports querying data stored using Apache Iceberg tables, and other open table formats like Apache Hudi and Linux Foundation Delta Lake, for more information see External tables for Redshift Spectrum and Expand data access through Apache Iceberg using Delta Lake UniForm on AWS.

You can also use Amazon Redshift Serverless with Amazon Redshift data sharing, which can automatically scale your large dataset in independent datashares and maintain workload isolation controls.

Amazon Redshift data sharing to share live data between separate Amazon Redshift data warehouses

Next, we will look at an Amazon Redshift data sharing architecture pattern, shown in below diagram, to share data between a hub Amazon Redshift data warehouse and spoke Amazon Redshift data warehouses , and to share data across multiple Amazon Redshift data warehouses with each other.

Amazon Redshift data sharing architecture patterns diagram

Amazon Redshift data sharing architecture patterns diagram

With Amazon Redshift data sharing, you can securely share access to live data between separate Amazon Redshift data warehouses without manually moving or copying the data. Because the data is live, all users can see the most up-to-date and consistent information in Amazon Redshift as soon as it’s updated using separate dedicated resources. Because the compute accessing the data is isolated, you can size the data warehouse configurations to individual workload price performance requirements rather than the aggregate of all workloads. This also provides additional flexibility to scale with new workloads without affecting the workloads already being run on Amazon Redshift.

A datashare is the unit of sharing data in Amazon Redshift. A producer data warehouse administrator can create datashares and add datashare objects to share data with other data warehouses, referred to as outbound shares. A consumer data warehouse administrator can receive datashares from other data warehouses, referred to as inbound shares.

To get started, a producer data warehouse needs to add all objects (and potential permissions) that need to be accessed by another data warehouse to a datashare, and share that datashare with a consumer. After that consumer creates a database from the datashare, the shared objects can be accessed using three-part notation consumer_database_name.schema_name.table_name on the consumer, using the consumer’s compute.

Amazon Redshift data sharing use cases

Amazon Redshift data sharing, including multi-warehouse writes in Amazon Redshift, can be used to:

  • Support different kinds of business-critical workloads, including workload isolation and chargeback for individual workloads.
  • Enable cross-group collaboration across teams for broader analytics, data science, and cross-product impact analysis.
  • Deliver data as a service.
  • Share data between environments to improve team agility by sharing data at different granularity levels such as development, test, and production.
  • License access to data in Amazon Redshift by listing Amazon Redshift data sets in the AWS Data Exchange catalog so that customers can find, subscribe to, and query the data in minutes.
  • Update business source data on the producer. You can share data as a service across your organization, but then consumers can also perform actions on the source data.
  • Insert additional records on the producer. Consumers can add records to the original source data.

The following articles provide examples of how you can use Amazon Redshift data sharing to scale performance:

Amazon Redshift Spectrum to query data in Amazon S3

You can use Amazon Redshift Spectrum to query data in , as shown in below diagram using AWS Glue Data Catalog.

Amazon Redshift Spectrum architecture diagram

Amazon Redshift Spectrum architecture diagram

You can use Amazon Redshift Spectrum to efficiently query and retrieve structured and semi-structured data from files in Amazon S3 without having to directly load data into Amazon Redshift tables. Using the large, parallel scale of the Amazon Redshift Spectrum layer, you can run massive, fast, parallel queries against large datasets while most of the data remains in Amazon S3. This can significantly improve the performance and cost-effectiveness of massive analytics workloads, because you can use the scalable storage of Amazon S3 to handle large volumes of data while still benefiting from the powerful query processing capabilities of Amazon Redshift.

Amazon Redshift Spectrum uses separate infrastructure independent of your Amazon Redshift data warehouse, offloading many compute-intensive tasks, such as predicate filtering and aggregation. This means that you can use significantly less data warehouse processing capacity than other queries. Amazon Redshift Spectrum can also automatically scale to potentially thousands of instances, based on the demands of your queries.

When implementing Amazon Redshift Spectrum, make sure to consult the considerations guide which details how to configure your networking, external table creation, and permissions requirements.

Review this best practices guide and this blog post, which outlines recommendations on how to optimize performance including the impact of different file types, how to design around the scaling behavior, and how you can efficiently partition files. You can check out an example architecture in Accelerate self-service analytics with Amazon Redshift Query Editor V2.

To get started with Amazon Redshift Spectrum, you define the structure for your files and register them as an external table in an external data catalog (AWS Glue, Amazon Athena, and Apache Hive metastore are supported). After creating your external table, you can query your data in Amazon S3 directly from Amazon Redshift.

Amazon Redshift Spectrum use cases

You can use Amazon Redshift Spectrum in the following use cases:

  • Huge volume but less frequently accessed data, build lake house architecture to query exabytes of data in an S3 data lake
  • Heavy scan- and aggregation-intensive queries
  • Selective queries that can use partition pruning and predicate pushdown, so the output is fairly small

Zero-ETL to unify all data and achieve near real-time analytics

You can use Zero-ETL integration with Amazon Redshift to integrate with your transactional databases like Amazon Aurora MySQL-Compatible Edition, so you can run near real-time analytics in Amazon Redshift, or BI in Amazon QuickSight, or machine learning workload in Amazon SageMaker AI, shown in below diagram.

Zero-ETL integration with Amazon Redshift architecture diagram

Zero-ETL integration with Amazon Redshift architecture diagram

Zero-ETL integration with Amazon Redshift removes the undifferentiated heavy lifting to build and manage complex extract, transform, and load (ETL) data pipelines; unifies data across databases, data lakes, and data warehouses; and makes data available in Amazon Redshift in near real time for analytics, artificial intelligence (AI) and machine learning (ML) workloads.

Currently Amazon Redshift supports the following zero-ETL integrations:

To create a zero-ETL integration, you specify an integration source, such as an Amazon Aurora DB cluster, and an Amazon Redshift data warehouse, such as Amazon Redshift Serverless workgroup or a provisioned data warehouse (including Multi-AZ deployment on RA3 clusters to automatically recover from any infrastructure or Availability Zone failures and help ensure that your workloads remain uninterrupted), as the target. The integration replicates data from the source to the target and makes data available in the target data warehouse within seconds. The integration also monitors the health of the integration pipeline and recovers from issues when possible.

Make sure to review considerations, limitations, and quotas on both the data source and target when using zero-ETL integrations with Amazon Redshift.

Zero-ETL integration use cases

You can use zero-ETL integration with Amazon Redshift as an architecture pattern to boost analytical query performance at scale, enable a straightforward and secure way to create near real-time analytics on petabytes of transactional data, with continuous change-data-capture (CDC). Plus, you can use other Amazon Redshift capabilities such as built-in machine learning, materialized views, data sharing, and federated access to multiple data stores and data lakes. You can see more other zero-ETL integrations use cases at What is ETL.

Ingest streaming data into Amazon Redshift data warehouse for near real-time analytics

You can ingest streaming data with Amazon Kinesis Data Streams or Amazon Managed Streaming for Apache Kafka (Amazon MSK) to Amazon Redshift and run near real-time analytics in Amazon Redshift, as shown in the following diagram.

Amazon Redshift data streaming architecture diagram

Amazon Redshift data streaming architecture diagram

Amazon Redshift streaming ingestion provides low-latency, high-speed data ingestion directly from Amazon Kinesis Data Streams or Amazon MSK to an Amazon Redshift provisioned or Amazon Redshift Serverless data warehouse, without staging data in Amazon S3. You can connect to and access the data from the stream using standard SQL and simplify data pipelines by creating materialized views in Amazon Redshift on top of the data stream. For best practices, you can review these blog posts:

To get started on Amazon Redshift streaming ingestion, you create an external schema that maps to the streaming data source and create a materialized view that references the external schema. For details on how to set up Amazon Redshift streaming ingestion for Amazon KDS, see Getting started with streaming ingestion from Amazon Kinesis Data Streams. For details on how to set up Amazon Redshift streaming ingestion for Amazon MSK, see Getting started with streaming ingestion from Apache Kafka sources.

Amazon Redshift streaming ingestion use cases

You can use Amazon Redshift streaming ingestion to:

  • Improve gaming experience by analyzing real-time data from gamers
  • Analyze real-time IoT data and use machine learning (ML) within Amazon Redshift to improve operations, predict customer churn, and grow your business
  • Analyze clickstream user data
  • Conduct real-time troubleshooting by analyzing streaming data from log files
  • Perform near real-time retail analytics on streaming point of sale (POS) data

Other Amazon Redshift features to optimize performance

There are other Amazon Redshift features that you can use to optimize performance.

  • You can resize Amazon Redshift provisioned clusters to optimize data warehouse compute and storage use.
  • You can use concurrency scaling, where Amazon Redshift provisioning automatically adds additional capacity to process increases in read, such as dashboard queries; and write operations, such as data ingestion and processing.
  • You can also consider materialized views in Amazon Redshift, applicable to both provisioned and serverless data warehouses, which contains a precomputed result set, based on an SQL query over one or more base tables. They are especially useful for speeding up queries that are predictable and repeated.
  • You can use auto-copy for Amazon Redshift to set up continuous file ingestion from your Amazon S3 prefix and automatically load new files to tables in your Amazon Redshift data warehouse without the need for additional tools or custom solutions.

Cloud security at AWS is the highest priority. Amazon Redshift offers broad security-related configurations and controls to help ensure information is appropriately protected. See Amazon Redshift Security Best Practices for a comprehensive guide to Amazon Redshift security best practices.

Conclusion

In this post, we reviewed Amazon Redshift architecture patterns and features that you can use to help scale your data warehouse to dynamically accommodate different workload combinations, volumes, and data sources to achieve optimal price performance. You can use them alone or together—choosing the best infrastructural set up for your use case requirements—and scale to accommodate for any future growth.

Get started with these Amazon Redshift architecture patterns and features today by following the instructions provided in each section. If you have questions or suggestions, leave a comment below.


About the authors

Eddie Yao is a Principal Technical Account Manager (TAM) at AWS. He helps enterprise customers build scalable, high-performance cloud applications and optimize cloud operations. With over a decade of experience in web application engineering, digital solutions, and cloud architecture, Eddie currently focuses on Media & Entertainment (M&E) and Sports industries and AI/ML and generative AI.

Julia Beck is an Analytics Specialist Solutions Architect at AWS. She supports customers in validating analytics solutions by architecting proof of concept workloads designed to meet their specific needs.

Scott St. Martin is a Solutions Architect at AWS who is passionate about helping customers build modern applications. Scott uses his decade of experience in the cloud to guide organizations in adopting best practices around operational excellence and reliability, with a focus the manufacturing and financial services spaces. Outside of work, Scott enjoys traveling, spending time with family, and playing piano.

Best practices for upgrading Amazon MWAA environments

Post Syndicated from Anurag Srivastava original https://aws.amazon.com/blogs/big-data/best-practices-for-upgrading-amazon-mwaa-environments/

Amazon Managed Workflows for Apache Airflow (Amazon MWAA) has become a cornerstone for organizations embracing data-driven decision-making. As a scalable solution for managing complex data pipelines, Amazon MWAA enables seamless orchestration across AWS services and on-premises systems. Although AWS manages the underlying infrastructure, you must carefully plan and execute your Amazon MWAA environment updates according to the shared responsibility model. Upgrading to the latest Amazon MWAA version can provide significant advantages, including enhanced security through critical security patches and potential improvements in performance with faster DAG parsing and reduced database load. You can use advanced features while maintaining ecosystem compatibility and receiving prioritized AWS support. The key to successful upgrades lies in choosing the right solution and following a methodical implementation approach.

In this post, we explore best practices for upgrading your Amazon MWAA environment and provide a step-by-step guide to seamlessly transition to the latest version.

Solution overview

Amazon MWAA provides two primary upgrade solutions:

  • In-place upgrade – This method works best when you can accommodate planned downtime. You deploy the new version directly on your existing infrastructure. In-place version upgrades on Amazon MWAA are supported for environments running Apache Airflow version 2.x and later. However, if you’re running version 1.10.z or older versions, you must create a new environment and migrate your resources, because these versions don’t support in-place upgrades.
  • Cutover upgrade – This method helps minimize disruption to production environments. You create a new Amazon MWAA environment with the target version and then transition from your old environment to the new one.

Each solution offers a different approach to help you upgrade while working to maintain data integrity and system reliability.

In-place upgrade

In-place upgrades work well for environments where you can schedule a maintenance window for the upgrade process. During this window, Amazon MWAA preserves your workflow history. This method works best when you can accommodate planned downtime. It helps maintain historical data, provides a straightforward upgrade process, and includes rollback capabilities if issues occur during provisioning. You also use fewer resources because you don’t need to create a new environment.

You can perform in-place upgrades through the AWS Management Console with a single operation. This process helps reduce operational overhead by managing many upgrade steps for you.

During the upgrade process, your environment can’t schedule or run new tasks. Amazon MWAA helps manage the upgrade process and implements safety measures—if issues occur during the provisioning phase, the service attempts to revert to the previous stable version.

Before you begin an in-place upgrade, we recommend testing your DAGs for compatibility with the target version, because DAG compatibility issues can affect the upgrade process. You can use the Amazon MWAA local runner to test DAG compatibility before you start the upgrade. You can start the upgrade using either the console and specifying the new version or the AWS Command Line Interface (AWS CLI). The following is an example Amazon MWAA upgrade command using the AWS CLI:

aws mwaa update-environment --name <value> --airflow-version <value>

The following diagram shows the Amazon MWAA in-place upgrade workflow and states.

In-place upgrade workflow and states

Refer to Introducing in-place version upgrades with Amazon MWAA for more details.

Cutover upgrade

A cutover upgrade provides an alternative solution when you need to minimize downtime, though it requires more manual steps and operational planning. With this approach, you create a new Amazon MWAA environment, migrate your metadata, and manage the transition between environments. Although this method offers more control over the upgrade process, it requires additional planning and execution effort compared to an in-place upgrade.

This method can work well for environments with complex workflows, particularly when you plan to make significant changes alongside the version upgrade. The approach offers several benefits: you can minimize production downtime, perform comprehensive testing before switching environments, and maintain the ability to return to your original environment if needed. You can also review and update your configurations during the transition.

Consider the following aspects of the cutover approach. When you run two environments simultaneously, you pay for both environments. The pricing for each Amazon MWAA environment depends on:

  • Duration of environment uptime (billed hourly with per-second resolution)
  • Environment size configuration
  • Automatic scaling capacity for workers
  • Scheduler capacity

AWS calculates the cost of additional automatic scaled workers separately. You can estimate costs for your specific configuration using the AWS Pricing Calculator.

To help prevent data duplication or corruption during parallel operation, we recommend implementing idempotent DAGs. The Airflow scheduler automatically populates some metadata tables (dag, dag_tag, and dag_code) in your new environment. However, you need to plan the migration of the following additional metadata components:

  • DAG history
  • Variables
  • Slot pool configurations
  • SLA miss records
  • XCom data
  • Job records
  • Log tables

You can choose this approach when your requirements prioritize minimal downtime and you can manage the additional operational complexity.

The cutover upgrade process involves three main steps: creating a new environment, restoring it with the existing data, and performing the upgrade. The following diagram illustrates the full workflow.

Cut-over upgrade steps

In the following sections, we walk through the key steps to perform a cutover upgrade.

Prerequisites

Before you begin the upgrade process, complete the following steps:

Create a new environment

Complete the following steps to create a new environment:

  • Generate a template for your new environment configuration using the AWS CLI:

aws mwaa create-environment --generate-cli-skeleton > <new-env-name>.json

  • Modify the generated JSON file:
    • Copy configurations from your backup file <env-name>.json to <new-env-name>.json.
    • Update the environment name.
    • Keep the AirflowVersion parameter value from your existing environment.
    • Review and update other configuration parameters as needed.
  • Create your new environment:

aws mwaa create-environment --cli-input-json <content of new-env-name.json>

Restore the new environment

Complete the following steps to restore the new environment:

  • Use the mwaa-dr PyPI package to create and run the restore DAG.
  • This process copies metadata from your S3 backup bucket to the new environment.
  • Verify that your new environment contains the expected metadata from your original environment.

Perform the version upgrade

Complete the following steps to perform the version upgrade:

  • Upgrade your environment:

aws mwaa update-environment --name <new-env-name> --airflow-version <target-version>

  • Monitor the upgrade:
    • Track the environment status on the console.
    • Watch for error messages or warnings.
    • Verify the environment reaches the AVAILABLE

Plan your transition timing carefully. When your original environment continues to process workflows during this upgrade, the metadata between environments can change.

Clean up

After you verify the stability of your upgraded environment through monitoring, you can begin the cleanup process:

  • Remove your original Amazon MWAA environment using the AWS CLI command:

 aws mwaa delete-environment --name <old-env-name>

  • Clean up your associated resources by removing unused backup data from S3 buckets, deleting temporary AWS Identity and Access Management (IAM) roles and policies created for the upgrade, and updating your DNS or routing configurations.

Before removing any resources, make sure you follow your organization’s backup retention policies, maintain necessary backup data for your compliance requirements, and document configuration changes made during the upgrade.

This approach helps you perform a controlled upgrade with opportunities for testing and the ability to return to your original environment if needed.

Monitoring and validation

You can track your upgrade progress using Amazon CloudWatch metrics, with a focus on DAG processing metrics and scheduler heartbeat. Your environment transitions through several states during the upgrade process, including UPDATING and CREATING. When your environment shows the AVAILABLE state, you can begin validation testing. We recommend checking system accessibility, testing critical workflow operations, and verifying external connections. For detailed monitoring guidance, see Monitoring and metrics for Amazon Managed Workflows for Apache Airflow.

Key considerations

Consider using infrastructure as code (IaC) practices to help maintain consistent environment management and support repeatable deployments. Schedule metadata backups using mwaa-dr during periods of low activity to help protect your data. When designing your workflows, implement idempotent pipelines to help manage potential interruptions, and maintain documentation of your configurations and dependencies.

Conclusion

A successful Amazon MWAA upgrade starts with selecting an approach that aligns with your operational requirements. Whether you choose an in-place or cutover upgrade, thorough preparation and testing help support a controlled transition. Using available tools, monitoring capabilities, and recommended practices can help you upgrade to the latest Amazon MWAA features while working to maintain your workflow operations.

For additional details and code examples on Amazon MWAA, refer to the Amazon MWAA User Guide and Amazon MWAA examples GitHub repo.

Apache, Apache Airflow, and Airflow are either registered trademarks or trademarks of the Apache Software Foundation in the United States and/or other countries.


About the Authors

Anurag Srivastava works as a Senior Big Data Cloud Engineer at Amazon Web Services (AWS), specializing in Amazon MWAA. He’s passionate about helping customers build scalable data pipelines and workflow automation solutions on AWS.

Sriharsh Adari is a Senior Solutions Architect at Amazon Web Services (AWS), where he helps customers work backwards from business outcomes to develop innovative solutions on AWS. Over the years, he has helped multiple customers on data platform transformations across industry verticals. His core area of expertise include Technology Strategy, Data Analytics, and Data Science. In his spare time, he enjoys playing sports, binge-watching TV shows, and playing Tabla.

Venu Thangalapally is a Senior Solutions Architect at AWS, based in Chicago, with deep expertise in cloud architecture, data and analytics, containers, and application modernization. He partners with Financial Services industry customers to translate business goals into secure, scalable, and compliant cloud solutions that deliver measurable value. Venu is passionate about leveraging technology to drive innovation and operational excellence. Outside of work, he enjoys spending time with his family, reading, and taking long walks.

Chandan Rupakheti is a Senior Solutions Architect at AWS. His main focus at AWS lies in the intersection of analytics, serverless, and AdTech services. He is a passionate technical leader, researcher, and mentor with a knack for building innovative solutions in the cloud. Outside of his professional life, he loves spending time with his family and friends, and listening to and playing music.

Enhancing data durability in Amazon EMR HBase on Amazon S3 with the Amazon EMR WAL feature

Post Syndicated from Suthan Phillips original https://aws.amazon.com/blogs/big-data/enhancing-data-durability-in-amazon-emr-hbase-on-amazon-s3-with-the-amazon-emr-wal-feature/

Apache HBase, an open source NoSQL database, enables quick access to massive datasets. Amazon EMR, from version 5.2.0, lets you use HBase on Amazon Simple Storage Service (Amazon S3). This combines HBase’s speed with the durability advantages of Amazon S3. Also, it helps achieve the data lake architecture benefits such as the ability to scale storage and compute requirements separately. We see our customers choosing Amazon S3 over Hadoop Distributed File Systems (HDFS) when they want to achieve greater durability, availability, and simplified storage management. Amazon EMR continually improves HBase on Amazon S3, focusing on performance, availability, and reliability.

Despite these durability benefits of HBase on Amazon S3 architecture, a critical concern remains regarding data recovery when the Write-Ahead Log (WAL) is lost. Within the EMR framework, HBase data attains durability when it’s flushed, or written, to Amazon S3. This flushing process is triggered by reaching specific size and time thresholds or through manual initiation. Until data is successfully flushed to S3, it persists within the WAL, which is stored in HDFS. In this post, we dive deep into the new Amazon EMR WAL feature to help you understand how it works, how it enhances durability, and why it’s needed. We explore several scenarios that are well-suited for this feature.

HBase WAL overview

Each RegionServer in HBase is responsible for managing data from multiple tables. These tables are horizontally partitioned into regions, where each region represents a contiguous range of row keys. A RegionServer can host multiple such regions, potentially from different tables. At the RegionServer level, there is a single, shared WAL that records all write operations across all regions and tables in a sequential, append-only manner. This shared WAL makes sure durability is maintained by persisting each mutation before applying it to in-memory structures, enabling recovery in case of unexpected failures. Within each region, the memory structure of the MemStore is further divided by column families, which are the fundamental units of physical storage and I/O in HBase. Each column family maintains:

  • Its own MemStore, which holds recently written data in memory for fast access and buffering before it flushes to disk.
  • A set of HFiles, which are immutable data files stored on HDFS (or Amazon S3 in HBase on S3 mode) that hold the persistent, flushed data.

Although all column families within a region are served by the same RegionServer process, they operate independently in terms of memory buffering, flushing, and compaction. However, they still share the same WAL and RegionServer-level resources, which introduces a degree of coordination, hence they operate semi-independently within the broader region context. This architecture is shown in the following diagram.

Architecture diagram of HBase Region Server showing WAL, two regions with in-memory Memstores and persistent HFiles

Understanding the HBase write process: WAL, MemStore, and HFiles

The HBase write path initiates when a client issues a write request, typically through an RPC call directed to the appropriate RegionServer that hosts the target region. Upon receiving the request, the RegionServer identifies the correct HBase region based on the row key and forwards the KeyValue pair accordingly. The write operation follows a two-step process. First, the data is appended to the WAL, which promotes durability by recording every change before it’s committed to memory. The WAL resides on HDFS by default and exists independently on each RegionServer. Its primary purpose is to provide a recovery mechanism in the event of a failure, particularly for edits that have not yet been flushed to disk. When the WAL append is successful, the data is written to the MemStore, an in-memory store for each column family within the region. The MemStore accumulates updates until it reaches a predefined size threshold, controlled by the hbase.hregion.memstore.flush.size parameter (default is 128 MB). When this threshold is exceeded, a flush is triggered.Flushing is handled asynchronously by a background thread in the RegionServer. The thread writes the contents of the MemStore to a new HFile, which is then persisted to long-term storage. In Amazon EMR, the location of this HFile depends on the deployment mode: for HBase on Amazon S3, HFiles are stored in Amazon S3, but for HBase on HDFS, they’re stored in HDFS.This workflow is shown in the following diagram.

HBase write process workflow showing data path through WAL, Memstore, and HFile with AWS services

A region server serves multiple regions, and they all share a common WAL. The WAL records all data changes, storing them in local HDFS. Puts and deletes are initially logged to the WAL by the region server before being recorded in the MemStore for the affected store. Scan and get operations in HBase don’t require the use of the WAL. In the event of a region server crash or unavailability before MemStore flushing, the WAL is crucial for replaying data changes, which promotes data integrity. Because this log by default resides on a replicated filesystem, it enables an alternate server to access and replay the log, requiring nothing from the physically failed server for a complete recovery. When a RegionServer fails abruptly, HBase initiates an automated recovery process orchestrated by the HMaster. First, the ZooKeeper session timeout detects the RegionServer failure, notifying the HMaster. The HMaster then identifies all regions previously hosted on the failed RegionServer and marks them as unassigned. The WAL files from the failed RegionServer are split by region, and these split WAL files are distributed to the new RegionServers that will host the reassigned regions. Each new RegionServer replays its assigned WAL segments to recover the MemStore state that existed before the failure, preventing data loss. When WAL replay is complete, the regions become operational on their new RegionServers, and the recovery process concludes.

HBase recovery workflow from RegionServer failure through WAL splitting to regions online

The effectiveness of the HDFS WAL model relies on the successful completion of the write request in the WAL and the subsequent data replication in HDFS. In cases where some nodes are terminated, HDFS can still recover from the WAL files, allowing HBase to autonomously heal by replaying data from the WALs and rebalancing the regions. However, if all CORE nodes are simultaneously terminated, achieving complete cluster recovery is a challenge because the data to replay from the WAL is lost. The issue arises when WALs are lost due to CORE node shutdown (for example, all three replicas of a file block). In this scenario, HBase enters a loop attempting to replay data from the WALs. Unfortunately, the absence of available blocks in this case causes the HBase server crash procedure to fail and retry indefinitely.

Amazon EMR WAL

To address the mentioned challenge of HDFS WAL and to provide data durability in HBase, Amazon EMR introduces a new EMR WAL feature starting from versions emr-7.0 and emr-6.15. This feature facilitates the recovery of data that hasn’t been flushed to Amazon S3 (HFile). Using this feature provides thorough backup for your HBase clusters. Behind the scenes, the RegionServer writes WAL data to EMR WAL, which is a service outside the EMR cluster. With this feature enabled, concerns about loss of WAL data in HDFS are alleviated. Also, in the event of cluster or Availability Zone failure issues, you can create a new cluster, directing it to the same Amazon S3 root directory and EMR WAL workspace. This enables the automatic recovery of data in the WAL in the order of minutes. Recovery of unflushed data is supported for a duration of 30 days, after which remaining unflushed data is deleted. This workflow is shown in the following diagram.

Detailed sequence diagram of HBase write operations with EMR WAL service integration and S3 storage

Key benefits

Upon enabling EMR WAL, the WALs are located external to the EMR cluster. The key benefits are:

  • High availability – You can remain confident about data integrity even in the face of Availability Zone failures. Their HFiles are stored in Amazon S3, and the WALs are externally stored in EMR WAL. This setup enables cluster recovery and WAL replay in the same or a different Availability Zone within the region. However, for true high availability with zero downtime, relying solely on EMR WAL is not sufficient because recovery still involves brief interruptions. To provide seamless failover and uninterrupted service, HBase replication across multiple Availability Zones is essential along with EMR WAL, providing robust zero-downtime high availability.
  • Data durability improvement – Customers no longer need to concern themselves with potential data loss in scenarios involving WAL data corruption in HDFS or the removal of all replicas in HDFS due to instance terminations.

The following flow diagram compares the sequence of events with and without EMR WAL enabled.

HBase write process and failure recovery workflow with EMR WAL and S3 integration

Key EMR WAL features

In this section, we explore the key enhancements introduced in the EMR WAL service across recent Amazon EMR versions. From grouping multiple HBase regions into a single EMR WAL to advanced configuration options, these new capabilities address specific usage scenarios.

Grouping multiple HBase regions into a single Amazon EMR WAL

In Amazon EMR versions up to 7.2, a separate EMR WAL is created for each region, which can become expensive due to the EMR-WAL-WALHours pricing model, especially when the HBase cluster contains many regions. To address this, starting from Amazon EMR 7.3, we introduced the EMR WAL grouping feature, which enables consolidating multiple HBase regions per EMR WAL, offering significant cost savings (over 99% cost savings in our sample evaluation) and improved operational efficiency. By default, each HBase RegionServer has two Amazon EMR WALs. If you have many regions per RegionServer and want to increase throughput, you can customize the number of WALs per RegionServer by configuring the hbase.wal.regiongrouping.numgroups property. For instance, to set 10 EMR WALs per HBase RegionServer, you can use the following configuration:

[
  {
    "Classification": "hbase-site",
    "Properties": {
      "hbase.wal.regiongrouping.numgroups": "10"
    }
  }
]

The two HBase system tables hbase:meta and hbase:master (masterstore) don’t participate in the WAL grouping mechanisms.

In a performance test using m5.8xlarge instances with 1,000 regions per RegionServer, we observed a significant increase in throughput as the number of WALs grew from 1 to 20 per RegionServer (from 1,570 to 3,384 operations per sec). This led to a 54% improvement in average latency (from 40.5 ms to 18.8 ms) and a 72% reduction in 95th percentile latency (from 231 ms to 64 ms). However, beyond 20 WALs, we noted diminishing returns, with only slight performance improvements between 20 and 50 WALs, and average latency stabilized around 18.7ms. Based on these results, we recommend maintaining a lower region density (around 10 regions per WAL) for optimal performance. Nonetheless, it’s crucial to fine-tune this configuration according to your specific workload characteristics and performance requirements and conduct tests in your lower environment to validate the best setup.

Configurable maximum record size in EMR WAL

Until Amazon EMR version 7.4, the EMR WAL had a record size limit of 4 MB, which was insufficient for some customers. Starting from EMR 7.5, the maximum record size in EMR WAL is configurable through the emr.wal.max.payload.size property. The default value is set to 1 GB. The following is an example of how to set the maximum record size to 2 GB:

[
  {
    "Classification": "hbase-site",
    "Properties": {
      "emr.wal.max.payload.size": "2147483648"
    }
  }
]

AWS PrivateLink support

EMR WAL supports AWS PrivateLink, if you want to keep your connection within the AWS network. To set it up, create a virtual private cloud (VPC) endpoint using the AWS Management Console or AWS Command Line Interface (AWS CLI) and select the service labeled com.amazonaws.region.emrwal.prod. Make sure your VPC endpoint uses the same security groups as the EMR cluster. You have two DNS configuration options: enabling private DNS, which uses the standard endpoint format and automatically routes traffic privately, or using the provided VPC endpoint-specific DNS name for more explicit control. Regardless of the DNS option chosen, both methods mean that traffic remains within the AWS network, enhancing security. To implement this in the EMR cluster, update your cluster configuration to use the PrivateLink endpoint, as shown in the following code sample (for private DNS):

[
    {
        "Classification": "hbase-site",
        "Properties": {
            "emr.wal.client.endpoint": "https://prod.emrwal.region.amazonaws.com"
        }
    }
]

For more details, refer to Access Amazon EMR WAL through AWS PrivateLink in the Amazon EMR documentation.

Encryption options for WAL in Amazon EMR

Amazon EMR automatically encrypts data in transit in the EMR WAL service. You can enable server-side encryption (SSE) for WAL (data at rest) with two key management options:

  • SSE-EMR-WAL: Amazon EMR manages the encryption keys
  • SSE-KMS-WAL: You use an AWS Key Management Service (AWS KMS) key for encryption policies

EMR WAL cross-cluster replication

From EMR 7.5, EMR WAL supports cross-cluster replay, allowing clusters in an active-passive HBase replication setup to use EMR WAL.

For more details on the setup, refer to EMR WAL cross-cluster replication in the Amazon EMR documentation.

EMR WAL enhancement: Minimizing CPU load from HBase sync threads

Starting from EMR 7.9, we’ve implemented code optimizations in EMR WAL to address the high CPU utilization caused by sync threads used by HBase processes to write WAL edits, leading to improved CPU efficiency.

Sample use cases benefitting from this feature

Based on our customer interactions and feedback, this feature can help in the following scenarios.

Continuity during service disruptions

If your business demands disaster recovery with no data loss for an HBase on an S3 cluster due to unexpected service disruptions, such as an Availability Zone failure, the newly introduced feature means you don’t have to rely on a persistent event store solution using Amazon Managed Streaming for Apache Kafka (Amazon MSK) or Amazon Kinesis. Without EMR WAL, you had to set up a complex event-streaming pipeline to retain the most recently ingested data and enable replay from the point of failure. This new feature eliminates that dependency by storing Hbase WALs in the EMR WAL service.

Note: During an Availability Zone (AZ) failure or service-level issue, make sure to fully terminate the original Hbase cluster before launching a new one that points to the same S3 root directory. Running two active Hbase clusters that access the same S3 root can lead to data corruption.

Upgrading to the latest EMR releases or cluster rotations

Without EMR WAL, moving to the latest EMR version or managing cluster rotations with HBase on Amazon S3 necessitated manual interruptions for data flushing to S3. With the new feature, the requirement for data flushing is eliminated. However, during cluster termination and the subsequent launch of a new HBase cluster, there is an inevitable service downtime, during which data producers or ingestion pipelines must handle write disruptions or buffer incoming data until the system is fully restored. Also, the downstream services should account for temporary unavailability, which can be mitigated using a read replica cluster.

Overcoming HDFS challenges during HBase auto scaling

Without EMR WAL feature, having HDFS for your WAL files was a requirement. When implementing custom auto scaling for your HBase clusters, it sometimes resulted in WAL data corruption due to issues linked to HDFS. This is because, to prevent data loss, data blocks had to be moved to different HDFS nodes when one HDFS node was being decommissioned. When nodes continued to be terminated swiftly during scale-down process without allowing sufficient time for graceful decommissioning, it could result in WAL data corruption issues, primarily attributed to missing blocks.

Addressing HDFS disk space issues due to old WALs

When a WAL file is no longer required for recovery, indicating that HBase has made sure all data within the WAL file has been flushed, it’s transferred to the oldWALs folder for archival purposes. The log remains in this location until all other references to the WAL file are completed. In HBase use cases with high write activity, some customers have expressed concerns about the oldWALs directory (/usr/hbase/oldWALs) expanding and occupying excessive disk space and eventually causing disk space issues. With the complete relocation of these WALs to an external EMR WAL service, you will no longer encounter this issue.

Assessing HBase in Amazon EMR clusters with and without EMR WAL for fault tolerance

We conducted a data durability test employing two scripts. The first was for installing YCSB, creating a pre-split table, and loading 8 million records on the master node. The second was for terminating a core node every 90 seconds after a 3-minute wait, totaling five terminations. Two EMR clusters with eight core nodes each were created, one configured with EMR WAL enabled and the other as a standard EMR HBase cluster with the WAL stored in HDFS. After completion of EMR steps, a count was run on the HBase table. In the EMR cluster with EMR WAL enabled, all records were successfully inserted without corruption. In the cluster not using EMR WALs, regions in HBase remained “OPENING” if the node hosting the meta was terminated. For other core node terminations, inserts failed, resulting in a lower record count during validation.

Understanding when EMR WAL read charges apply in HBase

In HBase, standard table read operations such as Get and Scan don’t access WALs. Therefore, EMR WAL read (GiB) charges are only incurred during operations that involve reading from WALs, such as:

  • Restoring data from EMR WALs in a newly launched cluster
  • Replaying WALs to recover data on a crashed RegionServer
  • Performing HBase replication, which involves reading WALs to replicate data across clusters

In a normal scenario, you’re billed only for the following two components related to EMR WAL usage:

  • EMR-WAL-WALHours – Represents the hourly cost of WAL storage, calculated based on the number of WALs maintained. You can use the EMRWALCount metric in Amazon CloudWatch to monitor the number of WALs and track associated usage over time.
  • EMR-WAL-WriteRequestGiB – This reflects the volume of data written to the WAL service, charged by the amount of data written in GiB.

For further details on pricing, refer to Amazon EMR pricing and Amazon EMR Release Guide.

To monitor and analyze EMR WAL related costs in the AWS Cost and Usage Reports (CUR), look under product_servicecode = ‘ElasticMapReduce’, where you’ll find the following product_usagetype entries associated with WAL usage:

  • USE1-EMR-WAL-ReadRequestGiB
  • USE1-EMR-WAL-WALHours
  • USE1-EMR-WAL-WriteRequestGiB

The prefix USE1 indicates the Region (in this case, us-east-1) and will vary depending on where your EMR cluster is deployed.

Summary

This new EMR WAL feature allows you to improve durability of your Amazon EMR HBase on S3 clusters, addressing critical workload scenarios by eliminating the need for streaming solutions for Availability Zone level service disruptions, streamlining processes for upgrading or rotating clusters, preventing data corruption during HBase auto scaling or node termination events, and resolving disk space issues associated with old WALs. Because many of the EMR WAL features are added on the latest releases of Amazon EMR, we recommend that customers use Amazon EMR version 7.9 or later to fully benefit from these improvements.


About the authors

Suthan Phillips is a Senior Analytics Architect at AWS, where he helps customers design and optimize scalable, high-performance data solutions that drive business insights. He combines architectural guidance on system design and scalability with best practices to ensure efficient, secure implementation across data processing and experience layers. Outside of work, Suthan enjoys swimming, hiking and exploring the Pacific Northwest.

How Launchpad from Pega enables secure SaaS extensibility with AWS Lambda

Post Syndicated from Anton Aleksandrov original https://aws.amazon.com/blogs/architecture/how-launchpad-from-pega-enables-secure-saas-extensibility-with-aws-lambda/

Large organizations increasingly adopt software as a service (SaaS) solutions to focus on business priorities, reduce infrastructure management overhead, and optimize costs. These organizations expect SaaS vendors to provide customizability facilities for tailoring the solution behavior according to their needs. Although traditional approaches like feature flags and webhooks offer some flexibility, they often fall short of providing a high degree of customizability. A new emerging pattern in this space is tenant-supplied custom code execution, which allows tenants to inject their own code into specific workflow points, enabling deep customization while preserving the core SaaS solutions’ integrity and security.

In this post, we share how Pegasystems (Pega) built Launchpad, its new SaaS development platform, to solve a core challenge in multi-tenant environments: enabling secure customer customization. By running tenant code in isolated environments with AWS Lambda, Launchpad offers its customers a secure, scalable foundation, eliminating the need for bespoke code customizations.

Solution overview

Launchpad, which is built on AWS, is an end-to-end platform on which software providers can build, launch, and operate workflow-centric B2B SaaS applications and AI solutions. It provides a managed, secure, scalable cloud environment for hosting multi-tenant applications and data. It accelerates the build experience with generative AI-powered low code tools, prebuilt capabilities, and subscriber-level configuration. Being a multi-tenant platform at its core, Launchpad had to maintain stringent isolation across tenants in its architecture.

One of the requirements Launchpad had was to allow their tenants to augment the workflows natively by providing custom code. Some common scenarios included communicating with external systems with proprietary non-industry-standard protocols, reuse of existing business logic, and SDK-based custom code development.

The solution necessitated the ability for tenants to provide custom code that would implement the required business logic, which Launchpad would be executing. This required architecting a secure runtime environment for custom code execution that maintains the highest degree of cross-tenant isolation within the multi-tenant architecture, at the same time allowing sufficient access to platform APIs and services. It was essential to build an architecture that would decouple the environment running tenant code from the core SaaS platform, as illustrated in the following diagram.

Architecting the solution topology

To achieve the required high level of compute isolation for running code provided by different tenants, Launchpad has adopted Lambda functions in its architecture as the secure ephemeral compute environment. Each untrusted code snippet provided by tenants is bootstrapped as a stand-alone Lambda function, with strong Firecracker-based isolation across different functions and execution environments addressing Launchpad’s requirements. This isolation provides dedicated resources, customizable access permissions, independent monitoring and operations, and automatic scaling for each function, while maintaining complete separation from other functions and their execution environments, as illustrated in the following diagram.

With Lambda being a serverless compute service, adopting it for the Launchpad architecture yielded several significant benefits. The major business benefit was that tenants could implement thousands of custom workflow augmentations on their own simply by providing code snippets, instead of the Launchpad engineering team being responsible for implementing them in the core platform code. Other benefits included:

  • Managed runtimes – AWS handles patching and updating the underlying infrastructure, operating system, and runtimes for customers, reducing the potential attack surface.
  • Fine-grained permissions – Each function can have its own set of access policies to tightly control what resources and actions it can access.
  • No need to pre-provision and pay for overprovisioned capacity – Lambda functions scale up and down automatically based on traffic patterns.
  • Built-in monitoring – Lambda functions emit detailed metrics, logs, and traces through Amazon CloudWatch and AWS X-Ray out of the box, making it straightforward to monitor tenant code execution.

To further reduce risks, Launchpad runs these Lambda functions with untrusted code in a dedicated AWS account. This account is separated from the core SaaS platform account. When end-users create a new function in the Launchpad authoring portal, they upload their code and specify the code handler to be executed during the invocation. Users can also map function input and output to Launchpad fields for further processing to enable an even higher degree of customizability and integration. The multi-tenant authoring service is a Control Plane component that runs as a microservice on the Amazon Elastic Kubernetes Service (Amazon EKS) cluster and uses the Lambda API for function lifecycle management, as illustrated in the following diagram. After a function resource is created, it can be used for further invocations.

Runtime architecture

At runtime, when Launchpad needs to invoke a function, it calls the Lambda Invoke API. Before the function is invoked, the multi-tenant runtime service performs a tenancy check to make sure the request is coming from an authorized tenant by doing the token validation. After a successful validation, the service invokes the required Lambda function. To invoke functions hosted in a different AWS account, the multi-tenant runtime service uses an AWS Identity and Access Management (IAM) role to assume the required permissions and invokes the Lambda service using the AWS SDK. The sequence of interactions is shown in the following architecture diagram.

The workflow consists of the following steps:

  1. An incoming user request reaches the application gateway service.
  2. The application gateway authenticates the request using the tenancy security service.
  3. After it’s authenticated, the request is forwarded to the multi-tenant runtime service
  4. The multi-tenant runtime service validates the supplied token and performs a tenancy check. This makes sure tenants can only invoke own functions they have permissions for (for example, functions they own).
  5. The multi-tenant runtime service pod assumes the IAM role required for invoking the tenant-specific Lambda function in a different AWS account.
  6. The multi-tenant runtime service pod invokes the required Lambda function.

Invoking the platform API from custom code is as straightforward as connecting to any external API. The custom code can authenticate with the platform using OAuth2. To facilitate the authentication, the developer can pass along the credentials as input parameters to the function from the core platform. Then the developer can create a corresponding record (isolated by tenant) in the platform that stores the credentials per function, and pass credentials as input parameters during invocation.

Distributed architecture observability

Operating a distributed architecture that runs untrusted code across multiple AWS accounts requires a comprehensive observability strategy. Launchpad’s approach combines centralized logging and monitoring with cross-account aggregation to provide a unified operational view of the platform.

The monitoring architecture uses CloudWatch Metrics to observe the Lambda functions, aggregating them through a centralized observability layer. This setup empowers platform operators to correlate Lambda function metrics with the core platform services running on Amazon EKS. Launchpad also collects per-function telemetry like function invocations, error rates, and execution time, which allows them to observe per-tenant metrics. These telemetry dimensions enable both a platform-wide and tenant-specific monitoring perspective.

For logging and troubleshooting, Launchpad implements a unified logging pipeline that aggregates Lambda function logs with application gateway and runtime service logs. Each request flowing through the system carries a correlation ID, so operators can trace execution paths across the core SaaS services and into the tenant functions running in the AWS account running tenant Lambda functions.

With this multi-layer observability architecture, Launchpad can maintain operational excellence while running tenant code securely at scale. Regular operational reviews drive continuous improvements in monitoring coverage and incident response procedures. Having per-tenant Lambda functions make it possible for Launchpad to use tenant-specific cost allocation tags, further empowering them to understand the cost footprint of running tenant custom code.

Best practices

When building a SaaS solution, maintaining a unified core code base is essential for scalability and manageability. Implementing per-tenant variations within the core platform code can lead to maintenance complexity and technical debt. Instead, architect your SaaS solution to have extension points, which allow your tenants to inject their custom code at specific points in the workflow, enabling customization without compromising the platform’s maintainability. This pattern makes sure the core SaaS platform remains clean and standardized while offering the flexibility that customers demand.

Additional best practices include:

  • Use separate accounts for running Lambda functions with untrusted tenant-provided code to make sure it’s isolated from your core SaaS platform code.
  • Grant absolute minimum required access permissions to the execution role assigned to the function. The custom code running within the execution environment gets permissions defined in the execution role when making requests to AWS API endpoints. If the function doesn’t need to reach out to AWS API endpoints, remove all permissions from the execution role and add an explicit AWSDenyAll policy.
  • Use separate Lambda functions for each code snippet and each tenant. This will provide the highest degree of cross-tenant isolation. Resources are not reused across different functions and execution environments.
  • Use Lambda layers in case you need to add a layer of vendor-provided code in order to keep it separated from the untrusted tenant-provided code.
  • Implement additional security controls, such as using Amazon Virtual Private Cloud (Amazon VPC) constructs to restrict network access and VPC Flow Logs for network activity monitoring.

Conclusion

The implementation of a secure untrusted code execution environment within SaaS platforms addresses a critical need for tenant customization while maintaining architectural integrity. Lambda offers a built-in isolation model, fine-grained security controls, and serverless scalability, so SaaS providers such as Launchpad can address the requirements of executing tenant-provided code in a multi-tenant environment and offer robust customization capabilities while maintaining strict security boundaries and operational efficiency. This architectural pattern enables providers to focus on core platform development while confidently supporting tenant-specific workflows through the secure and scalable Lambda execution environment.

To learn more, refer to the Security Overview of AWS Lambda white paper. For additional serverless architectural patterns, see Serverlessland.com.


About the authors

How Smartsheet boosts developer productivity with Amazon Bedrock and Roo Code

Post Syndicated from Rony Blum original https://aws.amazon.com/blogs/architecture/how-smartsheet-boosts-developer-productivity-with-amazon-bedrock-and-roo-code/

This post was co-written with JB Brown from Smartsheet.

Organizations are often seeking ways to enhance developer productivity while maintaining cost-efficiency. AI-powered coding assistants are effective solutions to accelerate development cycles, but implementing these solutions at scale while managing costs presents unique challenges. Roo Code, an AI-powered autonomous coding agent located directly in developers’ editors, represents the latest evolution in AI-assisted development. It helps developers code faster and smarter by offering capabilities ranging from code generation and refactoring to documentation writing and code base analysis through natural language interaction. This post explores how Smartsheet successfully deployed Roo Code with Amazon Bedrock and Anthropic’s Claude, achieving significant improvements in developer efficiency while optimizing costs through innovative caching strategies.

The Amazon Bedrock prompt caching capability, which became generally available in April 2025, represents a significant advancement in optimizing AI model interactions. With this feature, organizations can cache frequently used prompts across multiple API calls, reducing costs by up to 90% and lowing latency by up to 85%. The technology is particularly valuable for applications that repeatedly use similar context, such as coding assistants that need to maintain context about code files. Prompt caching supports multiple foundation models (FMs), including Anthropic’s Claude 3.5 Haiku and Anthropic’s Claude 3.7 Sonnet, as well as the Amazon Nova family of models. The cached context remains available for up to 5 minutes after each access, with each cache hit resetting this countdown. For organizations implementing AI-assisted development workflows, they can use this capability to balance performance with cost-efficiency.

Benefits of Amazon Bedrock prompt caching

Smartsheet is a leading cloud-based enterprise work management service, enabling millions of users worldwide to plan, manage, track, automate, and report on work at scale. Their engineering team identified an opportunity to enhance developer productivity by implementing AI-assisted coding capabilities across their organization. The solution needed to scale efficiently while maintaining reasonable costs, leading them to choose Roo Code with Amazon Bedrock with Anthropic’s Claude as their FM provider.

“Our engineering team has achieved a 60% reduction in operational costs and 20% improvement in response latency when using Roo Code with Amazon Bedrock prompt caching. These improvements directly translate to enhanced developer productivity across our organization,” says JB Brown, VP of Engineering at Smartsheet.

This fact is underscored by the team’s ability to rapidly generate comprehensive code documentation and architecture diagrams in a mere four hours, a task that previously consumed 2 weeks of manual effort. This newfound efficiency extends to critical areas like AWS cost management, where a vital analysis tool was built in just 30 minutes, and is projected to save Smartsheet $450,000 annually. Furthermore, the speed and accessibility of information have been significantly amplified, as evidenced by the 6–8 hours of senior engineer time saved by quickly explaining complex Terraform/Terragrunt infrastructure. These examples highlight how Amazon Bedrock prompt caching is not just about incremental gains, but about unlocking substantial time and resource savings, empowering our developers to focus on innovation rather than time-consuming manual processes.

Solution overview

When implementing AI-assisted coding at scale, Smartsheet faced several key challenges around managing costs associated with large language model (LLM) API calls, reducing latency for developer interactions and handling repetitive elements in prompts efficiently. The development team recognized that a significant portion of the prompts sent to Amazon Bedrock were repeated elements: the system prompt and the continuously building message history, presenting an opportunity for optimization.

To address these challenges, Smartsheet implemented a comprehensive solution centered around Roo Code integration with Amazon Bedrock and prompt caching. Smartsheet deployed Roo Code, powered by Amazon Bedrock and Anthropic’s Claude 3.7, across the organization and integrated seamlessly into existing development workflows. This provided developers with immediate access to AI assistance for code writing, reviewing, and debugging tasks.

The team then contributed a sophisticated Amazon Bedrock prompt caching system to Roo Code that identifies and stores common prompt elements, significantly reducing redundant data transmission to Bedrock. This caching layer proved crucial in optimizing both cost and performance metrics. The caching decision flow incorporates two key checks: first, it verifies if the selected model supports prompt caching, then it makes sure the system prompt meets a minimum token threshold to make caching worthwhile.

The solution integrates Roo Code directly into developers’ integrated development environments (IDE), using the Amazon Bedrock prompt caching capabilities. The architecture separates content into static elements (like system instructions and code context) and dynamic elements (like user queries). When a developer makes a request, static content is automatically marked with cache checkpoints and stored for 5 minutes, with each access refreshing this window.

For subsequent queries, the system checks for matching cached content before processing. When matches are found, it bypasses recomputation of these sections, significantly reducing both response time and costs.

The following diagram shows the integration points between Roo Code and Amazon Bedrock.

Technical workflow diagram showing data flow between user query, cache decision logic, and Amazon Bedrock with response handling

The following screenshot highlights the model provider settings and connection parameters required for implementation.

Amazon Bedrock configuration interface showing AWS authentication, region settings, and Claude model with caching enabled

Optimizing performance with prompt caching

When analyzing code files, much of the context—such as file contents and environment details—remains consistent across multiple queries. By caching this content, subsequent requests can reuse it from the cache, significantly reducing cost and latency.

In our example, we first asked Roo Code to analyze a Python file. We then sent multiple follow-up queries about different aspects of the code. The first query explained the overall structure, followed by questions about specific classes, unused modules, and potential improvements.

The usage section of the responses showed significant improvements through caching. During the first query, the model processed the input and wrote the cached content. For subsequent queries, 90% of the input was served from the cache. Because cache reads are 90% cheaper than processing new input tokens, this resulted in an 83% cost reduction for follow-up queries.

Here’s how the caching worked across queries:

  • First query – The model processed the entire file content and environment details, writing them to cache
  • Subsequent queries – The model loaded the cached content, only processing the new question text

To illustrate this, let’s look at the usage statistics from a series of queries:

Query 1: "Explain my @/src/models/product.py code"
{
    "inputTokens": 1051,
    "outputTokens": 902,
    "totalTokens": 19374,
    "cacheReadInputTokenCount": 0,
    "cacheWriteInputTokenCount": 12421
}

Query 2: "Describe what is ProductUpdate class used for"
{
    "inputTokens": 1078,
    "outputTokens": 694,
    "totalTokens": 21664,
    "cacheReadInputTokenCount": 19892,
    "cacheWriteInputTokenCount": 0
}

Query 3: "Which module is not in use?"
{
    "inputTokens": 4,
    "outputTokens": 774,
    "totalTokens": 22753,
    "cacheReadInputTokenCount": 19892,
    "cacheWriteInputTokenCount": 2083
}

Query 4: "Any improvement to implement to my code making it more efficient?"
{
    "inputTokens": 1097,
    "outputTokens": 1270,
    "totalTokens": 24342,
    "cacheReadInputTokenCount": 21975,
    "cacheWriteInputTokenCount": 0
} 

We can see from the results that the first query didn’t return cacheReadInputTokenCount but wrote to the cache the whole input. For subsequent queries, most of the input was read from the cache, except for the specific question.

The results clearly demonstrate the benefits of prompt caching:

  • 70% of total input was served from cache across queries
  • 90% of input for follow-up queries came from cache
  • Overall input costs reduced by 60%
  • Follow-up query costs reduced by 83%

This approach is particularly effective for development workflows where developers frequently query the same code base with different questions. The cached content provides necessary context for each query while significantly reducing processing overhead.

The following screenshot displays Roo Code’s interface, showing detailed metrics including token usage, cache hit rates, and associated API costs. The interface presents the cost savings achieved through caching and provides comprehensive usage analytics.

IDE showing Roo Code analysis with metrics, API costs, and detailed Python code explanation

Results and future innovation

The following line graph demonstrates the cost reduction trend over multiple queries runs, having the first query uncached, and the subsequent input using significant query responses from the cache. The y-axis shows costs in dollars, and the x-axis shows the cost per query. The graph shows a clear downward trend, with costs decreasing by 60% from the baseline.

Dual-axis graph displaying per-query and cumulative costs, demonstrating cost savings through caching over 4 queries

The implementation delivered remarkable improvements across key metrics. The prompt caching system achieved a 60% reduction in operational costs while simultaneously improving response latency by 20%.

The choice of Amazon Bedrock prompt caching proved particularly effective for Smartsheet’s coding assistance workflows. The 5-minute cache Time to Live (TTL) aligns perfectly with the natural rhythm of developer interactions with Roo Code, where multiple related queries typically occur within short timeframes. During active coding sessions, developers engage in rapid back-and-forth exchanges with the AI assistant—reviewing code, asking follow-up questions, and requesting modifications—while maintaining context through the cache. This agentic workflow, where each interaction builds upon previous context, takes full advantage of the prompt caching mechanism—each query refreshes the cache timer while preserving valuable context about the code being discussed.

Best practices and lessons learned

Through their implementation journey, Smartsheet developed several key best practices for organizations looking to implement similar solutions. Early implementation of prompt caching proved crucial, allowing the team to analyze prompt patterns and design efficient caching strategies from the start. The team found that focusing on developer experience through response time optimization and seamless tool integration was essential for successful adoption.

Continuous monitoring and analysis of usage patterns became a cornerstone of their optimization strategy. By tracking key metrics like response times and costs, the team could identify opportunities for further optimization and regularly adjust their caching strategies to maintain optimal performance.

Looking ahead

Smartsheet continues to innovate with Amazon Bedrock and Roo Code, exploring new ways to enhance developer productivity. Their engineering team is investigating advanced caching strategies and evaluating new FMs as they become available on Amazon Bedrock. The success of this implementation has established a strong foundation for future AI-assisted development initiatives.

Conclusion

Smartsheet’s implementation of Roo Code with Amazon Bedrock and prompt caching demonstrates how organizations can successfully deploy AI-assisted coding solutions while maintaining cost-efficiency. Their approach provides a blueprint for others looking to enhance developer productivity through AI while optimizing operational costs. The combination of strategic implementation, innovative caching solutions, and continuous optimization has enabled Smartsheet to achieve significant improvements in performance and cost metrics.

To learn more about implementing AI solutions at scale, refer to the Amazon Bedrock documentation and explore the AWS Machine Learning Blog. The frameworks and strategies outlined in this post can help organizations of varying size implement efficient, cost-effective AI-assisted development workflows.


About the Authors

Mastering Amazon Q Developer Part 1: Crafting Effective Prompts

Post Syndicated from Will Matos original https://aws.amazon.com/blogs/devops/mastering-amazon-q-developer-part-1-crafting-effective-prompts/

As organizations increasingly adopt AI-powered tools to enhance developer productivity, your ability to effectively communicate with these assistants becomes a valuable skill. This guide explores how you can craft prompts that deliver accurate, useful results when working with Amazon Q Developer.

Your success with Amazon Q Developer depends directly on how well you communicate with it. Through my work as a Principal Specialist Solutions Architect on the Next Generation Developer Experience team at AWS, I’ve observed that developers experience varying degrees of success based primarily on their approach to prompt construction. The difference between a vague request and a well-structured prompt can be the difference between wasted time and a productivity breakthrough.

Recent McKinsey research reveals that developers can complete tasks up to twice as fast with generative AI when using proper prompting techniques [1]. Even more impressive, developers tackling complex tasks are 25-30% more likely to complete them within given time-frames when using these tools effectively. These productivity gains aren’t automatic—they depend on mastering the art and science of prompt engineering.

Based on patterns observed across numerous customer interactions, this guide provides practical techniques to help you maximize the value of your AI-assisted development experience. You’ll learn how to transform your interactions to consistently produce helpful, relevant assistance that can dramatically improve your development workflow.

Key Takeaways

  • Structure your prompts with clear context, specific requirements, and desired output format
  • Include relevant technical details about your environment and constraints
  • Avoid vague requests and provide specific examples when possible
  • Use the provided prompt template to ensure consistent results

Getting Started with Amazon Q Developer

Already using Amazon Q Developer? Great! This guide will help you get more value from your interactions. If you haven’t set up Amazon Q Developer yet, check out the getting started guide.

Understanding the Impact of Good Prompts

The rapid adoption of AI technologies makes prompt engineering skills essential for today’s developers. McKinsey’s latest global survey reveals that 65% of organizations regularly use generative AI, nearly double from their previous survey. When developers master prompt engineering, they’re 25-30% more likely to complete complex tasks within given timeframes.

What Makes an Effective Prompt?

  • Specific Request: State exactly what you need
  • Clear Background: Describe your project, requirements, and constraints
  • Additional Context: Provide code, configuration, or other additional context
  • Expected Output: Specify how you want the information presented

Here’s how this works in practice:

Poor prompt:

How do I deploy a container on AWS?

Effective prompt:


I need to deploy a containerized Node.js e-commerce application that handles 
50,000 daily users with peak loads during promotional events.
Requirements:
- High availability across multiple regions
- MongoDB for persistence
- Auto-scaling capabilities

Please provide:
1. AWS architecture diagram
2. List of required services with configurations
3. Security best practices
4. Operational monitoring recommendations

Common Patterns to Avoid

Short or Vague Requests:

  • Add Docs
  • Make this better
  • Check this
'Add docs' simple prompt with generic response.

Not much to go on here. Amazon Q Developer will likely provide generic documentation.

'Check this' simple prompt with generic response.

Another vague prompt with a generic response.

Overly Broad Questions:

  • How do I use AWS?
  • What's the best practice?
  • Help with Lambda
Image showing the Amazon Q Developer IDE Chat panel where the user entered the vague prompt: 'Help with Lambda'. Amazon Q Developer responds by asking clarifying questions.

The prompt is so vague that Amazon Q Developer responds by asking clarifying questions.

Image showing the Amazon Q Developer chat pane where the user entered the prompt: "Create a Lambda function that processes S3 events."

The more specific prompt allows Amazon Q Developer to provide a more precise response.

Remember: The quality of information you receive directly correlates with the quality of the information you provide.

Proven Techniques for Better Results

To help you apply these principles consistently, I’ve developed a template structure that incorporates all the key elements of an effective prompt. This framework can be adapted for various scenarios and serves as a starting point for your interactions with Amazon Q Developer. While Amazon Q Developer will fill in some parts of this context (see the next post in this series), you just need to make sure this information is available.

These are the principles demonstrated in the template:

  • Technical Context Requirements
    1. Specify your technology stack and versions
    2. Include environment details
    3. Mention compliance requirements
    4. Define scale expectations
  • Example Specifications
    1. Include relevant code snippets
    2. Paste error messages
    3. Reference configuration files
    4. Show current architecture
  • Output Format Guidelines
    1. Request specific documentation formats
    2. Ask for diagrams when needed
    3. Specify code language preferences
    4. Indicate level of detail needed
Image showing the Amazon Q Developer chat panel with the user submitted prompt: "Document the requirements for an application that will process images. Format as a technical requirements document using markdown markup. Output as a single markdown code-block." The response is much more detailed, and aligns with the user's request.

The specification of the output format ensure the response is what you expect.

Quick Reference Prompt Template

Use this template to structure your prompts:


[Business Context] 
- Project description: 
- Performance requirements: 
- Compliance needs: 
- Scale expectations: 

[Technical Details] 
- Current technology stack: 
- Versions/dependencies: 
- Technical constraints: 
- Environment details: 

[Specific Request] 
- Task description: 
- Expected outcome: 
- Special considerations: 

[Output Format] 
- Desired format: 
- Level of detail: 
-  Examples needed: 
- Additional requirements:

Best Practices for Daily Use

Successfully working with Amazon Q Developer requires consistent application of proven practices. These guidelines, developed through extensive customer interactions, will help you maximize the value of your AI-assisted development experience.

  • Start with clear business objectives
  • Include relevant technical constraints
  • Specify performance requirements
  • Request specific output formats
  • Provide examples when possible

Through extensive customer interactions, we’ve found that following these practices consistently produces better results and reduces the need for follow-up clarification.

Take Action Now

Additional Resources

What’s Next?

In the next part of this series, we’ll explore advanced context management in Amazon Q Developer and dive into the new prompt catalog features. You’ll learn how to:

  • Build and maintain context across multiple interactions
  • Use the prompt catalog effectively
  • Handle complex, multi-step development tasks
  • Optimize responses for your specific use cases

Stay tuned, and start applying these techniques today to transform how you build on AWS!

About the author:

Will Matos

Will Matos is a Principal Specialist Solutions Architect at AWS, revolutionizing developer productivity through Generative AI, AI-powered chat interfaces, and code generation. With 25 years of tech experience, he collaborates with product teams to create intelligent solutions that streamline workflows and accelerate software development cycles. A thought leader engaging early adopters, Will bridges innovation and real-world needs.

Navigate Bulk Sender Requirements with Amazon SES

Post Syndicated from Vinay Ujjini original https://aws.amazon.com/blogs/messaging-and-targeting/navigate-bulk-sender-requirements-with-amazon-ses/

Introduction

Email communication remains a critical component of business operations and customer engagement. As the digital landscape evolves, major mailbox providers continually update their policies to enhance security and user experience. This blog will explore the changes implemented by Microsoft for bulk senders trying to reach Outlook.com (supporting Hotmail.com, live.com consumer domain addresses). This follows the Google & Yahoo! bulk sender requirements changes in February of 2024. Microsoft is implementing the enforcement of sender requirements for bulk email senders, particularly those sending over 5,000 messages daily, starting May 5, 2025. These requirements focus on improving email authentication and trust. This will ensure Outlook and Hotmail recipients are receiving messages that are authenticated and from who they claim to be from. These measures will help reduce spoofing, phishing, and spam, and safeguarding individuals and businesses relying on email.

This blog will discuss what these changes mean for you, and how Amazon Simple Email Service (Amazon SES) can help you maintain compliance and optimize your email sending practices.

Background

In February 2024, Google and Yahoo implemented new requirements for bulk email senders, building upon industry efforts to combat spam and improve email deliverability. These changes aligned with Google’s 2024 bulk sender requirements initiative, signaling a unified approach among major mailbox providers to enhance the privacy and compliance in email.

What does this mean for customers and email senders?

What’s Changing?

Microsoft’s New Requirements

  1. DMARC enforcement with at least a p=none policy
  2. Sender domain authentication (SPF, DKIM)
  3. Functional unsubscribe links required in the email
  4. Requirement for From and Reply-to addresses to be deliverable

Why These Changes Matter?

These new requirements serve several crucial purposes:

  1. Enhances trust in your sending domain: Validates that the sender is who they are claiming to be. Enhances trust by delivering messages that are authenticated and aligned with the bulk sender requirements.
  2. Improved Deliverability: Ensuring legitimate emails reach the recipients who have subscribed to sender’s messages.
  3. User-Centric: Providing recipients with control over their inboxes.
  4. Industry Standardization: Aligning sender requirements across major email providers

Best Practices for Compliance

To adhere to these new requirements and optimize your email sending practices, consider the following best practices:

1. Implement Strong Authentication

  • Configure SPF: SPF (Sender Policy Framework) is an email authentication standard that’s designed to prevent email spoofing. Domain owners use SPF to tell email providers which servers are allowed to send email from their domains. Follow setup instructions to authenticate your email with SPF. Must pass SPF for sending domain.
    • Configure “custom MAIL FROM“, which is how senders can ensure that the SPF-authenticated domain is aligned with the From header domain’s DMARC policy.
  • Enable DKIM signing: DomainKeys Identified Mail (DKIM) is an email security standard. It is designed to ensure that an email that claims to have come from a specific domain, was indeed authorized by the owner of that domain. It uses public-key cryptography to sign an email with a private key. Recipient servers use a public key, published to a domain’s DNS to verify that parts of the email have not been modified during the transit. Follow these set up instructions to authenticate email with DKIM in SES. Must pass to validate email integrity and authenticity.
    • Verify your domain with Easy DKIM. If currently using email identities, you have to move to domain
    • If you utilize email identities only, you will default all authentication to amazonses.com. That will not align with your friendly from address which will not satisfy the bulk sender requirements. This means that when you send email to mailbox providers, your messages will be rejected because you do not have proper authentication on your emails. To satisfy the bulk sender requirements, you must use domain verified identities which ensure that you have ownership of or permission to use the sending domain. That will allow SES to sign the outgoing emails with a DKIM signature that aligns with the friendly from domain.
  • Set up DMARC with an appropriate policy: Domain-based Message Authentication, Reporting and Conformance (DMARC) is an email authentication protocol that uses SPF and DKIM to detect email spoofing and phishing. To comply with DMARC, messages must be authenticated through either SPF or DKIM. Ideally, when both are used with DMARC, you’ll be ensuring the highest level of protection possible for your email sending.
Name Type Value
_dmarc.example.com TXT “v=DMARC1;p=none;rua=mailto:[email protected]

In the preceding records:

    • example.com is your domain
    • Value of the TXT record contains the DMARC policy that applies to your domain.
    • In this example, the policy tells email providers to do the following:
      • At least p=none should be implemented.

2. Optimize Email Content

  • Clearly identify yourself as the sender: Use a recognizable “From” name and email address that accurately represents your brand or organization. For example, use “[email protected]” instead of a generic or misleading address.
  • Implement user friendly unsubscribe mechanisms: Include a visible, easy-to-use unsubscribe link in every email, typically in the header. Ensure the unsubscribe process is simple and honors requests promptly, ideally within 24-48 hours. Visit this guide on how Amazon SES helps you do that.
  • Subject line aligns with content: Avoid deceptive subject lines that don’t match the email content.
  • Clearly identify commercial content: If your email is promotional, make it obvious. Use clear language in the subject line and body that indicates the nature of the email, such as “Special Offer” or “Newsletter.”
  • Include a valid physical address: Add your company’s physical mailing address in the email footer. This is not only a legal requirement in many jurisdictions but builds trust with recipients.
  • Verify URLS in the emails: Verify that links in the emails you send work and are not misleading to the reader/subscriber. Be transparent with URLs/links in the email content.

3. Monitor and Maintain

  • Monitor bounces: A bounce typically indicates why a message was not delivered. The SMTP response in the bounce message will have details on why the message was bounced. For example: if it is missing authentication records (fix: include authentication records for the domain – quick fix) versus an IP or domain reputation bounce reason (this maybe a longer term fix).
    • Track both hard bounces (permanent delivery failures) and soft bounces (temporary issues). High bounce rates can indicate list quality problems or delivery issues. Visit this blog to set up notifications for bounces & complaints. Virtual Deliverability Manager (VDM) is an Amazon SES feature that helps you enhance email deliverability. It helps increasing inbox deliverability and email conversions, by providing insights into your sending and delivery data. VDM advices on how to fix the issues that are negatively affecting your delivery success rate and reputation.
  • Track complaint rates: Regularly monitor the number of spam complaints your emails receive with a goal of keeping the complaint rate under 0.2%. Not all mailbox providers have complaint feedback loop data, so use aggregate data from the mailbox providers that do, such as Hotmail and Yahoo. Email providers that don’t provide complaint feedback loops, such as Gmail may have alternative dashboards or tools available like Google Postmaster tools.
  • Perform regular authentication checks: Periodically verify that your SPF, DKIM, and DMARC records are correctly set up and functioning. Alternative to manual DNS checks, Amazon SES has a feature in Virtual Deliverability Manager that performs authentication checks for your sending identities.
  • Maintain list hygiene: Regularly clean your email list by removing inactive subscribers, correcting typos in email addresses, and honoring unsubscribe requests. This helps improve deliverability and engagement rates.

How Amazon SES Helps

Amazon SES provides a robust set of features to help you meet these new requirements and optimize your email sending practices:

Authentication Support

  • Easy DKIM configuration
  • SPF record management
  • DMARC implementation guidance

Comprehensive Monitoring

  • Virtual Deliverability Manager
  • Complaint tracking
  • Bounce rate monitoring
  • Event publishing to Amazon CloudWatch, SNS , Kinesis Firehose and Event Bridge
  • Detailed sending statistics

Compliance Tools

  • List management capabilities (included with SES)
  • Suppression list handling (included with SES)
  • Feedback loop processing (included with SES)
  • Authentication status tracking: This is done through Amazon SES feature Virtual Deliverability Manager (VDM).

Implementation Strategy

To successfully implement these changes, consider the following strategy:

  1. Assessment: Audit your current email practices, review authentication status, and evaluate compliance gaps.
  2. Technical Implementation: Configure authentication protocols, update DNS records, and implement required unsubscribe mechanisms.
  3. Monitoring and Optimization: Track deliverability metrics, monitor complaint rates, and adjust sending practices as needed.

Measuring Success

To ensure ongoing compliance and optimize your email practices, track these key metrics:

  1. Delivery rates
  2. Complaint rates
  3. Authentication pass rates
  4. Engagement metrics (open rates, click-through rates)

Conclusion

The new bulk sender requirements from Microsoft and Yahoo represent an important step towards a more secure and reliable email ecosystem. By leveraging Amazon SES’s powerful features and following industry best practices, you can maintain compliance, improve deliverability, and enhance the overall effectiveness of your email communications.

Amazon SES is committed to helping you navigate these changes and optimize your email sending practices. For the most up-to-date guidance and support, please consult SES’s documentation or contact Amazon SES support.

Additional Resources

The email landscape is constantly evolving. Stay informed and adaptable to ensure your email practices remain effective and compliant.

About the authors: